Deuterated H in proto-planetary disks
Probing the gas and dust in proto-planetary disks is central for understanding the process of planet formation. In disks surrounding solar type protostars, the bulk of the disk mass resides in the outer midplane, which is cold (20 K), dense ( cm-3) and depleted of CO. Observing the disk midplane has proved, therefore, to be a formidable challenge. Ceccarelli et al. (2004) detected H2D+ emission in a proto-planetary disk and claimed that it probes the midplane gas. Indeed, since all heavy-elements bearing molecules condense out onto the grain mantles, the most abundant ions in the disk midplane are predicted to be H and its isotopomers. In this article, we carry out a theoretical study of the chemical structure of the outer midplane of proto-planetary disks. Using a self-consistent physical model for the flaring disk structure, we compute the abundances of H and its deuterated forms across the disk midplane. We also provide the average column densities across the disk of H, H2D+, HD and D, and line intensities of the ground transitions of the ortho and para forms of H2D+ and HD respectively. We discuss how the results depend on the cosmic ray ionization rate, dust-to-gas ratio and average grain radius, and general stellar/disk parameters. An important factor is the poorly understood freeze-out of N2 molecules onto grains, which we investigate in depth. We finally summarize the diagnostic values of observations of the H isotopomers.
Key Words.:
ISM: abundances – ISM: molecules – Stars: formation –ISM:1 Introduction
Proto-Planetary disks are the sites of planet formation. Their physical, dynamical and chemical structure and evolution determine if, when, how, where and what planets form. Two very important parameters that are difficult to determine are the gas mass of the disk, and the ionization degree. Critical questions that need to be answered by observations are: what is the evolution of the gaseous component of the disk, in particular with respect to the dusty component? Is it dispersed before or after dust coagulates into planetesimals and/or rocky planets? At what radius? By what process? At the same time, theory predicts that the accretion in the disk is regulated by its ionization degree (Balbus & Hawley 1998, Gammie 1996). So the questions here are: what is actually the measured ionization degree across the disk? What ionizes the gas? Cosmic rays and/or X-rays? Where do the two effects balance each other, if they do?
Observationally answering to those questions is all but an easy task, especially in solar type systems. This is because the bulk of the disk mass resides in the outer midplane, which is cold and dense. As a consequence, all heavy-bearing molecules freeze-out onto the grain mantles, and disappear from the gas phase where they could be observed. So the first difficulty in the study of the outer disk midplane is to find probes of it. Last year, Ceccarelli et al. (2004) detected abundant H2D+ in the proto-planetary disk which surrounds the solar type protostar DM Tau. They claimed that H2D+ probes the cold outer midplane and, in addition, its abundance is a direct measure of the ionization degree. The reason behind this claim is the peculiar chemistry of the H2D+ ion. The basic idea is that in cold and dense gas, where CO and all heavy-bearing molecules freeze-out into the grain mantles, two things happen: first, only H2 and the ions from this molecule, namely H and its isotopomers, remain in the gas phase; second, the molecular deuteration is dramatically enhanced, up to having H2D+/H larger than unity (Caselli et al. 2003). Therefore, Ceccarelli et al. concluded that a) H2D+ line emission probes the gas disk midplane, and b) the H2D+ abundance measures the ionization degree there.
In the present article, we examine the chemistry of the deuterated forms of H in proto-planetary disks, with the goal of exploring, on a solid theoretical basis, the exact diagnostic value of the H2D+ observations. Besides, the present study concerns also the other H isotopomers, HD and D. To accomplish the goal, we develop a chemical model of the outer disk midplane, focused in particular on the H deuteration chemistry. The physical model that describes the disk computes self-consistently the temperature and density profiles for a given disk mass and star luminosity (Dullemond et al. 2001; Dullemond & Dominik 2004). The chemical model is based on what has been understood from the studies of molecular deuteration in pre-stellar-cores and protostars, both observationally (see e.g. the review by Ceccarelli 2004) and theoretically (e.g. Roberts, Millar & Herbst 2003, 2004; Walmsley, Flower & Pineaut des Forets 2004, Flower, Pineaut des Forets & Walmsley 2004). Particular emphasis is devoted to the role of dust grains, and the effect of dust coagulation/fragmentation on the disk midplane chemical structure.
Aiming to give observable predictions, besides to provide the abundances of the H isotopomers across the disk, and the average column density of each species, we compute the intensities of the four ground state lines from the ortho and para forms of H2D+ and HD respectively. We carry out a wide parameter study, and explore the dependence of our results on three major parameters: the dust-to-gas ratio, the cosmic rays ionization rate, and the dust grain average sizes. Besides, we also discuss how the results depend on the basic properties of the star-disk system, namely the star luminosity, disk age, mass and radius. Finally, we discuss the case in which N2 disappears from the gas phase simultaneously with CO, which is not what has been observed so far, but what it would be expected based on the laboratory measurements of the N2 and CO binding energies (e.g. Oberg et al. 2005).
The article is organized as follows. In §2 we develop our model. In §3 we report the model predictions of a standard case, and as function of the parameters of the model. In §4 we discuss the diagnostic values of the observable quantities (line intensities and column densities). Finally, §5 summarizes the content of the article.
2 The model
In this section we describe the model that we developed to calculate the abundance profiles and the average column densities of H and its isotopomers across the disk, and the line emission of the two deuterated forms of H which have observable ground state rotational transitions, H2D+ and HD.
2.1 Disk structure
For the model calculations we use a model of passively irradiated hydrostatic flaring circumstellar disks (Dullemond et al 2001; Dullemond & Dominik 2004). This model computes the structure (i.e. the density and temperature distribution) in a selfconsistent way. In the center of the disk, a low-mass star is located with a mass of and a luminosity of . Around the star we distribute of material in a disk ranging from 0.1 AU to , with a surface density powerlaw , implying that the disk mass per unit radius is constant, i.e. both inner and outer disk contain significant amounts of mass. The disk contains dust at a mass fraction of which we assume to be fully mixed with the gas. While in reality, there probably exists a distribution of grain sizes in the disk, we choose a single grains size for the present calculation. This allows us in a simple way to study the effects of grain size. The structure of the disk is then computed by iterating between a 1+1D continuum radiative transfer which computes the dust temperature in the entire disk, and a hydrostatic equilibrium code which computes the vertical density and pressure distribution under the assumption that the gas and dust temperatures are equal. For the technical details of the modeling procedure we refer to Dullemond et al (2001). A typical temperature and density profile across the disk (our standard case described in §3.1) is shown in Fig.1. The disk is flaring as can be seen from the upwards-curved temperature contours. We anticipate that heavy-elements bearing molecules will freeze-out, and therefore H deuterium fractionation will be significant at about 25 K (approximatively the CO condensation temperature for the involved densities) and below. These conditions are only fulfilled in the outer disk, approximately outside of 20 AU. The low temperature region becomes geometrically thick at large distances from the star. For example, at a distance of 300 AU, the 15 K contour reaches a height of 60 AU. Typical densities in this region are cm-3 and above, up to cm-3 in the innermost parts of the outer disk, near 100 AU.

2.2 Chemistry of deuterated H
Complex chemical networks are often necessary to compute the abundances of molecules in interstellar environments. In particular in regions with a rich chemistry, it is difficult to predict which are the important reactions leading to and from a certain molecule (e.g. Semenov, Wiebe & Henning 2004). However, in the cold and metal-depleted regions in protostellar cores and circumstellar disks, the chemical network is limited and a much simpler treatment is possible. Also, if the chemical timescales involved are short, a steady state solution of the chemistry is often appropriate. In the following we address the most important processes leading to the formation of deuterated H and develop a set of equations for the steady state solution of this network.
In gas under standard molecular cloud conditions, H ions are formed with a rate by the ionization of H2 (and He) due to cosmic rays, and destroyed by the reactions with all neutral molecules and atoms in the gas, and by recombination reactions with electrons and grains. The reaction H with H2 – the most abundant species in molecular gas – returns H and therefore has no net effect on the H abundance. However, the reaction with HD, the most abundant H2 isotopomer, forms H2D+:
| (1) |
with a rate coefficient (see Table 1). The backward reaction is endothermic with an energy barrier of about 220 K. At low temperatures, it is inefficient, making the reaction 1 the effective route to H2D+ formation. When considering the abundances in cold molecular gas, the most important molecules which cause destruction of H are: HD, CO (the second most abundant molecule after H2), and N2 (see §2.3). Also recombination with grains (see § 2.5) is an important process. Equating H formation and destruction rates, and ignoring the destruction by molecules/atoms less abundant than CO and N2, the equilibrium abundance ratio between the H and H2D+ is given by the following equation:
| (2) |
where the rate coefficients are defined in Table 1, is the electronic abundance, and [D] is the elemental abundance of deuterium relative to H nuclei, equal to (Lynsky 2003).
| Reaction | rate | |||||
|---|---|---|---|---|---|---|
| cm3s-1 | K | |||||
| 1.7(–9 ) | 0.0 | 220 | ||||
| 6.6(–10) | –0.5 | |||||
| 6.8(–8) | –0.5 | |||||
| 8.1(–10) | 0.0 | 187 | ||||
| 6.6(–10) | –0.5 | |||||
| 6.0(–8) | –0.5 | |||||
| 6.4(–10) | 0.0 | 234 | ||||
| 6.6(–10) | –0.5 | |||||
| 6.0(–8) | –0.5 | |||||
| 6.6(–10) | –0.5 | |||||
| 2.7(–8) | –0.5 | |||||
Notes: implies
As noticed by other authors (e.g. Caselli et al. 2003), the H2D+/H ratio, given by Equation 2, can be larger than unity if the gas is cold and very depleted of CO and N2. In the limit of very cold and completely depleted gas, it reaches (Walmsley et al. 2004).
Just like H, H2D+ is destroyed by reacting with molecules, atoms, electrons, and grains. In analogy with H, the interaction of H2D+ with HD leads to the formation of HD, whereas the reaction with H2 is endothermic and therefore suppressed at low temperatures.
| (3) |
As in the case of reaction (1), the reverse reaction of (3) is endothermic, and therefore inhibited at low temperatures. H2D+ is therefore destroyed by reactions with HD, CO, N2, electrons, and grains, and forms HD. In the same way, the triply deuterated form of H is formed by the successive reaction of HD with HD:
| (4) |
and destroyed by the reaction with CO, N2, grains and electrons. Now the reaction D + HD just exchange the deuterium atoms, and D is therefore the dead-end of the chain. As in the case of Equation 2, the abundance ratios of HD and D with respect to H2D+ and HD respectively can be derived by equating formation and destruction rates:
| (5) | ||||
| (6) |
One can easily see that the HD/H2D+ ratio can reach unity. In the limiting case of very low temperatures, extreme CO and N2 depletion and low ionization, it reaches a value of . On the other hand, the abundance of D is only limited by the electron abundance. In extreme conditions – cold and heavily CO and N2 depleted gas – D can be the dominant charge carrier.
Table 1 summarizes the reactions involving H and its isotopomers, along with the rates used in this study. The reaction rates have been taken from Roberts et al. (2003, 2004), except for recombination reactions on grains which we discuss in §2.5.
In practice, the adopted chemical network is a small subset of the extensive chemical networks implemented by Roberts et al. (2003, 2004) or Walmsley et al. (2004) or Flower et al. (2004). Our goal here is to study the behavior of the H and its isotopomers, which can indeed be described by the few equations discussed above. This sets the limit of applicability of the present model to regions where CO and N2 are the only molecules affecting the H chemistry. Furthermore, we did not treat the ortho and para forms independently, but used, when necessary, the results by Walmsley et al. (2004) and Flower et al. (2004).
With this reduced chemical network, we are able to reproduce the results by Roberts et al. (2003, 2004), Walmsley et al. (2004) and Flower et al. (2004) accurately as far as the abundances of the deuterated forms of H are concerned.
2.3 CO and N2 freeze-out
The CO and N2 abundances are obviously critical parameters in the deuteration of H. CO is known to freeze-out onto the grains mantles at large enough densities ( cm-3) and low temperatures ( K) (e.g. Caselli et al. 1999; Bergin et al. 2001; Bacmann et al. 2002; Tafalla et al. 2002). Recent laboratory experiments show that the CO binding energy depends on the matrix where CO is embedded (e.g. Collings et al. 2003; Fraser et al. 2004; Oberg et al. 2005). It varies from 840 K in CO-CO ices (average of the values measured by Collings et al. 2003 and Oberg et al. 2005), to 885 K in a CO–N2 ice (Oberg et al. 2005), and 1180 K in a CO–H2O ice (Collings et al. 2003; Fraser et al. 2004). In this study, we will adopt the value 885 K.
There is overwhelming observational evidence, mainly towards pre-stellar cores, that N2H+ remains in the gas phase at larger densities than CO (e.g. Caselli et al. 1999; Bergin et al. 2001; Tafalla et al. 2004; Pagani et al. 2004; Crapsi et al. 2005). Since N2H+ is believed to be formed from N2, these observations suggest that N2, which is the major nitrogen reservoir, freezes-out onto grains at higher densities than CO. The reason for that is not fully understood, because the binding energy of N2, measured in the laboratories, is only slightly lower that the CO binding energy: 790 K in a pure N2 ice and 855 K in a N2-CO ice (Oberg et al. 2005). However, the effect of having N2 in the gas phase where CO molecules disappear greatly influences the abundances of H and its isotopomers, because it causes an additional term of H (H2D+ and HD) destruction in Equation 2 (and Eqs. 5 and 6). Therefore, we decided to adopt a semi-empirical approach, and to assume that the binding energy of N2 is 0.65 times that of CO, following the theoretical studies of other authors (e.g. Bergin et al. 1995, 1997). However, we will discuss the effect of a larger N2 binding energy, as measured in laboratory, in §3.4.
We treat the freeze-out of CO and N2 in a time-dependent way. CO molecules freeze out onto the grain mantles at a rate:
| (7) |
where we adopted a sticking coefficient (Burke & Hollenbach 1983), and a mean grain radius of . The grain number density is given by the (mass) dust-to-gas ratio multiplied by the gas density , and divided by the grain mass (see Eq.(15)). A similar equation can be written for N2.
Frozen CO and N2 molecules can be released back into the gas phase by thermal evaporation, and we followed the first order desorption kinetics approach to describe it (Hasegawa & Herbst 1993):
| (8) |
where s-1 is the lattice frequency, is the binding energy per molecule of CO and N2 ice respectively, and is the Boltzman constant.
Cosmic rays also contribute to the release of CO and N2 from the ice, with a rate of (Hasegawa & Herbst 1993):
| (9) |
The time dependent number density of gaseous CO, , is therefore given by the solution of the following equations:
| (10) | |||
| (11) |
where we adopted the CO abundance observed in molecular clouds, (Frerking et al. 1982). is the number density of frozen CO molecules. Similar equations can be written for N2, where the N2 abundance in molecular clouds is assumed to be (Bergin et al. 1995, 1997). In our model, the CO and N2 abundances in the gas phase across the disk depend therefore on the time. They start at time=0 equal to their relative molecular cloud abundances. At large times, they are given by the equilibrium between thermal evaporation, cosmic ray desorption and freeze-out onto the mantles (Leger et al. 1986).
Note that we do not treat in any way the CO and N2 photo dissociation by the UV and/or X-rays photons emitted by the central star. Therefore, our model just describes the regions where those photons are fully shielded, i.e. the warm molecular layer and the cold midplane of sufficiently massive disks. As our model focuses on the H and its isotopomers only, it does not have any vocation in treating the CO and/or N2 chemistry, other than computing their disappearance from the gas phase because of the freezing onto the dust grains. Besides, our model does not consider any possible grain surface chemistry involving CO and N2, which may transform (part of) condensed CO (and N2) into different, more complex molecules.
2.4 Charge balance
Ionization in disks can be due to cosmic rays, X rays and UV rays. For the current study we restrict ourselves to regions of the disk which are shielded from UV radiation and X rays, i.e. to the disk midplane. In this case, cosmic rays are the dominating source of ionization (Semenov, Wiebe & Henning 2004).
In regions where the heavy-elements bearing molecules are depleted, the positive charge is carried by the H-bearing species, namely H, its isotopomers, and H+. The negative charge, on the other hand, is mostly carried by free electrons. The fraction of electrons attached to grains remains small, in particular if the smallest grains have been removed by coagulation (Walmsley et al. 2004). We will therefore ignore negatively charged grains when computing the abundances of H+, H (with isotopomers), and .
Similar to H (see §2.2) H+ is formed by the interaction of cosmic rays with H2, with a rate . Recombination of H+ occurs mainly on grains because the direct recombination with electrons is too slow, and the proton exchange with HD. The abundance of H+ is therefore independent of the electron density. Equating the formation and destruction rates, we have:
| (12) |
where is the cosmic ray ionization rate. The recombination rate on grains kgr is discussed in § 2.5.
The electron abundance may be derived by equating the cosmic ray ionization rates with the processes removing electrons from the gas. As source term of free electrons we consider the reactions and . As electron sink term we use the recombination of H and its isotopes with electrons, with a dissociative recombination rate , measured by McCall et al. (2003) to be at 10 K. In addition, we assume that every recombination of H (and its isotopomers) and H+ on grains remove an electron from the gas. This is a reasonable assumption because positively charged grains quickly recombine with free electrons, consistent with the very low abundance of positively charged grains found by (Walmsley et al. 2004). This leads to the following balance equation for the electron density:
| (13) |
where is the total abundance of H and its isotopomers, and is the average mass of these molecules which we set equal to . Together with charge conservation , a 2nd degree equation for the electron density results which can be easily solved.
We can consider two limiting cases. If the electron abundance is set by the recombination of electrons with H and its isotopes, we can expect the canonical dependence . If on the other hand the electron abundance is set by recombination of H+ on grains, the electron abundance will be where is the number density of grains. We will use this difference below to identify the main recombination process in the model calculations.
2.5 Recombination on grains

At low electron densities, collisions of ions with grains become an important contributer to the recombination rates. This is true in particular for protons, and, depending on the rate coefficients for dissociative recombination, also for molecular ions. At high densities, the charge distribution is dominated by neutral and singly negatively charged grains. Draine and Sutin (1987) argue that the sticking coefficients for positive ions on both neutral and negatively charged grains should be 1. The different recombination rates then only depend on the Coulomb focusing factor in the collision cross section. The Coulomb focusing factor is given by Draine & Sutin (1987) as a function of the grain charge, ion charge and the gas temperature. For a full treatment, the relative abundances of neutral and negatively charged grains would have to be calculated, as e.g. done by (Walmsley et al. 2004). However, in the case of really dense environments, in which the abundance of small grains is small due to the effects of dust coagulation, a simplified treatment is possible. Fig.2 shows the ratio . While for very small grain sizes and extremely low temperatures this ratio can be very large, in the region of parameter space studied in this paper the factor is reasonably small. For 0.1, the ratio is already down to 5.7. For larger grains and somewhat higher temperature, the ratio gets closer to one. For simplicity we therefore choose the following approach. We assume that a fraction of the grains is negatively charged, and that of the grains are neutral. The recombination rate coefficient is then given by (Draine & Sutin 1987):
| (14) |
Choosing , we expect an error in the recombination rates from this approach no larger than a factor of 3.
Finally, because of the uncertainties of the grain size distribution in the midplane of a disk, we use only a single grain size for each model. Assuming a density of the grain material of 2.5 gr cm-3, the dust-to-grain ratio in number density is given by:
| (15) |
2.6 H2D+ and D2H+ line intensities
H2D+ and D2H+ both appear in the para and ortho forms. Gerlich, Herbst and Roueff (2002) have discussed in detail the issue, and found that at low temperatures the ortho to para ratio of H2D+ is close to unity. Subsequently, Walmsley et al. (2004) have shown that the H2D+ ortho to para ratio indeed varies weakly with the density in completely depleted regions, and it is around 0.2 at densities cm-3. Since the present study focuses on the outer disk midplane where the densities are larger than cm-3, we do not calculate the H2D+ ortho-to-para ratio from a chemical network, but simply assume it to be 0.3. Finally, Flower et al. (2004) find that the HD ortho-to-para ratio is equal to 10 for large densities and low temperatures.
The ortho and para forms of both H2D+ and HD have ground transitions in the submillimeter to Far-IR (Tera-Hertz) range (Hirao & Amano 2003): 372.4 and 1370.1 GHz for the o-H2D+ and p-H2D+ respectively, and 1476.6 and 691.7 GHz for the o-HD and p-HD, respectively. The o-H2D+ and p-HD transitions are observable with ground based telescopes (CSO and JCMT today, APEX and ALMA in the near future), whereas the other two transitions can only be observed with airborne and satellite telescopes, in particular SOFIA and the upcoming HERSCHEL mission. In this study, we report the line intensity of the four transitions, computed with a non-LTE code which treats self-consistently the line optical depth (Ceccarelli et al. 2003)111The code has been adapted to the disk geometry., assuming that the disk is seen face-on. Note that, for the disks studied in this article, the line optical depth in the face-on configuration never exceeds unity though, so that the lines are in practice always optically thin. The collisional coefficients are not well known, and we assumed that the critical density of all the H2D+ and HD ground transitions are cm-3 derived using the H2D+ scaled collisional coefficients by Black et al. (1990). Since the regions where the lines originate have relatively large densities ( cm), the levels are mostly LTE populated, and the uncertainty on the collisional coefficients is, therefore, not of great importance here. The line fluxes are given in erg s-1cm-2 assuming a source distance of 140 pc. For an easy comparison with the presently available observations, we also give the o-H2D+ (at 372 GHz) and p-HD (at 691 GHz) line fluxes in main beam temperature, assuming that the observations are carried out at the CSO and JCMT telescopes respectively.
3 Results
In this section we discuss the results of the model calculations, namely the abundances of the H2D+, HD and D across the disk. One major goal of this article is to give predictions for observations of the two deuterated forms of H that have ground rotational transitions in the submillimeter wavelength range: H2D+ and D2H+.
We first explore in detail our standard case, which is a disk with canonical values for parameters like dust-to-gas ratio, cosmic ray flux and grain sizes, properties not easily derived from observations. In§ 3.2 we study the dependence on these parameters. In § 3.3 we address system properties that are generally known from other observations: the total dust mass, the disk size, and the stellar luminosity. Finally, in § 3.4 we discuss the influence of one important model assumption, the binding energy of N2 and CO ice.
3.1 The standard model
Our standard model is a disk with a dust disk mass equal to M⊙ surrounding a 0.5 L⊙ star whose Teff=3630 K (see §2.1). The dust-to-gas ratio is 1/100 in mass, and we use the canonical cosmic ray ionization rate s-1. We assume that the disk is yr old, and extends up to 400 AU. Figure 1 shows the density and temperature profiles across the disk of our standard case.
Figure 3 shows the abundances of CO and N2 respectively, across the disk. CO molecules disappear from the gas phase where the dust temperature is around 25 K, at a radius larger than about 100 AU and at heights lower than about 1/4 of the radius. Since the density is large in those cold regions, the drop in the abundance is very sharp, more than a factor 100. The largest CO depletion occurs between about 100 and 200 AU, where it is larger than times. At larger radii it is a factor 10 lower. N2, however, remains in the gas phase in a much larger region, and, therefore, dominates the destruction rates of H (and its isotopomers). It is only in the very outer regions, at a radius larger than about 300 AU that N2 freezes-out onto the grains and almost totally disappears from the gas phase. The intermediate region, where CO is depleted but N2 is not, is where the deuteration of H takes place in a “moderate” form, namely where the H2D+/H ratio is enhanced with respect to the elemental D/H abundance, but D is not the dominant positive charge carrier.

Figure 4 shows the H+, H isotopomers, and electron abundance profiles of the standard disk respectively. We limit the plot of the chemical composition to regions where the CO depletion is larger than a factor of 3. The choice of 3 is a somewhat arbitrary. It represents when the CO abundance is similar to that of N2, or, in other words, when the role of these two molecules -believed to be the most abundant gaseous molecules at low temperatures- becomes of similar importance in the H reactions, the H deuteration becomes to be significant, and our simplified model correct.
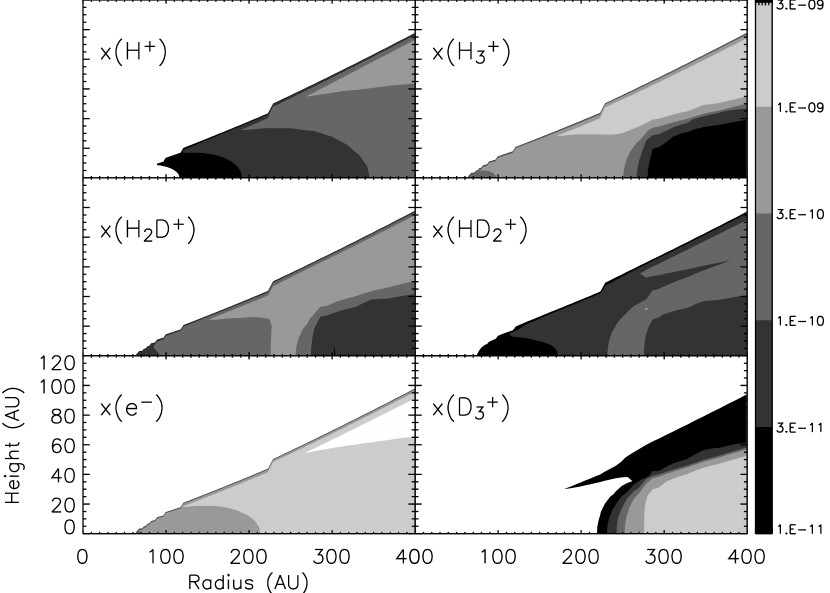
The electron abundance, is between 3 and in the outermost region, at radius AU, increasing going towards the upper layers of the disk. The results are in reasonable agreement with the ionization structure computed by Semenov et al. (2004). In most of the disk, the positive charge is carried by H, which becomes less important where also the N2 disappears from the gas phase, at radius 300 AU. H2D+ is the most abundant H isotope, except in the radius 300 AU region, where D takes over, and become the most abundant positive ion. H+ never plays a major role as charge carrier across the entire disk, even though its abundance is comparable to that of H2D+ in outer upper levels of the disk.
The average column densities of a face-on disk of the H isotopes and the electrons in the region where the CO depletion is larger than 3 are reported in Table 2. The D column density is the largest, and it is about larger that of H2D+. The two isotopes together account for almost half of the overall positive charge in the disk midplane. The HD column density is twice smaller than the H2D+ column density. These values are dominated by the outer region, where both CO and N2 are frozen-out onto the grains, and hence, D becomes the dominant positive charge carrier.
| Species | Column Density (cm-2) |
|---|---|
| H2D+ | |
| HD | |
| D | |
| e- |
The line intensities of the four ortho and para H2D+ and the HD ground transitions are reported in Table 3.
| o-H2D+ | p-H2D+ | o-HD | p-HD | |
|---|---|---|---|---|
| Transition | ||||
| (GHz) | 372.4 | 1370.1 | 1476.6 | 691.7 |
| Flux erg/s/cm2 | 8.2e-18 | 1.0e-16 | 5.7e-17 | 2.6e-18 |
| Tv (mK km/s) | 18.8a | - | - | 4.8a |
a Note: the main beam efficiency is assumed to be 0.6 at CSO and 0.3 at JCMT.
3.2 Ionization rate, dust-to-gas ratio and grain sizes as important factors for the abundances
Important parameters of the model are the cosmic ray ionization rate, the dust-to-gas ratio, and the grain sizes, all of which are relatively ill known. One goal of this theoretical work is to provide predictions of observable quantities which can help to constrain these parameters, which all play a key role in the evolution of the proto-planetary disks and the eventual planet formation (see Introduction).
In order to investigate the influence of the cosmic ray flux and of the dust-to-gas ratio, we have computed a grid of models where we vary these parameters within a factor 100 of the standard value. Since the structure of the disk is fully determined by the dust opacity, changing the dust-to-gas ratio simply implies scaling the gas density while all other factors like gas temperature and grain number density remain constant. Figure 5 shows the column densities as a function of the cosmic ray ionization rate normalized to , and of the dust-to-gas ratio. It is immediately obvious that the electron column density varies as a simple powerlaw . This corresponds to an electron abundance dependence , indicating that cosmic ray ionization and dissociative recombination of electrons with the charge carrying molecules (H and its isotopes in this case) are determining the electron abundance. This is consistent with the isotopes of H being the main charge carriers. Because throughout the plot, the dust grain density is constant (changing only changes the gas density), recombination on grains would lead to a dependence .
The shape of the contours for the column densities of H2D+ and D2H+ are similar to those of e-, again indicating that these molecules are the dominant charge carriers. D shows a similar behavior for very low dust-to-gas ratios (i.e. high gas densities) and normal or low cosmic ray ionization rates. However, for very low gas densities (high dust-to-gas ratios) and for very high ionization rates, the contours become vertical, indicating that the column density becomes independent of the ionization rate. A similar but smaller effect can also be observed for the column densities of H2D+ and HD at high dust-to-gas ratios. This is due to the fact that at low gas densities (corresponding also to low electron densities), the recombination of these molecules on grains starts to become important and leads to a faster decrease in the abundances.


Figures 6 to 7 are similar to Fig. 5, but using a disk model with different grains sizes. We have used grain sizes of 0.01, and 1.0, to study the cases of very little dust growth compared to the interstellar medium, and significant dust growth. Since the total dust mass in the model is constant, reducing the grain size corresponds to an increase in the number density of grains, and also in the total grain surface per cm3. This does favor recombination on grains as a destruction route of H and its isotopes. This is indeed visible, in particular at high dust-to-gas ratios, the column densities of all three molecules are strongly decreased, and almost independent of the ionization rate.
A different effect can be observed in the calculation for large grains. In this case, the column density of electrons greatly exceeds that of the H isotopes, in particular in the upper left part of the diagram, at high ionization rates and high gas densities. The electron column density contours are closer together, indicating a linear dependence on ionization rate and gas density. As discussed in § 2.4, this is an indication that H+ is now the dominating positive charge carrier and that recombination of H+ on grains has taken over as main electron destruction mechanism. The reason for the significant decrease in deuterated H abundance compared to cases with smaller grains is caused by smaller CO/N2 depletions. The larger grains provide less grain surface for these molecules to freeze out and shift the abundance ratios away from the deuterated species towards H. The column densities of H2D+, HD and D all have a maximum at normal cosmic ray ionization rates. If the cosmic ray flux is further increased, the column densities degrease again, because the CO/N2 depletion becomes less efficient. Also for smaller grains, the same effect is expected, but at much higher fluxes.

Figure 8 shows the dependence of the H2D+ and HD line fluxes on the cosmic ray ionization rate and the dust-to-gas ratio. For an easy comparison with observations obtainable at CSO and JCMT we also show plots with the velocity-integrated mean beam temperatures of the o-HD at 372 GHz and p-HD at 691 GHz lines respectively (Figure 9).

The curves of the o-H2D+ and p-HD line intensities run practically parallel, so that the simultaneous observation of the two lines would not depend on the parameters of the model, but the ortho-to-para ratio of each species. They can therefore be “safely” used to derive the relative ortho-to-para ratio of H2D+ with respect to HD.
3.3 The basic stellar and disk properties
The basic stellar and disk parameters such as stellar luminosity, dust mass in the disk and disk size can normally derived independently. We therefore do not enter into a full parameter study of these quantities. Instead, we limit ourselves to describe the main trends by looking at single-parameter changes from the standard model. Table 4 summarizes the results of these calculations. The stellar and disk parameters mainly change the local densities in the disk, or the temperature. Temperature increase influences the excitation of the lines, and may reduce depletion. Density changes modify the degree of ionization and again the depletion efficiency. The results, summarized in Table 4, show that changes of a factor of two in any of the parameters have only limited effects on the line fluxes, in all cases less than a factor of two. The largest changes occur when the disk radius is changed, mostly because of the larger/smaller integration emitting region.
| Parameter | o-H2D+ | p-H2D+ | o-HD | p-HD |
|---|---|---|---|---|
| 1.21 | 1.46 | 1.23 | 0.86 | |
| 0.73 | 0.73 | 0.73 | 0.77 | |
| 1.44 | 1.45 | 1.46 | 1.46 | |
| 0.75 | 0.82 | 0.73 | 0.60 | |
| 1.64 | 1.43 | 1.38 | 1.65 | |
| 0.51 | 0.73 | 0.65 | 0.40 |
3.4 High N2 binding energy
As mentioned in §2.3, there is a discrepancy between the measured binding energy of N2 onto the grains -which is similar to the CO binding energy- and the observations in pre-stellar cores -which show that N2 molecules condense onto the grains at a larger density, and therefore, suggest a N2 binding energy lower than the CO one. In our standard model, discussed in the previous paragraphs, we adopted that the N2 binding energy is 0.65 times that of CO, in agreement with the modeling of the pre-stellar cores observations (e.g. Bergin et al. 1995, 1997). It is also worth noticing that observations of N2H+ in a proto-planetary disk support indeed the lower binding energy for N2 (Qi et al. 2003). However, for the sake of completeness, here we explore the influence of this assumption on the results.
As shown in Figure 3 and previously discussed, the low N2 binding energy implies that N2 molecules remain in the gas phase in a large region where CO is frozen-out onto the grains. It is therefore clear that the presence or not of N2 in the gas phase will have a strong impact on the modeling results.
Figure 10 shows the column densities of H, H2D+, HD and e- as function of the dust-to-gas ratio and the cosmic ionization ratio, similarly to Figure 5. The comparison of the two figures speaks for itself. If N2 has a binding energy comparable to that of CO (Figure 10), D is the positive charge carrier across most of the outer disk, in the standard case (dust-to-dust ratio equal to 0.01, and cosmic ray ionization rate equal to s-1), and H2D+ and HD are 30 times less abundant. On the contrary, if N2 has a reduced binding energy (Figure 5) the positive charge is almost equally shared between D, H2D+ and H. This is because the N2 collisions are an important destroyer of the H, H2D+ and HD, preventing the “total conversion” of H into D.
If the CO and N2 binding energies are similar, increasing and/or decreasing the dust-to-gas ratio does not change much the H2D+ and/or HD column densities. In practice, increasing/decreasing the gas density with respect to the dust density does not change the H2D+ and HD column densities, but just increases/decreases the D column density -the positive charge carrier. This has an important observational consequence, for the H2D+ and/or HD observed column densities cannot constrain the dust-to-gas ratio in a large interval.

However, it is worth noticing that, in principle, the ratio of the derived average column densities can help to discriminate whether N2 is present in the gas phase or not. Finally, observations of the N2H+ in proto-planetary disks will also help to clarify whether N2 remains in gas phase after CO condenses (Qi et al. 2003).
4 Discussion
4.1 Simplified treatment of the chemical network
In this paper we have introduced a simplified chemical network to compute the abundances of deuterated H. The network treats only the four isotopes of H, electrons, H+, CO, and N2. Comparison with more extensive networks shows that the abundances of the {H,D} ions can be calculated accurately under the conditions of significant CO and N2 depletion. The reason for this success is that the chemistry indeed becomes very simple under these conditions. CO and N2 are the last heavy-elements bearing molecules with significant abundances to leave the gas phase and to freeze out on dust grains. Together with dust grains, they act as the main destroyers of H and its isotopes. The simplified chemical network is, under these conditions, in fact complete in that it treats all important species and reactions. Under the assumption that the freeze-out of CO and N2 has reached its steady state, the steady state solution for this network can be derived directly, no time integration of the rate equations is necessary. The chemical network, therefore, lends itself for large parameter studies of cold gas.
4.2 The main charge carrier in the disk midplane
In the discovery paper of the H2D+ line in DM Tau and TW Hya, Ceccarelli et al (2004) had suggested that H2D+ may be the main charge carrier under the conditions found in a disk, which would allow for a direct derivation of the degree of the column density of positive ions by observing H2D+. With an H2 column density derived from dust continuum observations, this number directly leads to the degree of ionization, a much sought-after property of disk gas because of its importance for the magneto-rotational instability, the likely driver of disk turbulence. This conclusion has to be softened in the light of the present results. Our calculations show that H2D+, HD, D and H all carry similar amounts of charge, indicating that the observed column densities of H2D+ and HD provide both an order-of-magnitude estimate of the degree of ionization, and a lower limit. It was shown earlier (Walmsley et al. 2004) that complete depletion in protostellar cores generally leaves H+ as the main charge carrier. This trend, however, clearly ends at the densities found in disks: H and its isotopes contribute equally or dominate the charge balance.
In this context, the binding energy of N2 is of critical importance. If N2 freezes out at the same moment as CO, then the disk midplane are indeed fully depleted of heavy element bearing molecules. Then, there is no important destruction route for D anymore, and the abundance of D sores to dominate the charge balance. If N2 indeed stays in the gas longer than CO, as suggested by observations in a proto-planetary disk (Qi et al. 2003), H2D+ and HD are produced in significant abundances and do provide a measure of the degree of ionization.
4.3 H2D+ and HD as tracers of cold gas
One major question we aim to answer with the current study is: under what conditions are the observable lines of H2D+ and HD tracers of the gas mass in the disk midplane? For these molecules to be a tracer, the observed line intensities must be a strong function of the dust-to-gas ratio. As we have seen in Figures 5 and 10, the answer to this question depends on the behavior of N2. If N2 freezes-out at lower temperatures than CO -as supported by the observations in a proto-planetary disk (Qi et al. 2003)-, then the observed line intensities do depend strongly on the dust-to-gas ratio and can be used to measure it. However, under the conditions of complete depletion, i.e. if also N2 is completely removed from the midplane gas, the line intensities become insensitive to the dust-to-gas ratio.
Fortunately, observations of N2H+ in disks can discriminate what is the reality, namely whether in the disk midplane CO and N2 disappear simultaneously from the gas phase or not, and, therefore, whether H2D+ and HD are the main positive charge carriers or D is. In the first case, observations of H2D+ and HD will give a measure of the dust-to-gas ratio, once the cosmic ionization rate is known. This also implies that H2D+ and HD measure the ionization degree in the disk midplane too, as assumed by Ceccarelli et al (2004). Once again, we emphasize that the available observations (Qi et al. 2003) support this case.
4.4 Dust coagulation
An important result of this study is the dependence of the chemical structure of the disk midplane on the average dust grain size. Figure 9 shows that the line intensities of the o-H2D+ and p-HD are strongly affected by the average grain sizes, if they are larger than 0.1 m radius. In practice, if small dust grains are significantly depleted in the midplane, the line intensities decrease dramatically, because CO and N2 do not freeze-out efficiently on the reduced grain surfaces (see the discussion in §3.2), and no substantial molecular deuteration takes place. The detection of the o-H2D+ and p-HD at the level of the current instrumental sensitivity is, therefore an indication that enough grain surface is still available to account for the molecular depletion. Two scenarios are possible for this. First, coagulation might not be efficient or aggregate destruction is efficient in keeping the number density of small grains at reasonable values. This is in fact in agreement with recent results of grain coagulation which suggest that coagulation at maximum efficiency is inconsistent with the observed opacities and shapes of flaring circumstellar disks (Dullemond & Dominik 2005). Another possibility is that the depletion of CO and N2 is very efficient in the beginning, before coagulation happens. Efficient coagulation could then form large bodies that bury the ice inside and protect it from cosmic ray desorption. These considerations show that detailed models of coagulation, vertical mixing and freeze-out in combination with observations of H isotopes can be useful diagnostics of grain coagulation.
5 Conclusions
We have computed the chemical structure of the midplane of disks surrounding solar type protostars. We have described the derived abundances and the resulting line intensities of the deuterated forms of H in a standard case, and for a wide range of values of the dust-to-gas ratio and cosmic ray ionization rate. We have also discussed in detail the influence of the average grain sizes on the results. Finally, we have reported values also for different stellar luminosities, disk masses and radii, and discussed in detail the case of the N2 freezing onto the grain mantles simultaneously with CO. Our main conclusions are:
-
•
H deuteration is significant in the midplane of proto-planetary disks around solar type protostars. In our standard case, the positive charge is carried by H in a large zone of the disk midplane, except at the very outer radii, larger than about 300 AU, where D takes over. H2D+ is the most abundant H isotope across most of the disk, at radii less than about 300 AU.
-
•
Contrary to what was earlier assumed, H2D+ is not the dominating positive ion in the standard case. H and its isotopes are equally important. With increasing depletion of CO and N2, D becomes more abundant, eventually dominating as the positive charge carrier. Also, H+ is only of minor importance. While at the pre-stellar-core densities, lower than 107cm-3, H+ dominates (Roberts et al. 2003, 2004; Walmsely et al. 2004), in the disk midplane this is no longer the case.
-
•
The midplane chemical structure and the predicted line intensities of the H2D+ and HD are a strong function of the local cosmic ray ionization rate, which regulates the overall ionization degree, and the CO and N2 depletion across the disk.
-
•
The chemical structure and line intensities are also sensitive to the dust-to-gas ratio as long as depletion of heavy-element bearing molecules is not complete. This happens if the N2 binding energy is lower than the CO binding energy, as observed in pre-stellar-cores and possibly in proto-stellar disks. If, on the contrary, N2 freezes-out simultaneously with CO, as laboratory experiments would rather suggest, since the major charge carrier is D, increasing/decreasing the dust-to-gas ratio does not change appreciably the H2D+ and HD2 column densities and/or line intensities.
-
•
The grain size has strong influence on the line strength expected for H2D+ and D2H+. Small grains accelerate recombination and reduce the abundances of all positive ions, and therefore decrease the degree of ionization.
This article focuses entirely on theoretical predictions. A forthcoming paper (Dominik et al., in preparation) will analyze in detail the case of DM Tau, where the o-H2D+ line at 372 GHz has been detected, applying the model here developed to a practical case. Likely, with the advent of ALMA, with its great sensitivity and spatial resolution, observations of both the o-H2D+ at 372 GHz and p-HD at 691 GHz will be possible on a routine/systematic base and with spatial resolution. Those observations promise to be very fruitful, and to bring unique information on the physical status of the midplane of the disks surrounding solar type protostars, likely similar to the progenitor of our own Solar System. Besides, observations of p-H2D+ and o-HD by out-of-the-atmosphere instruments will hopefully measure the actual ortho-to-para ratio of these species. Finally, D would be likely the best diagnostics for the gas mass and ionization in low mass disks, but the only possibility to observe it is by absorption at 5 m (Ramanlal & Tennyson 2004; Flower et al. 2004). This requires observations towards disks almost edge-on, but not completely, for the absorption is against the inner dust continuum, which must therefore be detectable. Such disks are hard to find, but new observations by, for example, SPITZER may well discover such sources, and these absorption observations may be possible in the future.
Acknowledgements.
It is a pleasure to thank Paola Caselli, Charlotte Vastel and Malcolm Walmsley for comments on the manuscript, and Kees Dullemond for his collaboration on constructing the disk model. We also wish to thank an anonymous referee for careful reading the manuscript. We acknowledge Travel support through the Dutch/French van Gogh program, project VGP 78-387.References
- (1) Bacmann A., Lefloch B., Ceccarelli C. et al. 2002, A&A 389, L6
- Balbus & Hawley (1998) Balbus, S. A. & Hawley, J. F. 1998, Reviews of Modern Physics, 70, 1
- (3) Bergin E.A., Langer W.D., Goldsmith P.F., 1995 ApJ 441, 222
- (4) Bergin E.A. & Langer W.D., 1997 ApJ 486, 316
- (5) Bergin E.A., Kaufman M.J., Melnick G.J., Snell R.L., Howe J.E. 2002, ApJ 582, 830
- (6) Bergin E.A., Alves J., Huard T., Lada C.J. 2002, ApJL 570, L101
- (7) Burke J.R. & Hollenbach D.J. 1983, ApJ 265, 223
- (8) Caselli P., Walmsley M., Tafall M. et al. 1999, ApJL 523, L165
- Caselli et al. (2003) Caselli, P., van der Tak, F. F. S., Ceccarelli, C., & Bacmann, A. 2003, A&A, 403, L37
- (10) Ceccarelli C. 2004, in “The Dense Interstellar Medium in Galaxies”, Ed. Pfalzner, S.; Kramer, C.; Straubmeier, C.; Heithausen, A., Springer Proceedings in Physics,
- (11) Ceccarelli C., Dominik C., Lefloch B., Caselli P., Caux E. 2004, ApJ L 607, 651
- (12) Ceccarelli C., Maret S., Tielens X., Castets A., Caux E. 2003, A&A 410, 587
- (13) Collings M.P, Dever J.W., Fraser H.J., McCoustra M.R.S., Williams D.A.ApJ 583, 1058
- (14) Crapsi A., Caselli P., Walmsley et al. 2005, ApJ 619, 379
- (15) Draine B.T. & Sutin B. 1987, ApJ 320, 803
- (16) Dominik C., Dullemond C.P., Waters L.B.F.M., Walch S. 2003, A&A 398, 607
- (17) Dullemond C.P.,. Dominik C. & Natta A. 2001, ApJ 560, 957
- (18) Dullemond C.P. & Dominik C. 2004, A&A 417, 159
- (19) Dullemond C.P. & Dominik C. 2005, A&A 434, 971
- (20) Flower D., Pineau des Forets G.,Walmsley M. 2004, A&A 427, 887
- (21) Fraser H.J.; Collings M.P., Dever J.W., McCoustra M.R.S. 2004, MNRAS 353, 59
- Frerking et al. (1982) Frerking, M. A., Langer, W. D., & Wilson, R. W. 1982, ApJ, 262, 590
- Gammie (1996) Gammie, C. F. 1996, ApJ, 457, 355
- (24) Hasegawa T.I. & Herbst E. 1993, MNRAS 263, 589
- McCall et al. (2003) McCall, B. J., Huneycutt, A. J., Saykally, R. J., et al. 2003, Nature, 422, 500
- (26) Oberg K.I., van Broekhuizen F., Fraser,H.J. et al. 2005, ApJL 621, 330
- (27) Pagani L., Pardo J-R., Apponi A.J., Bacmann A., Cabrit S. 2004, A&A 249, 181
- (28) Qi C., Kessler J.E., Koerner D.W., Sargent A.I., Blake G.A. 2003, ApJ 597, 986
- (29) Ramanlal J. & Tennyson J. 2004, MNRAS 354, 161
- Roberts et al. (2003) Roberts, H., Herbst, E., & Millar, T. J. 2003, ApJ, 591, L41
- Roberts et al. (2004) Roberts, H., Herbst, E., & Millar, T. J. 2004, A&A 424, 905
- (32) Semenov D., Wiebe D., Henning Th. 2004, A&A 417, 93
- (33) Tafalla M., Meyers P., Caselli P., Walmsley M., Comito C. 2002, ApJ 569, 815
- (34) Tafalla M., Meyers P., Caselli P., Walmsley M. 2004, A&A 416, 191
- (35) Walmsley M., Flower D., Pineau des Forets G. 2004, A&A 418, 1035