Near infrared and the inner regions of protoplanetary disks
Abstract
We examine the “puffed-up inner disk” model (Dullemond, Dominik & Natta 2001), proposed for explaining the near-IR excess radiation from Herbig Ae/Be stars. Detailed model computations show that the observed near-IR excess requires more hot dust than is contained in the puffed-up disk rim. The rim can produce the observed near-IR excess only if its dust has perfectly gray opacity, but such dust is in conflict with the observed 10m spectral feature. We find that a compact ( 10 AU) tenuous () dusty halo around the disk inner regions contains enough dust to readily explain the observations. Furthermore, this model also resolves the puzzling relationship noted by Monnier and Millan-Gabet (2002) between luminosity and the interferometric inner radii of disks.
Subject headings:
accretion, accretion disks — circumstellar matter — dust, extinction — stars: pre-main-sequence1. Introduction
Processes in the immediate vicinity of young pre-main-sequence stars influence the initial stellar evolution and the formation of terrestrial planets. Since small scales of several AU around a star are difficult to resolve, we still lack a clear understanding of processes such as disk accretion, launching of bipolar jets and winds, and dynamics and reprocessing of dust in the inner hot disk regions. The dust geometry is one of the basic ingredients needed for constraining theoretical models of these processes. Traditionally, this geometry has been deduced from the spectral energy distribution (SED), which is dominated at infrared wavelengths by dust emission.
A widely popular geometrical description is the two-layered flared disk model developed by Chiang & Goldreich (1997) (CG hereafter). The model gives a simple method for estimating the flux from the optically-thin surface layer of an optically-thick disk directly exposed to the stellar radiation, and from the colder disk interior heated by the warmer surface. The simplicity of the method, together with evidence for the existence of disks based on radio imaging, made this model a dominant description of T Tau and Herbig Ae/Be stars (intermediate-mass, 1.510, counterparts of T Tau; Haebes hereafter).
Although the CG model successfully explains the observed SEDs, advances in imaging techniques revealed shortcomings of this model. Analyzing images at scattering and dust emission wavelengths, Miroshnichenko et al. (1999) concluded that disks alone cannot explain the imaging observations, at least not for some Haebes. Instead they modeled the SED with an optically thin halo surrounding an optically thick disk, and emphasized that only multi-wavelength imaging can distinguish between this and the CG model. Subsequent detailed modeling of imaging data in numerous systems revealed the existence of dusty halos around the putative flared disks (Gómez & D’Alessio, 2000; Schneider et al., 2003; Stapelfeldt et al., 2003). The inadequacy of the SED as the sole analysis tool in determining the geometry was further demonstrated by Vinković et al (2003) (V03 hereafter). They showed that the mathematical expression for the SED calculation in the CG model can be transformed into that for the halo-embedded-disk and vice versa. This has far reaching consequences for all studies based solely on SEDs. If not supported by imaging at various wavelengths, SED models can lead to erroneous conclusions about the spatial distribution of dust.
The disk inner region in Haebes (within 10 AU from the star) proved to be more complicated than the original CG model. Thermal dust emission from this region peaks at short wavelengths, creating a near IR bump () in the SED of many Haebes (Hillenbrand et al., 1992). Chiang et al. (2001) noticed that the CG model did not produce enough near IR flux to explain the bump. This implies that the disk flaring, which increases the emitting volume of the optically thin disk surface, is too small at the inner radii. Since the disk geometry is constrained by vertical hydrostatic equilibrium, an additional hot dust component is required for explaining the near IR bump. To solve this problem, Dullemond, Dominik, & Natta (2001) (DDN hereafter) proposed to modify the CG geometry without introducing an additional component. They noted that the disk vertical height is increased (puffed up) at its inner rim because there the disk interior is directly exposed to the stellar radiation and hotter than in the CG model at the same radius. The rim is the hottest region of the disk and with its increased size it is possible to boost the near IR flux. This puffing of the rim is equivalent to the disk extra flaring that was identified by Chiang et al. (2001) as missing in the CG model.
Evidence in support of the DDN model was garnered from SED modeling of a large sample of Haebes (Dominik et al., 2003), and recently also of T Tau stars (Muzerolle et al., 2003). Still, the inner disk geometry remains controversial. Recent advances in near IR interferometry provide imaging data of this region, and the first results from a large sample of Haebes show that many of these objects appear close to circular symmetry (Millan-Gabet, Schloerb, & Traub, 2001; Eisner et al., 2004). This is an unusual result if disk inclinations are random. It also creates a new set of problems when interpreted as almost face-on disks because that often conflicts with outer disk inclinations derived from other imaging observations (HST, radio). This is difficult to accommodate in disk-only models, but is easily explained by halo-embedded disks (V03).
In this paper we reexamine the DDN model and the theoretical approach behind it, and identify some unresolved issues in its description of the rim emission. We employ exact radiative transfer calculations of the rim’s brightness and show that the concept of puffed up rim requires some fine tuning of the model parameters in order to produce enough flux to explain the observations (e.g. the dust must be perfectly gray).
Various independent observations indicate the existence of compact halos (10 AU) around the disk inner regions (see V03 and references within), and we find that such halos readily explain also the observed near-IR excess. Furthermore, the halos also resolve the puzzling relationship noted by Monnier & Millan-Gabet (2002) between luminosity and the interferometric inner radii of disks.
2. Emission from the inner wall
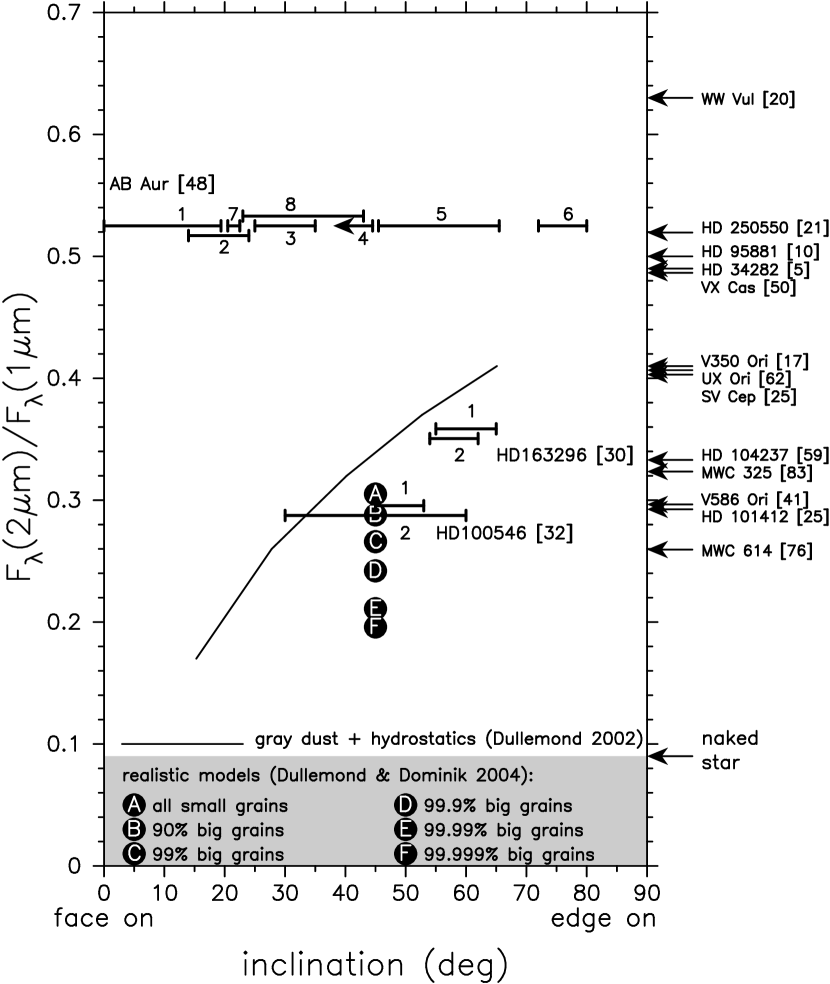
A distinct feature of the near IR bump is its anomalously high flux as compared with the stellar emission. To quantify this effect we introduce the flux ratio as a measure of the strength of the near IR bump; this ratio increases when the prominence of the bump becomes larger. These wavelengths are chosen because the 2m flux is dominated by the dust, while the 1m flux is dominated by the star.
Figure 1 summarizes the observed values of the flux ratio for a sample of well-observed stars, with data compiled from the following references: Low (1970); Gillett & Stein (1971); Strom et al. (1972); Allen (1973); Cohen (1973a, b, c); Glass & Penston (1974); Cohen (1975); Cohen & Schwartz (1976); Kolotilov et al. (1977); Cohen (1980); Bouchet & Swings (1982); Lorenzetti et al. (1983); Tjin A Djie et al. (1984); Kilkenny et al. (1985); The et al. (1985); Olnon et al. (1986); Berrilli et al. (1987); Strom et al. (1989); Hu et al. (1989); Lawrence et al. (1990); Fouque et al. (1992); Berrilli et al. (1992); Hutchinson et al. (1994); Li et al. (1994); Prusti et al. (1994); Sylvester et al. (1996); Garcia-Lario et al. (1997); Malfait et al. (1998); Herbst & Shevchenko (1999); van den Ancker et al. (2000); de Winter et al. (2001) and A. S. Miroshnichenko (2005, private communication).
Dust extinction at 1m is larger than at 2m and could enhance the observed strength of the near IR bump by 20% for , therefore only objects with were considered. Since the reddening correction is negligible, the uncorrected data displayed in the figure represent the true range of near IR bump strength in Herbig Ae stars. The underlying stars of all objects have temperatures of about 10,000 K, which gives = 0.09. Yet in all objects this ratio exceeds 0.25, reflecting a large NIR excess from hot dust emission (Hillenbrand et al. 1992). The luminosity of each object is displayed together with its name in figure 1 and it ranges from 5 to 80. Luminosity does not show any correlation with the near IR bump strength, reaffirming our conclusion that these data can be used as a general description of the near IR bump strength in Herbig Ae stars.
2.1. General Description of the Rim Emission
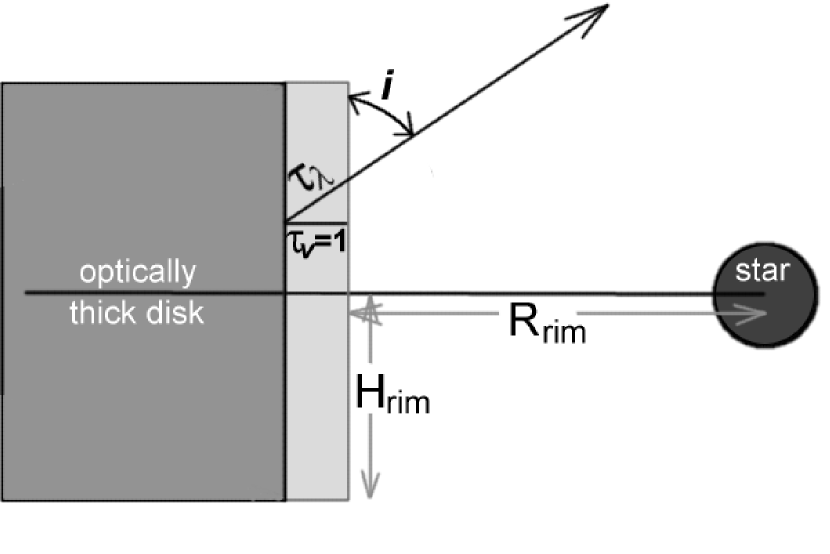
At the inner rim, gas that is typically part of the disk cold interior becomes directly exposed to the stellar radiation and expands to higher scale heights. According to DDN, emission from such a puffed-up rim can explain the near IR bump in the spectrum of Herbig Ae/Be stars. The rim geometry is sketched in figure 2. The rim is modeled as a cylinder of radius and height 2 centered on the star. The basic assumption of this model is that the rim is optically thick in the near IR and shorter wavelengths. This maximizes the rim energy output.
The original DDN model (Dullemond, Dominik, & Natta, 2001) successfully explained the data, but it was based on an approximate treatment of the rim height and emission. More realistic models were calculated by the authors of the DDN model in their subsequent work. Dullemond (2002) used a 2D radiative transfer model for gray dust combined with the hydrostatic equilibrium. The obtained near IR bump strength is shown in figure 1 (solid line). The maximum strength is still too low to explain all the data, but it can accommodate the majority of observed near IR bump strengths.
A dramatic reduction of the DDN model efficacy happens when a mixture of small and big grains is introduced. Dullemond & Dominik (2004)(DD04 hereafter) combined 2mm (big, gray grains) and 0.1m (small) grains in various ratios and performed 2D radiative transfer calculations coupled to the equation of vertical hydrostatics and dust settling. The model fails to explain the data even when 99.999% of the dust mass is in big grains (see figure 1). The behavior of this result is unexpected; decrease in the small grain population leaves more gray dust grains in the mix, which should move the whole solution closer to the gray dust result of Dullemond (2002).
A closer inspection of obtained results shows that the temperature of big grains in such a multi-grain mixture is lower than in the pure gray model. In a mixture, both small and big grains absorb a fraction of the local energy density and participate in providing the local diffuse heating. But, as shown in the next section (see also equation A8 in the appendix), small grains are a very inefficient source of local diffuse heating, resulting in less efficient heating of the big grains then in the pure gray model. With such a temperature decrease, the vertical hydrostatic equilibrium cannot produce disk puffing comparable to the gray model. While in the gray model the puffed-up disk rim height is close to , multi-grain models have only . Since the observed rim emission scales with rim height, this is the major reason behind the failure of the multi-grain models to explain the data. The presented model with the lowest fraction of small grains yields the largest discrepancy because it suffers the largest reduction in the small grain contribution to gas heating and rim puffing while still having enough small grains to suppress heating of the big grains. In quantifying this effect, the mass ratio between big and small grains that DD04 used is not the most illustrative choice. A more appropriate quantity would be the “equivalent” grain size of the grain mixture. In the case of two grain populations with sizes and and fractional number densities and (such that ), the average grain size obeys
| (1) |
The number fractions can be deduced from the reported parameters of the DD04 models: fixed inner and outer disk radius, fixed total disk mass, and total dust mass in big and small grains. The model with 99.999% of the dust mass in big grains has only , and , yielding . This grain size is too small to be considered equivalent to the gray dust model.
It is important to note that this equivalent grain is just an indicator of the overall solution and cannot be used as a general replacement (average or synthetic) grain for the radiative transfer calculation. As already shown by Wolf (2003), the approximation of an averaged single grain as a replacement for a dust mixture breaks down at the surface of a dust cloud (or in this case the rim surface). A more detailed study of multi-grain disk models will be presented in a separate publication, while in the next sections we explore the limits of possible DDN model applicability in the context of single dust grains.
2.2. Approximate Solution for the Rim Emission
Denote by and the stellar radius and temperature, respectively. At distance and direction where the star is free of rim obscuration (see figure 2), the overall observed flux at wavelength is . If is the rim surface brightness in the observer’s direction then
| (2) |
Here the cylindrical visible surface is replaced with a flat rectangle. This approximation maximizes the flux since curvature decreases the projected area of portions of the visible surface, reducing the observed flux. We also assume that the stellar illumination is perpendicular to all portions of the rim. This too maximizes the observed flux.
The observed rim flux in equation 2 is determined by the rim height, surface brightness and radius. Our 2D radiative transfer calculations described in §2.3 confirm that the rim emission is indeed proportional to the rim height, therefore we maximize the rim emission in this study by using , the maximum height allowed before the rim starts to shadow large portions of the disk (DDN). The solution for any other rim height can be derived from our models by a simple scaling of the rim emission.
The surface brightness of a gray dust rim can be approximated with , where is the dust sublimation temperature. The description of a non-gray surface must take into account the spectral variation of optical depth of the emitting optically-thin surface layer. This was done by Chiang & Goldreich (1997). According to their model, the surface layer vertical optical thickness is unity at visual (a characteristic wavelength of the stellar radiation absorption) , therefore at all other wavelengths it is . The rim emits at near IR where (the dust NIR opacity is smaller than at visual), thus the surface layer is optically thin at these wavelengths and its emission is reduced accordingly. Therefore, the rim surface brightness becomes and the observed rim flux is
| (3) |
This result shows that a non-gray rim creates a smaller IR excess than a gray opacity rim. In addition, non-gray opacity removes the angle dependence from the rim emission (we expect this approximation to break down at very small inclination angles where ).
The rim radius is derived from radiative equilibrium, which gives (e.g. Ivezić & Elitzur, 1997)
| (4) |
Here is the Planck average of at temperature , describes the correction for diffuse heating from the rim interior111Note that Ivezić & Elitzur (1997) used and is a correction (described by DDN) for self-irradiation from the other side of the rim. In appendix A we derive an approximate solution which shows that gray dust, with , has and that non-gray dust, with , has . Note that for gray dust this makes equation 4 identical to the original DDN expression (their equation 14). The approximate near-IR bump strength is given in equation A10, yielding
| (5) |
for =10,000 K, =1,500 K and =0.2. Comparison of this result with the data in figure 1 shows that the NIR bump of non-gray dust is too small to explain the observations. Therefore, interpretation of the NIR bump in Herbig Ae stars with inner disk puffing places a strong constraint on dust evolution in this region. The dust must grow to a size greatly exceeding the initial interstellar size distribution, and small grains must be depleted to such a large extent that the inner disk opacity can be considered gray. In the next subsection we employ exact 2D radiative transfer code to obtain accurate values for and place more precise constrains on the DDN model.
2.3. Exact Models for Single-Size Grains
To examine the validity of conclusions based on our approximate solution we performed full 2D radiative transfer calculations for an optically thick torus centered on a 10,000 K star. The torus cross section is sketched in figure 2; it is a square with side-length of , where . This configuration is the same as described by DDN, where the puffed-up disk rim is a cylindrical surface directly exposed to stellar radiation, while the rest of the inner disk is in its shadow. The dust has sublimation temperature 1,500 K and constant density everywhere in the torus, with horizontal and vertical optical depths in visual. Different density structures do not change our results as long as the layer on the illuminated surface is geometrically much smaller than .
Radiative transfer modeling was conducted with our code LELUYA (http://www.leluya.org) that works with axially symmetric dust configurations. It solves the integral equation of the formal solution of radiative transfer including dust scattering, absorption and thermal emission. The solution is based on a long-characteristics approach to the direct method of solving the matrix version of the integral equation (Kurucz, 1969).
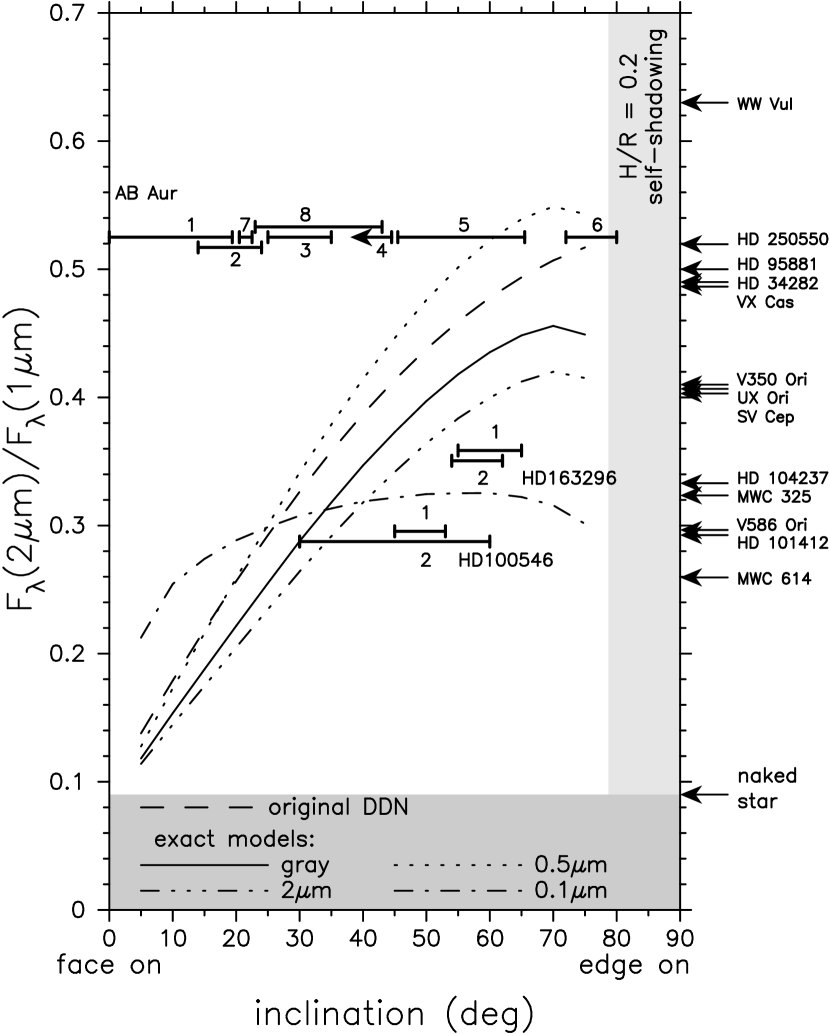
The results are shown in figure 3 together with the original DDN solution (dashed line). Our 2D model results for gray dust without scattering (solid line) are very close to the Dullemond (2002) results, shown in figure 1, which also included vertical hydrostatics equilibrium. This model has 4. Its rim radius (49) and flux are essentially the same as the original DDN model, confirming that a puffed-up rim of gray dust is capable of explaining the near IR bump.
Since realistic dust is not gray at all wavelengths, we calculated models for silicate dust with different grain radii, employing optical constants from Dorschner et al. (1995) ( = 0.4 olivine). Figure 3 shows results for three representative grain radii, with the corresponding rim properties summarized in table 1. Our model results for 0.1m grains are almost identical to the Dullemond (2002) results for purely small grains (see figure 1). As is evident from figure 3, the model can explain the data when the grain radii are 2m and 0.5m, but it starts to fail as a general explanation of the near IR bump when the grain radius drops below m.
A decrease in grain size has two opposing effects on the rim flux. On one hand, the ratio is increasing, leading to a larger rim radius and emitting area and thus enhancing the rim emission. On the other, the rim surface brightness is declining because is decreasing, reducing the rim emission. The net result is that maximum rim emission occurs at grain radius of 0.5m, which, as is evident from figure 4, corresponds to the transition between gray and non-gray opacity in the near IR region. This is predominantly a grain size effect; the dust chemistry introduces only second order corrections.
When the grain radius drops below 0.5m the dust opacity becomes non-gray in the near IR and the puffed-up rim model begins to fail. The flux of the 0.1m grain model, which is almost angle independent as predicted by equation A10, can reproduce only the weakest near-IR bumps. Therefore the DDN model can explain the near IR bump in Herbig Ae stars only when both of the following conditions are met:
1) the rim dust opacity is gray in the near IR (grain radius 0.5m),
and
2) the disk is puffed to a height .
Figure 1 shows that for these conditions to be satisfied, the DDN model requires the complete absence of small grains in the disk inner region. Therefore, for this model to work, the rim dust must undergo substantial growth that also fully depletes the population of small grain. At the same time, this process cannot be so extreme in the rest of the disk because the mid IR spectrum of Herbig Ae stars displays the dust features of small grain emission (van Boekel et al., 2005).

| Grain radius | ||||
|---|---|---|---|---|
| gray | 49 | 1.0 | 4.0 | 1.00 |
| 2m | 52 | 1.3 | 3.6 | 0.99 |
| 0.5m | 68 | 3.6 | 2.3 | 0.45 |
| 0.1m | 150 | 28 | 1.3 | 0.10 |


.
3. The near IR bump and imaging explained with a dusty halo
A dusty halo around the disk inner regions ( 10 AU) has been invoked to explain polarimetric measurements (Yudin, 2000) and correlations between variabilities in the optical and near IR (Eiroa et al., 2002). Such small regions are not yet accessible to direct imaging but have been resolved in near IR interferometry by Millan-Gabet, Schloerb, & Traub (2001) who also favor the halo geometry, although the interpretation of these visibility data is still model-dependent. Direct imaging is currently available only for larger scales, and these observations have revealed larger halos, 100 AU, around some objects (V03). The relation between the inner and outer halos, whether they are simply the inner and outer regions of the same circumstellar component, remains an open question. However, at the phenomenological level this issue is not relevant because the two can be treated as separate circumstellar components if both are optically thin. The inner halo is then radiatively decoupled from the cooler outer halo, simplifying the study of inner halos.
Here we explore the contribution of the inner halo to the near IR emission. The halo precise geometry is not particularly important. It could be elongated, clumpy or inhomogeneous, but as long as it is optically thin it can be approximated with spherical geometry. The reason is that the temperature of optically thin dust is dominated by the stellar heating, resulting in spherically symmetric isotherms and circularly symmetric images at wavelengths where the dust thermal emission dominates over scattering (V03). Optically thin halos are also transparent to the disk emission and we can ignore the disk effect on the halo. The exact image shape ultimately depends on detailed dust density and grain properties, telescope resolution and sensitivity, observational wavelength and the intrinsic ratio between the disk and halo surface brightness. Various observations of R Mon vividly illustrate these effects (see Weigelt et al., 2002).
If the halo optical depth at visual wavelengths is larger than , where is the disk flaring at the halo outer radius, then the halo dominates the SED coming from the dust within radius around the star (see V03 for details). At near IR wavelengths, this condition is satisfied for the halo optical depths of interest here ().

3.1. Theoretical Examples
Our models consist of a star surrounded by a spherical halo with radial density profile . The halo extends from inner radius , set by the dust sublimation temperature , to outer radius .
The dust chemistry is =0.4 olivine from Dorschner et al. (1995), with grain size distribution n() between the minimum grain radius and maximum . We use , m and vary . The radial optical depth of the halo is specified at = 0.55m as . The radiative transfer problem is solved with the code DUSTY (Ivezić, Nenkova, & Elitzur, 1999), which takes advantage of the scaling properties of the radiative transfer problem for dust absorption, emission and scattering (Ivezić & Elitzur, 1997).
Figures 5 and 6 show some SED examples for dusty halos around 10,500K and 5,000K stars, representative of Herbig Ae and T Tauri stars, respectively. The stellar spectrum is taken from Kurucz models. In addition to the strength parameter , the flux ratio can be used to characterize the NIR bump shape. Both the strength and shape parameters are influenced by changes in the dust sublimation temperature, maximum grain size, halo outer radius and optical depth. Comparison of the data with halo model results for the strength and shape parameters is shown in figure 7 for the same objects as in figure 3. Models for and halos around a 10,500K star are dispersed all over the diagram. Arrows show how the model results move in the diagram as the model parameters are varied, indicating that various degeneracies are possible. The observed levels of bump strength and shape are readily reproduced with plausible values of the model parameters.
We briefly summarize the effect of various halo parameters on the strength and shape of the near IR bump.
Optical depth: A larger optical depth results in a stronger near IR bump. This reflects the dependence of flux on the total mass of emitting dust (equations A7 and A12 in V03). The dust sublimation radius is only slightly affected, as expected in the optically thin limit where the diffuse radiation is negligible.
Grain size: Larger grains shift the near IR bump toward longer wavelengths and make it appear more flat. With increased grain size the opacity becomes more similar to gray dust, resulting in a temperature profile since the geometrical dilution of stellar heating is the only cause of temperature variation. Smaller grain sizes create steeper radial temperature profiles. Therefore, for a given density profile smaller grains emit relatively more radiation at shorter wavelengths than larger grains. In practice, grain sizes come in mixtures and sublimate at different radial distances, greatly adding to the complexity of the problem. The SED models are therefore prone to various model degeneracies.
Sublimation temperature: With a higher dust sublimation temperature, the near IR bump shifts to shorter wavelengths, reflecting the shift of the emission peak.
Outer radius: The halo size can affect the near IR bump in two ways. On one hand, reducing the outer radius while keeping the dust distribution fixed reduces also the total optical depth. The near IR bump then starts to decrease when the dust removal reaches the NIR emission regions at radial distance (temperatures 500 K). On the other hand, reducing the outer radius at a fixed halo optical depth is equivalent to redistributing the dust within the halo. The bump then becomes stronger as the outer radius is reduced because more dust is shifted toward smaller radii and higher temperatures.
Stellar temperature: As its temperature decreases, the emission from the star starts to blend with that from the halo, and the near IR bump disappears. Only a careful analysis can then separate the stellar from the diffuse flux in the near IR and reveal the bump. For comparison with T Tau stars, figure 7 shows also 5,000 K models (marked with T). In spite of the large variations in halo parameters, these models display only a limited range of bump strengths and shapes close to the naked star values. This explains why the near IR bump was not originally recognized in T Tau stars while easily detected in Herbig Ae/Be stars.
| Object | T∗ | AV | Tsub | grain radius | carbon | olivine | ||||
|---|---|---|---|---|---|---|---|---|---|---|
| AB Aur | 9750 | 0.35 | 1500 | 0.35 | r-2 | 0.78 | 0.9 | , | 40% | 60% |
| AB Aur | 9750 | 0.35 | 1800 | 0.35 | r-2 | 0.25 | 0.9 | , | 40% | 60% |
| HD 100546 | 10500 | 0.3 | 1500 | 0.35aaHD 100546 is modeled with a flattened halo, which does not contribute to the circumstellar reddening because the dust is out of the line of sight toward the star (see figure 9). | r-1 | 0.45 | 0.8 | , | 10% | 90% |
| HD 163296 | 9500 | 0.3 | 1500 | 0.25 | r-1 | 0.61 | 0.9 | , | 30% | 70% |
Note. — Description of columns: T∗ — stellar temperature in K. Tsub — dust sublimation temperature in K. AV — reddening toward the star by dust other than the inner halo. — visual optical depth of the halo. — radial dust density profile of the halo. — halo inner radius in AU, determined from dust sublimation; the halo outer radius is 10. — total bolometric flux in 10-10W/m2. grain radius — dust size distribution between minimum m and maximum listed in m. Amorphous carbon properties from Hanner (1988), olivine from Dorschner et al. (1995) (with x = 0.4).
3.2. Observational Examples
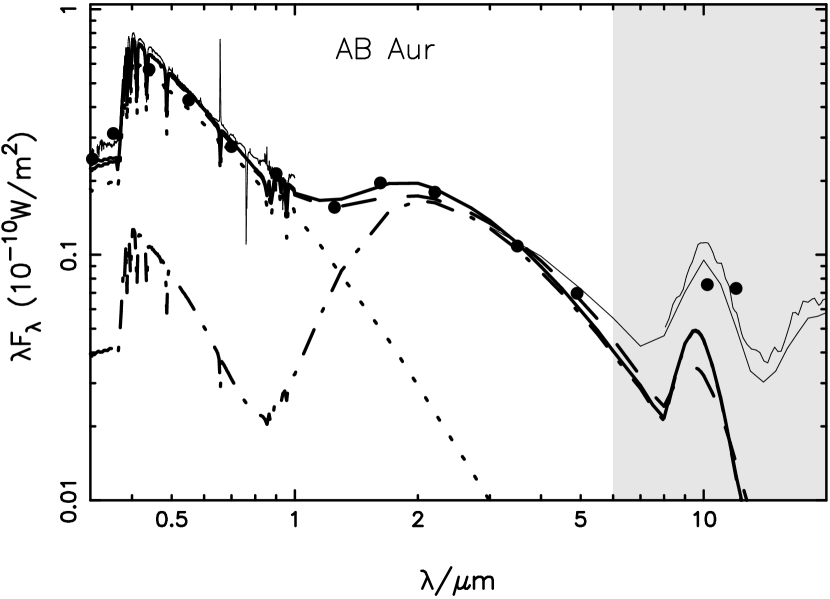
We show three examples which illustrate different circumstellar dust configurations: AB Aur, HD 100546 and HD 163296. HST imaging suggests that AB Aur and HD 100546 have large halos at radii ”, while HD 163296 shows only a disk (Grady et al., 2003). Irrespective of the existence of a large halo, all three objects show a near IR bump, with the strongest bump in AB Aur. Since the focus of this study is the near IR bump, the large scale halos are irrelevant here and we only consider a small halo within 10 AU around the star.
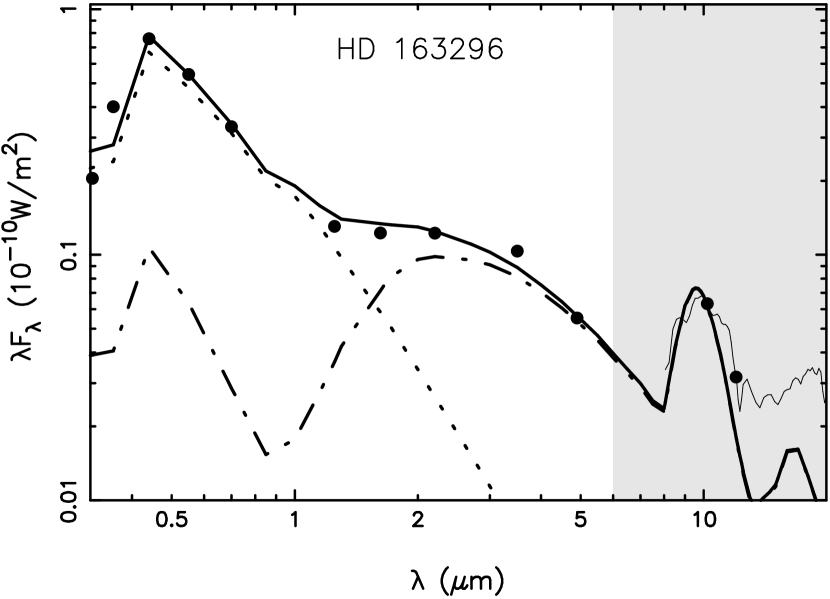
Our fits to the data are shown in figure 8, with the model parameters listed in table 2. The halo outer radius is 10 times the dust sublimation radius in all models. Since our focus is the near IR bump, our model consists only of the star and the inner halo, and only data at wavelengths shorter then 6m were employed in the fitting. The derived model parameters are not unique since various degeneracies exist in model results for the near IR flux (see §3.1). For example, the “hot component” in the Bouwman et al. (2000) models can be interpreted as a small-scale halo with dust properties different from those in our study.
3.2.1 AB Aur
The emission from AB Aur has been resolved at various wavelengths and interpreted as a disk with vastly different estimates for the inclination angle, as follows:
| visual: | Grady et al. (1999) | |
| near IR: | Eisner et al. (2003), (2004) | |
| Fukagawa et al. (2004) | ||
| mid IR: | Liu et al. (2005) | |
| millimeter: | Semenov et al. (2004) | |
| Corder et al. (2005) | ||
| Piétu et al. (2005) | ||
| Mannings & Sargent (1997) |
Such a disparity is expected in halo-embedded disks (see figure 7 in V03) because, as noted by Miroshnichenko et al. (1999), the halo dominates the images at wavelengths extending to 100 µm or so, and the disk emerges only at longer wavelengths. Interpretation of molecular line images, too, must be done carefully to avoid confusion between the halo and disk contributions.
A general conclusion about the AB Aur inner halo is that it must have a radial density profile between and ; this differs from the outer halo, which has a density profile as deduced from the radial brightness profile of the HST image (Grady et al., 1999, see also equation A10 in V03). Conclusions regarding the properties of the dust grains in the inner halo are less firm. Near IR interferometry suggests the presence of dust close to the star, implying large grains that can survive at small distances. An example of a big grains model for AB Aur is shown in figure 8 with thick dashed line (see also table 2). The grain size and chemistry might be subject to radial variations, as is indicated by comparison between the HST (Grady et al., 1999) and Subaru images (Fukagawa et al., 2004), further complicating the modeling.
3.2.2 HD 100546
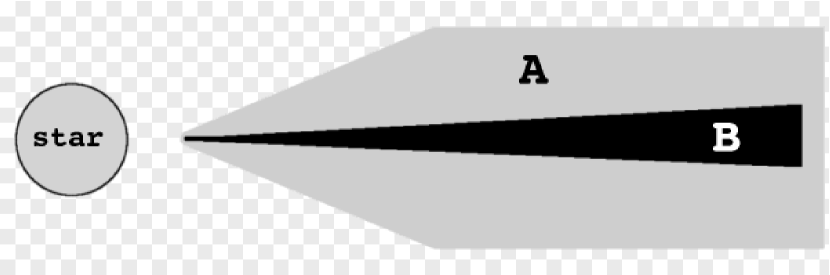
The HST image of this source (Grady et al., 2001) shows a very tenuous large scale nebulosity, whose low surface brightness implies an optical depth of only 0.015. This component of the dust distribution does not contribute significantly to the IR emission and can be ignored in the current analysis. The HST image, which is produced purely by scattered light, reveals also a prominent disk with inclination angle . Near IR (Augereau et al., 2001) and mid IR (Liu et al., 2003) imaging give similar results for the disk even though the latter is produced purely by dust emission and the former contains a mixture of both scattering and emission. The HST brightness contours are symmetric, with the brightness declining as . These are the signatures of scattering from the CG layer of a flat disk (see V03). However, for the CG model to be applicable, every point on the scattering surface, which extends to a distance of 10″ from the star, must have a direct line of sight to the stellar surface. This is impossible in the case of a flat disk, since it would have to maintain a thickness smaller than the stellar radius for hundreds of AU. Therefore, the only self-consistent explanation of the HST imaging is with an optically thin halo whose dimensions are unrelated to the stellar size. The HST image implies that the halo has a flattened geometrical shape, and its brightness profile implies that it has a radial density profile (V03). This flattened halo is outlined as region A in figure 9. Since the halo dominates the imaging, the geometry of the optically thick disk structure, outlined as region B in the figure, remains unknown.
The HST imaging does not constrain the inner-halo geometry at radii 10 AU. The surface density must be reduced in that region because the near IR bump in HD 100546 is significantly smaller then in AB Aur even though otherwise the two stars are rather similar. Indeed, the fit to the near IR bump yields a radial density profile (figure 8 and table 2), shallower than in the region resolved by HST. The fit was further improved by an increased contribution from large grains (m and ) and a reduced fraction of carbon dust in the mix. Observations by Grady et al. (2005) show that a constant density profile, creating brightness profile, might be more appropriate in the region between 20 and 50 AU. We find that a constant density model could also fit the near IR spectrum if the sublimation temperature were increased to 1700 K. All these results point toward large structural differences between the inner and outer regions of HD 100546.
3.2.3 HD 163296
The model properties of the inner halo in this source are very similar to AB Aur, except that a shallower density profile of is preferred (see table 2). A similar general conclusion is that the halo radial density profile is between and , with uncertainties in the dust properties. Significantly, in this source the inner halo also fits the 10m feature all by itself (figure 8). No other optically thin components are required for explaining the mid IR dust features, indeed none are observed. The HST image, which is incapable of resolving the inner halo, shows no evidence of a large scale structure other then the disk, with an inclination of (Grady et al., 2000) in agreement with derived from millimeter observation (Mannings & Sargent, 1997). Another noteworthy feature of the HST image is a bipolar jet. The process responsible for jet formation could perhaps also lift up dust above the disk and create the small scale halo responsible for the near IR bump. Such possible correlation between jets and the near IR bump can be studied further when more high resolution data from a larger sample of objects become available.

3.3. Size-luminosity Correlation
The milli-arcsecond resolution reached in near IR interferometry enables studies of the immediate environment of young stars, down to 0.1 AU (Malbet, 2003). Unfortunately, current visibility data are not yet capable of reproducing the full 2D image of an object, instead requiring a model of the geometry for their analysis. One simple and often used model of the circumstellar geometry is a flat dust ring of uniform surface brightness. This ad hoc model did not arise from some specific radiative transfer modeling but rather chosen as a simple approach to the visibility fitting procedure.
Fitting the visibility data of a number of objects with this ring model, Monnier & Millan-Gabet (2002) discovered that the size of the ring inner radius increased with the stellar luminosity . This is the expected result when dust sublimation controls the size of the dust-free region around the star. Since radiative transfer is scale invariant (Ivezić & Elitzur, 1997), inner radii of rings would be expected to scale as if their dust properties were the same. However, Monnier & Millan-Gabet (2002) do not find such a trend. Instead, at a fixed luminosity the derived radii vary by almost a factor of ten, which they refer to as scatter in the size-luminosity diagram. This scatter indicates either that the disk inner regions have vastly different properties, with the sublimation temperature varying from 1000 K to 2000 K, or that the ring model is not a proper description of the actual dust distribution. Monnier & Millan-Gabet (2002) also noted that some highly luminous objects () had smaller than expected inner ring radii, thus requiring even higher dust sublimation temperatures. New interferometric data by Monnier et al. (2005) slightly reduce the scatter in the ring-radius–luminosity relation, but the remaining scatter still implies a large range of sublimation temperatures, and very luminous objects still display abnormally small radii.
Instead of the ring model we have analyzed the interferometry results with the inner-halo model, performing simultaneous fits of both the near-IR bump and visibility data. Preliminary results are shown in figure 10. It is highly significant that there are no objects in the forbidden region below the indicated lower limits. The correlation of overall bolometric luminosity with inner radius is much tighter than in the ring model, the small remaining scatter arises from variation in halo optical depth and grain size. In contrast with the ring model, the sublimation temperature rarely differs from 1500K (it is 1800K in a couple of objects). The high luminosity object MWC297 which was especially troubling in the Monnier & Millan-Gabet (2002) analysis is now consistent with 1500K sublimation temperature. It is striking how some of the objects that were highly scattered in the diagram by Monnier & Millan-Gabet (2002) now settle on the same size-luminosity relation (dotted line in figure 10), indicating similarities in the halo properties of all these stars, in turn pointing toward a common physical mechanism of halo formation.
4. Conclusions
An examination of the puffed-up disk rim model (DDN) shows that it has rather limited capabilities in explaining the near IR bump of Herbig Ae/Be stars. The observed level of near IR excess implies a certain emitting volume of optically thin puffed-up disk rim surface for given dust properties. The volume derived from the DDN model falls short of this observational limit, unless the disk is made of perfectly gray dust. The puffed-up rim produces enough near IR flux only when the inner disk consists purely of dust grains larger than 0.5 m and the disk puffing reaches values of . Models by Dullemond & Dominik (2004) show that even traces of small grains inhibit the disk puffing, eliminating the DDN model as a viable explanation of the near IR bump. Since the 10m emission feature indicates the presence of small grains in the circumstellar dust, additional mechanisms must be invoked to remove all small grains from the inner disk and keep the DDN model viable.
From fits to the SED of a number of Haebes, Dominik et al. (2003) conclude that the infrared excess in these stars is produced by disks alone without the need for additional circumstellar components. This conclusion is invalidated by the mathematical proof that a fit to the SED cannot distinguish between the surface of a flared disk and an optically thin halo (V03). Fits to the SED alone are not a conclusive proof of a particular dust geometry.
We find that that the optically thin dusty halos around the disk inner regions whose existence has been inferred in various observations readily explain the strength and shape of the near IR bump. The halo is not limited by the disk properties. Hence, it can extend above the disk surface and accommodate the emitting optically thin dust volume required by the near IR flux observations. The required halo is rather small, less than several AU in size, and its optical depth in visual is less than 0.4. Despite its small optical depth, the halo dominates the near IR spectrum and hides the disk near IR signature. However, detailed properties of the halo, such as its exact shape, grain properties or dust density profile, are not uniquely constrained by the SED since different combinations of the parameters can produce the same flux. These degeneracies can be broken only with imaging capable of resolving the disk inner regions.
Inner halos not only explain the near IR bump but also successfully resolve the puzzle presented by the relations between luminosities and near-IR interferometric sizes (Monnier & Millan-Gabet, 2002). In addition to their near IR emission, the halos contribute also to the mid IR flux. HD 163296 is an extreme example where the halo in itself fully explains the mid IR dust features without the need for additional extended components (figure 8). The absence of such components in the HST image of this source is another success of the inner-halo model. In general, though, the inner halo emission is not expected to dominate the mid IR but still make a significant contribution that must be included in fits to the overall SED for reliable modelling of the rest of the circumstellar material. Recently van Boekel et al. (2003) suggested that differences in the strength and shape of the mid IR silicate feature in Haebes are evidence for dust settling in the disk. However, these differences could instead reflect halo evolution, with the most active stars showing the strongest mid IR signature of the inner disk halo. High resolution imaging is necessary for definite conclusions about evolution either of the dust or the circumstellar disk. Such imaging will soon become available at the VLTI, which offers milli-arcsecond resolution at near IR.
Appendix A Approximate solution for the rim radius
The observed emission from a puffed up inner disk depends on the rim radius, height and surface brightness (see §2.2). Deriving the rim radius requires a proper treatment of the rim temperature structure. As already noted by Dullemond (2002), in gray dust the diffuse radiation creates a temperature inversion — the dust temperature is maximum in the rim interior (that is, at ), not on the rim surface. Here we derive an approximate solution for the dust temperature on the rim surface and the temperature inside the rim at depth from the surface. The solution demonstrates the inversion effect for gray dust and shows that it does not exist in the non-gray case.
A.1. Dust temperature on the rim surface
Consider a dust grain on the rim surface. It is heated by the stellar flux and the diffuse flux coming out from the rim interior. For large optical depths these two fluxes are balanced: . Stellar flux absorbed by the grain is , where is the dust cross section in visual. Absorbed diffuse flux is , where is the cross section in the near IR and the factor 2 accounts for absorption from 2 steradian. The grain emits into 4 steradian, so that the energy balance is
| (A1) |
where is the Stefan-Boltzmann constant. Using we get
| (A2) |
A.2. Dust temperature at from the surface
Now consider a dust grain at distance from the surface into the rim. This grain is heated by the attenuated stellar flux , by the diffuse flux from the surface dust between and , and by the diffuse flux from the rim interior. The absorbed stellar flux is . Diffuse contribution from the surface dust layer is , where is the infrared optical depth of this surface layer. Diffuse heating from the rim interior, described by temperature , is . This is a good approximation for gray dust and an overestimate for non-gray dust, where that temperature decreases rapidly with optical depth. The energy balance is
| (A3) |
Using from equation A2 we get the interior temperature
| (A4) |
Note that the ratio depends only on and is independent of .
A.3. Gray and non-gray regimes
We consider two distinct opacity regimes: gray when and non-gray when . The ratio of the rim surface temperature and the interior temperature in these two regimes is
| (A5) |
| (A6) |
The gray opacity creates a temperature inversion with the temperature in the rim interior higher than on its surface. This inversion does not appear in non-gray dust where the temperature decreases monotonically with distance from the rim surface. If the maximum dust temperature is 1,500K (sublimation temperature) then gray dust has =1,500 K and 1,400 K, while non-gray dust has =1,500 K and 1,400 K.
These approximate expressions are in reasonable agreement with the results of exact 2D radiative transfer calculations (see §2.3), which yield
| =1387 K and =1490 K for gray dust |
| =1500 K and =1236 K for 0.1m grains |
The transition between these two regimes occurs at grain radius 0.5m which yields =1474 K, =1492 K and the maximum temperature of 1,500 K at =0.34.
A.4. Disk rim radius and near-IR bump strength
Since the rim optical depth is large, we can assume that both temperatures and are located at essentially the same distance from the star. If we set to the dust sublimation temperature then based on equation A4 the rim radius is
| (A7) |
where we used (the factor is correction for rim self-irradiation, already introduced by DDN). Comparison with equation 4 for the rim radius gives
| (A8) |
The two extreme opacity regimes yield
| (A9) |
This result can also be derived by setting . Combining this result with equations 3 and 4 and dividing the overall observed flux at 2m by the stellar flux at 1m yields the near-IR bump strength
| (A10) |
where we used the approximation . This solution shows that non-gray dust gives angle-independent bump strength in addition to reducing its magnitude from the gray dust result.
References
- Allen (1973) Allen, D. A. 1973, MNRAS, 161, 145
- Augereau et al. (2001) Augereau, J. C., Lagrange, A. M., Mouillet, D., & Ménard, F. 2001, A&A, 365, 78
- Berrilli et al. (1987) Berrilli, F., Lorenzetti, D., Saraceno, P., & Strafella, F. 1987, MNRAS, 228, 833
- Berrilli et al. (1992) Berrilli, F., Corciulo, G., Ingrosso, G., Lorenzetti, D., Nisini, B., & Strafella, F. 1992, ApJ, 398, 254
- Bouchet & Swings (1982) Bouchet, P., & Swings, J. P. 1982, IAU Symp. 98: Be Stars, 98, 241
- Bouwman et al. (2000) Bouwman, J., de Koter, A., van den Ancker, M. E., & Waters, L. B. F. M. 2000, A&A, 360, 213
- Chiang & Goldreich (1997) Chiang, E. I. & Goldreich, P. 1997, ApJ, 490, 368 (CG)
- Chiang et al. (2001) Chiang, E. I., et al. 2001, ApJ, 547, 1077
- Cohen (1973a) Cohen, M. 1973, MNRAS, 161, 85
- Cohen (1973b) Cohen, M. 1973, MNRAS, 161, 97
- Cohen (1973c) Cohen, M. 1973, MNRAS, 161, 105
- Cohen (1975) Cohen, M. 1975, MNRAS, 173, 279
- Cohen (1980) Cohen, M. 1980, MNRAS, 191, 499
- Cohen & Schwartz (1976) Cohen, M., & Schwartz, R. D. 1976, MNRAS, 174, 137
- Corder et al. (2005) Corder, S., Eisner, J., & Sargent, A. 2005, ApJ, 622, L133
- de Winter et al. (2001) de Winter, D., van den Ancker, M. E., Maira, A., Thé, P. S., Djie, H. R. E. T. A., Redondo, I., Eiroa, C., & Molster, F. J. 2001, A&A, 380, 609
- Dominik et al. (2003) Dominik, C., Dullemond, C. P., Waters, L. B. F. M., & Walch, S. 2003, A&A, 398, 607
- Dullemond (2002) Dullemond, C. P. 2002, A&A, 395, 853
- Dullemond & Dominik (2004) Dullemond, C. P., & Dominik, C. 2004, A&A, 417, 159 (DD04)
- Dullemond, Dominik, & Natta (2001) Dullemond, C. P., Dominik, C., & Natta, A. 2001, ApJ, 560, 957 (DDN)
- Dorschner et al. (1995) Dorschner, J., Begemann, B., Henning, T., Jaeger, C., & Mutschke, H. 1995, A&A, 300, 503
- Eiroa et al. (2002) Eiroa, C., et al. 2002, A&A, 384, 1038
- Eisner et al. (2003) Eisner, J. A., Lane, B. F., Akeson, R. L., Hillenbrand, L. A., & Sargent, A. I. 2003, ApJ, 588, 360
- Eisner et al. (2004) Eisner, J. A., Lane, B. F., Hillenbrand, L. A., Akeson, R. L., & Sargent, A. I. 2004, ApJ, 613, 1049
- Fouque et al. (1992) Fouque, P., Le Bertre, T., Epchtein, N., Guglielmo, F., & Kerschbaum, F. 1992, A&AS, 93, 151
- Fukagawa et al. (2004) Fukagawa, M., et al. 2004, ApJ, 605, L53
- Garcia-Lario et al. (1997) Garcia-Lario, P., Manchado, A., Pych, W., & Pottasch, S. R. 1997, A&AS, 126, 479
- Gillett & Stein (1971) Gillett, F. C., & Stein, W. A. 1971, ApJ, 164, 77
- Glass & Penston (1974) Glass, I. S., & Penston, M. V. 1974, MNRAS, 167, 237
- Gómez & D’Alessio (2000) Gómez, J. F. & D’Alessio, P. 2000, ApJ, 535, 943
- Grady et al. (1999) Grady, C. A., et al. 1999, ApJ, 523, L151
- Grady et al. (2000) Grady, C. A., et al. 2000, ApJ, 544, 895
- Grady et al. (2001) Grady, C. A., et al. 2001, AJ, 122, 3396
- Grady et al. (2003) Grady, C. A., et al. 2003, PASP, 115, 1036
- Grady et al. (2005) Grady, C. A., et al. 2005, ApJ, 620, 470
- Hanner (1988) Hanner, M. 1988, Infrared Observations of Comets Halley and Wilson and Properties of the Grains, 22
- Herbst & Shevchenko (1999) Herbst, W., & Shevchenko, V. S. 1999, AJ, 118, 1043
- Hillenbrand et al. (1992) Hillenbrand, L. A., Strom, S. E., Vrba, F. J., & Keene, J. 1992, ApJ, 397, 613
- Hu et al. (1989) Hu, J. Y., The, P. S., & de Winter, D. 1989, A&A, 208, 213
- Hutchinson et al. (1994) Hutchinson, M. G., et al. 1994, A&A, 285, 883
- Ivezić & Elitzur (1997) Ivezić, Ž. & Elitzur, M. 1997, MNRAS, 287, 799
- Ivezić, Nenkova, & Elitzur (1999) Ivezić, Ž., Nenkova, M. & Elitzur, M. 1999, User Manual for DUSTY, Univ. of Kentucky internal report, accessible at http://www.pa.uky.edu/moshe/dusty
- Kilkenny et al. (1985) Kilkenny, D., Whittet, D. C. B., Davies, J. K., Evans, A., Bode, M. F., Robson, E. I., & Banfield, R. M. 1985, South African Astronomical Observatory Circular, 9, 55
- Kolotilov et al. (1977) Kolotilov, E. A., Zaitseva, G. V., & Shenavrin, V. I. 1977, Astrofizika, 13, 449
- Kurucz (1969) Kurucz, R., 1969, ApJ, 156, 235
- Lawrence et al. (1990) Lawrence, G., Jones, T. J., & Gehrz, R. D. 1990, AJ, 99, 1232
- Li et al. (1994) Li, W., Evans, N. J., Harvey, P. M., & Colome, C. 1994, ApJ, 433, 199
- Liu et al. (2003) Liu, W. M., Hinz, P. M., Meyer, M. R., Mamajek, E. E., Hoffmann, W. F., & Hora, J. L. 2003, ApJ, 598, L111
- Liu et al. (2005) Liu, W. M., Hinz, P. M., Hoffmann, W. F., Brusa, G., Miller, D., & Kenworthy, M. A. 2005, ApJ, 618, L133
- Lorenzetti et al. (1983) Lorenzetti, D., Saraceno, P., & Strafella, F. 1983, ApJ, 264, 554
- Low (1970) Low, F. J. 1970, AFCRL-70-0179
- Malbet (2003) Malbet, F. 2003, Ap&SS, 286, 131
- Malfait et al. (1998) Malfait, K., Bogaert, E., & Waelkens, C. 1998, A&A, 331, 211
- Mannings & Sargent (1997) Mannings, V. & Sargent, A. I. 1997, ApJ, 490, 792
- Millan-Gabet, Schloerb, & Traub (2001) Millan-Gabet, R., Schloerb, F. P., & Traub, W. A. 2001, ApJ, 546, 358
- Miroshnichenko et al. (1999) Miroshnichenko, A., Ivezić , Ž., Vinković , D., & Elitzur, M. 1999, ApJ, 520, L115
- Monnier & Millan-Gabet (2002) Monnier, J. D., & Millan-Gabet, R. 2002, ApJ, 579, 694
- Monnier et al. (2005) Monnier, J. D., et al. 2005, ApJ, 624, 832
- Muzerolle et al. (2003) Muzerolle, J., Calvet, N., Hartmann, L., & D’Alessio, P. 2003, ApJ, 597, L149
- Olnon et al. (1986) Olnon, F. M., et al. 1986, A&AS, 65, 607
- Piétu et al. (2005) Piétu, V., Guilloteau, S., & Dutrey, A. 2005, ArXiv Astrophysics e-prints, A&A, accepted, astro-ph/0504023
- Prusti et al. (1994) Prusti, T., Natta, A., & Palla, F. 1994, A&A, 292, 593
- Schneider et al. (2003) Schneider, G., et al. 2003, AJ, 125, 1467
- Semenov et al. (2004) Semenov, D., Pavlyuchenkov, Y., Schreyer, K., Henning, T., Dullemond, C., & Bacmann, A. 2005, ApJ, 621, 853
- Sylvester et al. (1996) Sylvester, R. J., Skinner, C. J., Barlow, M. J., & Mannings, V. 1996, MNRAS, 279, 915
- Stapelfeldt et al. (2003) Stapelfeldt, K. R., et al. 2003, ApJ, 589, 410
- Strom et al. (1972) Strom, S. E., Strom, K. M., Yost, J., Carrasco, L., & Grasdalen, G. 1972, ApJ, 173, 353
- Strom et al. (1989) Strom, K. M., et al. 1989, ApJS, 71, 183
- The et al. (1985) The, P. S., Cuypers, H., Tjin A Djie, H. R. E., & Felenbok, P. 1985, A&A, 149, 429
- Tjin A Djie et al. (1984) Tjin A Djie, H. R. E., Remijn, L., & The, P. S. 1984, A&A, 134, 273
- van Boekel et al. (2003) van Boekel, R., et al. 2003, A&A, 400, L21
- van Boekel et al. (2005) van Boekel, R., et al. 2005, A&A, 437, 189
- van den Ancker et al. (2000) van den Ancker, et al. 2000, A&A, 357, 325
- Vinković et al (2003) Vinković, D., Ivezić, Ž., Miroshnichenko, A. S., & Elitzur, M. 2003, MNRAS, 346, 1151 (V03)
- Yudin (2000) Yudin, R. V. 2000, A&AS, 144, 285
- Weigelt et al. (2002) Weigelt, G., Balega, Y. Y., Hofmann, K.-H., & Preibisch, T. 2002, A&A, 392, 937
- Wolf (2003) Wolf, S. 2003, ApJ, 582, 859