Bright X-ray flares in Orion young stars from COUP: evidence for star-disk magnetic fields?
Abstract
We have analyzed a number of intense X-ray flares observed in the Chandra Orion Ultradeep Project (COUP), a 13 days observation of the Orion Nebula Cluster (ONC), concentrating on the events with the highest statistics (in terms of photon flux and event duration). Analysis of the flare decay allows to determine the physical parameters of the flaring structure, in particular its size and (using the peak temperature and emission measure of the event) the peak density, pressure and minimum confining magnetic field. A total of 32 events, representing the most powerful % of COUP flares, have sufficient statistics and are sufficiently well resolved to grant a detailed analysis. A broad range of decay times are present in the sample of flares, with (the decay time) ranging from 10 to 400 ks. Peak flare temperatures are often very high, with half of the flares in the sample showing temperatures in excess of 100 MK. Significant sustained heating is present in the majority of the flares. The magnetic structures which are found, from the analysis of the flare’s decay, to confine the plasma are in a number of cases very long, with semi-lengths up to cm, implying the presence of magnetic fields of hundreds of G (necessary to confine the hot flaring plasma) extending to comparable distance from the stellar photosphere. These very large sizes for the flaring structures () are not found in more evolved stars, where, almost invariably, the same type of analysis results in structures with . As the majority of young stars in the ONC are surrounded by disks, we speculate that the large magnetic structures which confine the flaring plasma are actually the same type of structures which channel the plasma in the magnetospheric accretion paradigm, connecting the star’s photosphere with the accretion disk.
Subject headings:
stars: activity – stars: magnetic fields – stars: pre-main sequence – open clusters and associations: individual (Orion Nebula Cluster) – X-rays: starsSubject headings:
magnetic fields – open clusters and associations: Individual (Orion) – planetary systems: protoplanetary disks –stars: activity – stars: pre-main sequence – X-rays: stars1. Introduction
Beginning in their protostellar (Class I) phase, young stellar objects (YSOs) have long been known as copious sources of X-ray emission (Feigelson & Montmerle, 1999; Favata & Micela, 2003). The presence of frequent flares, observed both in accreting and non-accreting sources, shows that the emitting plasma is magnetically confined, and in most cases also magnetically heated. In more evolved (Class III, non-accreting) YSOs the X-ray emission mechanism is likely to be very similar to the one operating in similarly active older stars, involving a scaled up version of the solar corona, with the emitting plasma being entirely confined in magnetic loop structures and heated by similar mechanisms as in less active stars (most likely magnetic energy dissipation caused by the shear at the loop’s footpoints, e.g. Peter et al., 2004). In accreting sources (Class I and Class II), on the other hand, recent evidence points to the X-ray emission mechanism being, at least in part, different: statistically, in the ONC (Flaccomio et al., 2003; Preibisch et al., 2005) accreting YSOs are observed to be less X-ray luminous than non-accreting ones, although the actual mechanism causing this difference is not understood. Two accreting YSOs have been observed to date in X-rays at high spectral resolution: TW Hya, (Kastner et al., 2002; Stelzer & Schmitt, 2004), and BP Tau (Schmitt et al., 2005). In both cases the O vii He-like triplet shows very low ratios, which can be caused by very high densities and/or by a very high UV ambient flux. Such low is not observed in any “normal” (ZAMS, MS or more evolved) coronal source. As e.g. discussed by Drake (2005) both effects are most likely associated with the accretion stream (obviously not present in non-accreting stars). While the X-ray emission from TW Hya is very soft ( MK), and thus could be explained as (largely) driven by the accretion shock, both cool and hot plasma (up to 30 MK) is present in BP Tau; the hot plasma cannot originate in the accretion shock (not enough gravitational energy is available), and thus in these cases accretion-driven X-ray emission likely coexists with a more “canonical” corona.
An obvious question to ask, also in the light of the recent results concerning TW Hya and BP Tau, is therefore whether the different types of YSOs have different types of X-ray emitting structures (and thus of confining magnetic fields) in terms of size, location, structuring and density. One of the few diagnostic tools which can provide an insight in this question is the analysis of intense X-ray flares. In this context, a flare is defined as a sudden impulsive rise in the plasma temperature, immediately followed by a rise in the X-ray luminosity of the source (typically by a factor of at least a few times the quiescent luminosity), and later followed by a slower, roughly exponential decay of both the X-ray luminosity and temperature. These types of events are often observed both in the Sun (see e.g. the review by Priest & Forbes, 2002) and in most active stars, and their study has been the subject of a copious literature (see e.g. the relevant chapter reviewing the topic in Favata & Micela, 2003).
The Chandra Orion Ultradeep Project (COUP) is an unique long (13 days span with 9.7 days of effective exposure) X-ray observation of the Orion Nebula Cluster (ONC). The details of the COUP observation are described by Getman et al. (2005). With its long, nearly uninterrupted observation, the COUP sample offers an unique opportunity to study flares in YSOs, and thus to study the type of magnetic structures present in young stars, and in particular in stars which are either actively accreting or which are surrounded by inactive disks. The magnetic field structure in YSOs, is expected to be different from the one in older, isolated stars. Magnetic field lines (and thus possibly magnetic loops) connecting the stellar photosphere and the disk have been postulated in the context of the magnetospheric (Hartmann et al., 1994) model of accretion, in which the accreting plasma originates from the disk and is channeled onto the stellar photosphere by the magnetic field. Magnetically funneled accretion both explains the observed broad optical emission line profiles (Hartmann et al., 1994) and the ejection of high-velocity bipolar outflows (Shu et al., 2000).
However, no direct observational evidence for such extended magnetic structures has been available up to now. Strong magnetic fields have been measured in the photosphere of YSOs using Zeeman splitting, and fields strengths up to 6 kG have been determined (see the review of Johns-Krull & Valenti, 2005; also Johns-Krull et al., 2004). Such measurements cannot however determine the field’s structure, and whether it is dominated by a large-scale, dipole structure, or by higher-order multipoles imposing a smaller scale to the field. In particular, the measurement of photospheric fields does not allow determination of how the field extends into the circumstellar region, and in particular into the disk. Magnetic flux tubes are required by the magnetospheric model of accretion to channel accreting material from the inner edge of the disk to the photosphere. Analysis of the flares’ decay can help to determine if the same flux tubes are also the seat of more energetic processes, i.e. if the plasma is heated to temperatures resulting in X-ray emission and in the attendant flaring activity.
A number of intense X-ray flares on PMS stars have been previously observed and studied. Prior to the XMM-Newton and Chandra observations some 6 flares on PMS stars had been analyzed in detail (see review by Favata & Micela, 2003), although a large number of fainter events (for which therefore physical parameters could not be derived) had also been observed – see e.g. Stelzer et al. (2000) for a survey of flares in the Taurus-Auriga-Perseus complex. Favata et al. (2001) analyzed four of the bright events on YSOs known at the time, finding, in all cases, that the flaring loop structures were of modest size (), similar to what observed in active main sequence and more evolved stars.
A number of flaring events on YSOs have been observed with Chandra and XMM-Newton (see e.g. Imanishi et al., 2003 for a Chandra study of flares in the Oph region), but very few have been analyzed in detail. Grosso et al. (2004) analyzed a flare observed with Chandra on the YSO LkH312 in M78, also finding modest-sized loop structures (–).
Therefore, the analysis of the flares observed up to now on YSOs has resulted in magnetic structures which are in all respects similar to the ones found in older stars, supporting a view in which the coronae of YSOs are similar to the ones of their more evolved counterparts, and supplying no evidence for the long magnetic structures expected to connect the star with its disk. As it will be shown in this paper, the analysis of the large flares occurring in the COUP sample provides a different picture: in addition to flares occurring in star-sized or smaller structures, similar to what found up to now in both PMS and older stars, a number of events are found taking place in very long magnetic structures, with lengths of several stellar radii. As discussed in Sect. 6, loops of this size around fast rotating stars are unlikely to be stable if anchored on the star alone, and therefore such structures are likely to be extending from the star to the disk, providing observational evidence for the type of structures postulated by magnetospheric accretion models.
While COUP is the best sample available to date for the study of the size of coronal structures on YSOs, its limitations should also be stressed. The main one is the relatively limited photon statistics of Chandra observations of YSOs in the ONC: only the most intense and longer lasting flares will have sufficient statistics to allow for the time-resolved spectral analysis needed by the approach used here. Therefore, the physical parameters derived in the present paper are not necessarily representative of the “average” flaring structure in the coronae of YSOs (in the ONC or elsewhere); rather they must be interpreted as the structures associated with the most intense flares present in these coronae. Structures associated with less intense flares (most likely smaller magnetic loops than the ones associated with very intense flares) are certainly present, and given the large large number of shorter and less intense flares visible in the light curve of these stars (which cannot be analyzed in detail due to the low statistics) these are common. Indeed, even in our biased sample a number of compact flaring events is present, and, like what observed in older stars, most likely confined in loops anchored on the stellar photosphere, with no interaction with the disk.
The present paper is structured as follows: the selection of our sample is described in Sect. 2, the analysis procedures adopted in Sect. 3, the results from the analysis are presented in Sect. 4, which includes detailed modeling of a sample flare (on COUP 1343, Sect. 4.1). An example of a complex flaring event (COUP 450, which cannot be analyzed with the method adopted here) is discussed in Sect. 5, and the implications from the present work are discussed in Sect. 6. The conclusions are summarized in Sect. 7, while Appendix Appendix A: Notes on selected individual events discusses in detail a number of notable individual events.
2. Sample selection
We have studied all flares in the COUP sample (described in detail elsewhere, Getman et al., 2005) which have sufficient statistics for the analysis performed here. From a set of simulations we initially determined the minimum number of photons in a spectrum necessary to derive reliable spectral parameters given the typical X-ray spectra of COUP stars. A minimum of 750 photons was found to represent a reasonable compromise between the need for statistics and being able to analyze as large as possible a number of events.
To subdivide the light curve in different interval, a Maximum Likelihood (ML) algorithm was used, the same as also used and discussed by Wolk et al. (2005). Briefly, the rationale behind the ML approach is to recursively subdivide the light curve in a number of segments, with the property that the source’s count rate is compatible with being constant during each segment. The minimum number of photons which are comprised in a given ML block is a configurable parameter. While for many applications allowing blocks with as little as 1 photon is useful (e.g. to allow to track fast variability), for our analysis a minimum of 750 photons per ML blocks has been imposed (to allow for meaningful spectral analysis). In all the following whenever the term “ML block” is used, it implies ML blocks with a minimum of 750 photons each.
The ML block approach identifies (as discussed by Wolk et al., 2005) a ’characteristic’ level, essentially a quiescent level during the observation, as well as blocks which are significantly above this level and during which the X-ray luminosity is constant. Note that our constraint of photons per block results, in a number of cases, in significant “under-binning” of the light curve, i.e. the light curve is clearly variable within a given block. This is for example visible in the case of COUP 649 (see Sect. A.5).
Candidate flares for analysis have been initially hand-selected by inspection of the atlas of light curves produced by the ML blocking for the complete COUP sample, and choosing all sources which had at least three contiguous ML blocks above the characteristic values. These are candidate flaring events with sufficient information to grant a more detailed analysis. For example the light curve of COUP 1343 is plotted in Fig. 1, where (as in all other light curves) the ML blocks at the characteristic level are plotted in light blue and the ML blocks with a higher level are plotted in orange. The latter ML blocks form the candidate flaring events. For COUP 1343, in addition to the flare being analyzed (at the beginning of the observation) there are additional ML blocks above the characteristic level, which have been ignored as they are not part of the main flare. This is also common in a number of other sources.
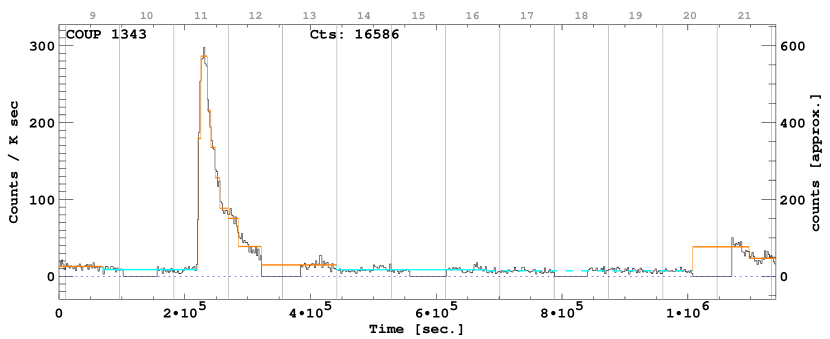

Following the spectral analysis described below, the evolution of each candidate flaring event in the – plane (a proxy for the – plane, as described in Sect. 3) has been examined. Events evolving according to the pattern discussed by Reale et al. (1997) show, after the flare peak, a decay of both the temperature and the emission measure, more or less regular depending on the event characteristics. The event shown in Fig. 1 shows this ’canonical’ behavior: as visible in the the vs. diagram (where the event evolves temporally in the clockwise direction), the temperature peaks while the emission measure is still rising (block 2), and has already started to decay when the emission measure peaks (block 3). Then (blocks 4–9) both the temperature and the emission measure decay regularly. Two smaller flares are also visible in the light curve, one on day 13 and the other on day 21. As not enough statistics is available in each case, they have not been further considered.
We discarded for the purpose of the present analysis all events for which the evolution did not proceed in a sufficiently regular way (e.g. events for which the temperature did not decay). These can either be flares with different underlying mechanisms, which cannot therefore be analyzed within the framework used here (such as e.g. the two-ribbon flares seen in the Sun) or different types of variability (e.g. induced by rotational modulation, or by the emergence of new active regions, etc.). Only events which could be analyzed in an useful way (i.e. producing well constrained physical parameters within the assumed framework) have been retained in the final sample. One example of a particularly complex and intense flare, which cannot be analyzed with the approach used here, is shown and discussed in Sect. 5.
Clearly, as mentioned in Sect. 1, such procedure does not produce an unbiased sample. The most obvious bias is toward events which have sufficient X-ray flux and duration to yield enough time-resolved spectra to allow the analysis. The resulting physical parameters are therefore unlikely to be representative of the ’typical’ flaring structures present in YSOs in the ONC, but will rather represent the more extreme cases (and thus the largest magnetic structures present). Quantifying the biases introduced by our selection procedure is not obvious. An indication can however come from comparison with the study of Wolk et al. (2005), who have performed an analysis of flares in young solar analogs in COUP using an automatic procedure. The young solar analog sample consists of 28 out of 1616 COUP sources. A total of 41 distinct flares were identified on 26 of them, for an average of flares per stars during the COUP observation. If the statistics on solar analogs were valid for the complete COUP sample (an assumption which needs to be verified) this would imply some 2400 flares in the observation. The 32 events analyzed here represent only 1% of the COUP population of flares expected extrapolating the statistics for solar-mass stars. We are therefore studying (by necessity, imposed by photon statistics) the tip of an much larger iceberg.
3. Analysis method
The analysis of the decay of flares is a classic tool to derive the size of the flaring structure, and thus by inference other quantities such as the plasma density and the confining magnetic field (as e.g. discussed for the Sun by Culhane et al., 1970). Stellar flares have been observed since the beginning of stellar X-ray astronomy, and they have been analyzed in a variety of ways, most of which proceeded by analogy to the characteristics of (spatially resolved) solar flares. In the case of the Sun, flares occur in localized regions in the corona, often in single magnetic loop structures, which can remain mostly unchanged during the flare evolution.
While the heating mechanism causing the flare still remains not understood in its details, it is generally assumed to be unlocked by the release of energy stored in the magnetic field. The impulsive energy release generates either a strong thermal front or particle beams, which, channeled by the magnetic field, hit the photosphere and cause plasma evaporation; the plasma fills the coronal loop(s), and produces the observed increase in X-ray luminosity. The decay of the temperature and the X-ray luminosity is caused jointly by the radiative losses and by heat conduction back to the photosphere.
Both cooling mechanisms depend on the geometry of the flaring structure, and thus the decay time scale of flares is related to the size of the coronal structure (or structures). Stellar flares have been used to infer coronal structure sizes since the early stages of coronal X-ray astronomy (e.g. Pallavicini et al., 1990). However, up and until the late ’90s, it was largely assumed that the heating event was impulsive, and concentrated at the beginning of the flare, coincident with the observed impulsive rise in temperature, so that long decay times always led to infer large coronal structures, in the form of very long loops. In the ’90s studies of solar flares showed that the heating mechanisms often extends well into the decay phase, so that sustained heating and thermodynamic cooling processes are competing, in some cases resulting in long decay times also for flares confined in compact structures. Thus, analyses of stellar flares based on the assumption of impulsive heating would likely result in longer coronal structures than actually present on the star (see for a detailed review of past results Favata & Micela, 2003).
Sylwester et al. (1993) showed that, in solar flares, the slope of the flare decay in the temperature-density plane is a sensitive diagnostic of the presence of sustained heating. Reale et al. (1997) later extended the approach showing that the slope of the flare decay in a vs. diagram gives a quantitative measure of the time-scale of sustained heating, which can be used to correct the observed decay time scale and to derive the intrinsic (thermodynamic) decay time, thus allowing us to obtain the actual size of the flaring structure. Reale et al. (1997) developed a methodology for the analysis of stellar flares, based on grids of hydrodynamic models of flaring loops, which was verified on solar flares (for which the size of individual flaring structures can be obtained from imaging observations), and which has been applied to a significant number of stellar events on a variety of stars, including YSOs. In the vast majority of cases, the analysis of stellar events has shown that sustained heating is present, so that flaring structures in stellar coronae are generally smaller than previously thought.
3.1. Uniform cooling loop modeling
The rise time in both solar and stellar flares is almost invariably observed to be significantly shorter than the decay time, and therefore it has been often assumed, in deriving the flare’s physical parameters, that the heating is impulsive, concentrated at the beginning of the event, and that the decay takes place in an “undisturbed” fashion from a loop in near-equilibrium at the flare’s peak, according to the thermodynamic cooling time of the plasma. The two cooling processes which determine the decay time of the flare are thermal conduction downwards to the chromosphere and radiation, each with its characteristic decay time,
| (1) |
where is the plasma density, is the thermal conductivity and is the plasma emissivity per unit emission measure. Both decay times depend on the loop’s length, explicitly through the term, implicitly through the density’s dependence. The effective cooling time of the loop is the combination of the two,
| (2) |
More generally it has been shown by Serio et al. (1991) that the decay time of a flaring loop starting from equilibrium and decaying freely is linearly related to its half length, through
| (3) |
where is in units of cm, in sec and is the peak temperature of the plasma in the flaring loop in units of K. A fast decay thus implies a short loop, while a slow decay implies a long loop. In all the following, unless otherwise specified, the term “length” will be used to indicate the loop’s half length, from one of the footpoints to the loop apex.
In the 80’s and 90’s a number of approaches to the analysis of stellar flare decays have been used (as discussed in detail by Reale, 2002; see also Favata & Micela, 2003 for a review of previous literature). While differing in their details, they were mostly equivalent to the use of Eq. 3 above, and their key assumption was that the flaring loop always decays, after a short heating episode, in an undisturbed fashion.
If heating does not switch off abruptly but rather decays slowly, the plasma is subject to prolonged heating which extends into the decay phase of the flare. As a result, the actual flare decay time determined from the flare’s light curve, , will be longer than the intrinsic decay time , and simple application of Eq. 3 will result in an over-estimate of the size of the flaring loop. If sustained heating is present the observed flare decay time must be “corrected” to obtain a reliable estimate of the flaring region’s size.
In the case of solar flares Sylwester et al. (1993) showed that the slope of the flare decay in a vs. diagram provides a diagnostic of the presence of sustained heating, with a shallower slope (slower temperature decay) indicating an event with strongly sustained heating. This approach was extended to the analysis of stellar flares by Reale et al. (1997), who showed that provides a quantitative diagnostic of the ratio between the intrinsic and observed decay times, i.e.
| (4) |
The approach of Reale et al. (1997) was based on numerical simulations of flaring loops, under the assumption of an exponentially decaying heating function (with a time scale ), and it was validated by comparing its results with the measured size of a number of (spatially resolved) solar flares.
The actual functional form and parameters of depends on the bandpass and spectral response of the instrument used to observe the X-ray emission from the flare, and therefore needs to be separately determined for each instrument. Note that for stellar observations no density determination is normally available; in this case, the quantity is used as a proxy to the density, under the assumption that the geometry of the flaring loop does not vary during the decay.
For ACIS observations the relationship between and the ratio between the observed and intrinsic flare decay time has been calibrated for the present analysis, resulting in
| (5) |
which is valid for . The limits of applicability correspond on one side () to a freely decaying loop, with no heating (), to the other () to a sequence of quasi-static states for the loop (), in which the heating time scale is so long as to mask the loop’s intrinsic decay. Note that while it is not possible to have loops with , flares with are possible if the heating is not simply exponentially decaying but if it increases again after an initial decay.
The temperature in Eq. 3 is the peak temperature in the flaring loop, which will contain plasma with a distribution of temperatures. The relationship between the maximum temperature present in the loop and the temperature determined by performing a simple 1-temperature fit to the integrated X-ray spectrum emitted by the loop has also been calibrated here. In the case of observations performed with ACIS is
| (6) |
where both temperatures are in K.
Putting together the above elements, the length of the flaring structure is therefore given by
| (7) |
Once the length of the flaring loop has been derived, it is possible to infer additional physical parameters of the flaring regions, with some additional assumptions. Given (from the analysis of the peak spectrum) a peak emission measure for the flare, a density can be derived if a volume is available. The above analysis only gives the loop length; if an assumption is made about the ratio between the loop’s radius and its length () one can derive a volume,
| (8) |
and the resulting plasma density at flare peak
| (9) |
The minimum magnetic field necessary to confine the flaring plasma can be simply estimated as
| (10) |
where is the plasma pressure derived from the density and the temperature.
For the solar corona (the only one accessible to imaging observations) typically , and this value has been used in most previous analyses of stellar flares. We have also assumed, in all of our estimates, , unless otherwise specified. The consequences of differences in , depending on the loops characteristics, are discussed in Sects. 3.2 and 4.
3.2. Uncertainties and error analysis
Both statistical and systematic uncertainties are of course present in the length estimate for the flaring loop obtained through Eq. 7. The main statistical uncertainty comes from the uncertainty in the determination of and therefore of . Uncertainties in the determination of the peak temperature and of the decay time are usually significantly smaller than the uncertainty deriving from the , which, given the hyperbolic form of the function, becomes potentially very significant at the lower end of the range of validity of . In our analysis, the error bar reported for the length estimate is the one obtained by propagation of the statistical errors on , and , and it is dominated by the error on .
One possible additional source of uncertainty would be the lack of accurate knowledge about the star’s gravity. Gravity may in principle bring systematic effects to the diagnostics, because it makes the plasma drain faster during the decay phase, flattening the flare’s decay in the – plane, mimicking the presence of sustained heating (Reale & Micela, 1998). In a number of cases, no estimates of either the radius or the mass of the parent star are known, so that no determination of the surface gravity is possible. However, given the low values of surface gravity in YSOs (with their large radii, typically ), the reduction of the gravity at distances comparable to the stellar radius from the surface, and the very high temperatures observed at flare peaks, the pressure scale height of the flaring plasma is likely to be always larger than the length of the flaring structures, so that gravity is unlikely to be an additional source of uncertainty.
More subtle is the issue of systematics, i.e. of uncertainties deriving from assumptions in the models which are not reflected by reality. The modeling of the flaring plasma structure is based on relatively simple physics, robust in its assumptions. The modeling is simplified by the one-dimensional nature of the problem, with the magnetic field confining the plasma except along the field lines, so that the precise shape of the flaring structure is not important. Another assumption is that the sustained heating is an exponentially decaying function; of course this is a simple parameterization which has no underlying physical reasoning behind it. However, as long as the temperature indeed decreases, and the slope in the – plane is steeper than the one of the quasi-static sequence locus () the heating must be a decreasing function of time. Its detailed functional form in this case has a limited impact on the loop length, so that the resulting values are robust against the details of the heating function. Also, as shown by Reale et al. (2002) strong, long-lasting flares must be strongly confined by the magnetic and would decay much faster than observed if the plasma were to break confinement.
The derived parameters (density, magnetic fields) are subject to an additional uncertainty relative to the loop’s aspect ratio . Our simple assumption about clearly cannot hold for a loop with constant cylindrical cross section when this has a length of several stellar radii (as is the case in some of the events analyzed here). In this case the footpoints would cover the whole stars or be larger than it, a clearly unrealistic configuration. Thus, such loops must, at the footpoints, have smaller aspect ratios. At the same time, though, a loop of such length is likely to follow a dipole-like magnetic field configuration at large distances from the star (with the higher-degree multipole terms becoming less important with distance). This implies that it will likely have an expanded cross-section at the apex (where most of the flaring plasma will be) than at the footpoints. These two effects compensate each other (although to an unknown degree), and we have thus decided to still maintain in the analysis, keeping in mind that for the longer loops the “effective ” may be somewhat smaller.
3.3. Application of the analysis to the COUP data
To determine the evolution of COUP flares in the vs. diagram, the temperatures and emission measure of the flaring component have been separately determined for each ML block. All spectral fits were performed within the XSPEC package, using the mekal spectral emissivity model for coronal equilibrium plasma, for consistency with the rest of the COUP analysis as described in Getman et al. (2005). An example of the analysis is shown in Fig. 1: the top panel shows the raw ACIS light curve (at a resolution of 2 ks), with superimposed the light curve rebinned in ML blocks. The segments in light blue are the ones representative of the “characteristic” level for the source’s emission, while the ones in orange are the ones significantly above the characteristic level, and which form the basis for the flare analysis. The count rate for the light curve is given in cts/ks on the left vertical axis, and in (approximate) counts per 2 ks bin on the right vertical axis. The time scale is given in ks from the observation start on the bottom axis and in calendar days (January 2003) in the top axis. Also indicated are the radius and mass of the star (if known, in solar units) and the total number of photons in the light curve.
In a number of cases the flaring source showed significant pile-up in the ACIS detector during the flare. In this case the pile-up free light-curve was examined (obtained by extracting the photons from a ring around the peak of the PSF, as described in Sect. 6 of Getman et al., 2005). However, in most cases the statistics of the pile-up free light curve are so much lower that insufficient photons were left for a detailed analysis of the flare. Only in the case of COUP 891 (Fig. 13) could the flare be analyzed, in spite of the presence of pile-up. The flares in COUP 107, 245,290, 394, 430 and 881, which would have had sufficient statistics and sampling, were lost from our sample because of pile-up.
The source’s “characteristic spectrum” has been determined by performing an absorbed multi-temperature fit to the integrated spectrum of all ML blocks compatible with the characteristic level of the source. The purpose of this fit was only to provide a noise-free, phenomenological description of the source’s characteristic emission, which is effectively a form of background to be subtracted from the flaring emission. Our fit provides a model of the background to be subtracted, which is more robust and less sensitive to statistical fluctuations than the subtraction of the characteristics spectrum itself, which in a number of cases has rather low statistics. Therefore enough temperature components have been included until the fit has yielded a satisfactory , and individual metal abundances have been left free to vary, independent of whether their best-fit value was physically meaningful or not.
For each ML block with emission above the characteristic level, a spectral fit to the emission in excess of the characteristic level has been performed. In addition to the characteristic component model with frozen fit parameters, we include a single additional absorbed thermal component, with global metal abundance set to , thus determining the emission measure and temperature of the flaring component. The absorbing column density was left free to vary. Previous works on CCD resolution X-ray spectroscopy of very active stars, including PMS stars, shows that they typically have low coronal abundance, around , which we have therefore chosen here. While coronal abundance variations have been observed during intense stellar flares, at the temperatures of interest here the plasma is fully dominated by continuum emission, and therefore the exact value of the metallicity – which often cannot be well constrained – has little influence on the best-fit temperature and emission measures. In all cases this simple one-temperature fit resulted in a satisfactory description of the spectrum, although a number of events have spectral peculiarities (regarding variations of abundance and absorbing column density) which will be discussed in detail in a future paper. These do not affect any of our conclusions.
The bottom four-quadrant panel in Fig. 1 shows the results of our analysis in the case of COUP 1343. The bottom right quadrant shows the ML blocked light curve with the time axis expanded for clarity (only the flaring event is shown, and none of the characteristic level blocks), while the upper right and lower left quadrants show, respectively, the time evolution of the emission measure and of the temperature of the flaring component, as determined from the analysis of each of the ML flaring blocks, in a semi-log scale. The best fit exponential to the decay is also plotted for both quantities as a continuous line. The top left quadrant shows the evolution of the flare in the the – plane, with the points connected by a dashed line to allow to follow the event’s evolution. Points are numbered accordingly to the sequential number of the ML block. The blocks which have been used to determine the flare’s evolution are marked by a dot, and the best-fitting decay is plotted as continuous line. Its slope is the one used in Eq. 5. For all such plots we have chosen to adopt the same scale in both axes, to allow an immediate comparison of different events.
In Fig. 2 we plot four representative ACIS spectra for COUP 1343, illustrating the type and quality of the spectra used in the present paper. The top left panel of Fig. 2 shows the characteristic spectrum of COUP 1343, with the 3-temperature fit used to describe it. This spectrum has been integrated for ks, and has 3821 source file counts. The other panels show (clockwise) the spectrum at the beginning of the flare’s rise (block 2, when the plasma is hottest), at the beginning of the flare’s decay (block 4) and at the end of the decay (block 9, when the plasma has already cooled to a temperature very similar to the quiescent value). The flare spectra contain 738 photons over 4.7 ks, 1058 photons over 5.6 ks and 1214 photons over 36 ks, respectively.


For a large number of sources (14 out of 32), the peak temperature derived by the above procedure converges to a value higher than 10 keV, although invariably with large error bars. Detailed analysis of the fits shows that the fit procedure cannot determine with good accuracy the temperature of thermal components hotter than MK on ACIS spectra; when hotter plasma is present, statistically equivalent fits can be obtained by arbitrarily fixing the temperature for this hot component to any value between 100 and 600 MK. We have thus decided to adopt a conservative approach, and for all cases for which the maximum best-fit temperature MK the value 100 MK has been used in Eq. 6 (yielding MK). This will result in smaller loop sizes derived from Eq. 7 than it would be the case if the actual maximum peak temperature were used. However the dependence of on is relatively weak (going as ); thus, even if the peak temperature were to be underestimated, in a few cases perhaps by up to a factor of two, this would result in an additional uncertainty in the size of the flaring loop of .
4. Results
The physical parameters derived for each flare are listed in Table 1. For each source we report the maximum observed temperature , the peak X-ray luminosity , the peak temperature at the loop apex determined from Eq. 6, the slope of the flare decay in the vs. diagram, the ratio of the observed to the intrinsic decay times (determined from Eq. 5), the observed decay time scale (in ks) determined by fitting the flare decay binned in ML blocks. The length of the flaring loop (from Eq. 7) is given in units of cm, as well as, for stars which have a radius estimate published, in units of the stellar radius. The density computed from the peak emission measure and from the volume of the flaring loop (Eq. 9) is given in units of cm-3, and the minimum magnetic field necessary to confine the flaring plasma at the loop apex (Eq. 10) is given in Gauss. Also given (when known) are the equivalent width of the Ca ii IR triplet, a diagnostic of active accretion processes, and whether the source has and excesses. Note that the peak X-ray luminosity is computed after subtraction of the characteristic emission from the flaring one.
| Src. | Ca ii | ||||||||||||
|---|---|---|---|---|---|---|---|---|---|---|---|---|---|
| MK | MK | ks | cm | G | Å | mag | mag | ||||||
| 7 | 100 | 41 | 270 | aa was derived from only two points in the flare decay and therefore no uncertainty range is given. | 9.5 | 9.5 | 4.5 (–) | 0.1 | 110 | 1030 | |||
| 28 | 80 | 100 | 208 | 5.7 | 81.1 | 55 (17–93) | 1.9 | 4.7 | 180 | 1.6 | 0.30 | ||
| 43 | 58 | 13 | 142 | 1.8 | 61.8 | 112 (75–134) | 5.5 | 0.5 | 51 | 1.4 | 0.50 | ||
| 90 | 100 | 240 | 270 | 20.2 | 33.0 | 7.2 (0–41) | 0.4 | 146 | 1170 | 1.6 | 0.08 | ||
| 141 | 70 | 19 | 177 | aa was derived from only two points in the flare decay and therefore no uncertainty range is given. | 5.9 | 22.6 | 13.7 | 0.6 | 16 | 310 | 0.43 | ||
| 223 | 68 | 58 | 170 | aa was derived from only two points in the flare decay and therefore no uncertainty range is given. | 2.1 | 28.3 | 48.3 | 2.5 | 4.0 | 154 | 1.7 | 0.48 | |
| 262 | 100 | 41 | 270 | 2.8 | 122.3 | 198 (43–315) | 18.0 | 0.4 | 62 | 2.3 | n | 0.48 | |
| 332 | 48 | 19 | 113 | aa was derived from only two points in the flare decay and therefore no uncertainty range is given. | 1.6 | 397.0 | 733 | 0.04 | 12 | y | |||
| 342 | 100 | 44 | 270 | 1.7 | 52.9 | 141 (0–290) | 0.7 | 80 | n | ||||
| 454 | 84 | 26 | 219 | 1.6 | 127.4 | 323 (259–426) | 10.1 | 0.14 | 32 | 2.1 | y | 0.20 | |
| 597 | 39 | 7 | 87 | 9.8 | 85.7 | 22 (0–75) | 1.6 | 5.4 | 128 | 4.5 | y | ||
| 649 | 80 | 22 | 206 | aa was derived from only two points in the flare decay and therefore no uncertainty range is given. | 3.7 | 60.7 | 64 (–) | 4.2 | 1.8 | 113 | 0.0 | n | 0.43 |
| 669 | 79 | 34 | 203 | 1.9 | 45.6 | 92 (69–111) | 5.1 | 1.1 | 88 | n | 0.36 | ||
| 720 | 77 | 22 | 197 | 3.2 | 110.9 | 132 (0–614) | 0.6 | 62 | |||||
| 752 | 120 | 190 | 339 | 6.0 | 78.7 | 65 (0–74) | 5.6 | 5.4 | 250 | 1.1 | 0.62 | ||
| 848 | 100 | 40 | 270 | 1.5 | 55.2 | 162 (139–190) | 11.8 | 0.5 | 70 | 0.0 | y | 0.50 | |
| 891 | 100 | 110 | 270 | 1.7 | 73.1 | 173 (150–200) | 5.1 | 1.6 | 120 | 1.8 | 1.10 | ||
| 915 | 100 | 300 | 270 | 2.4 | 41.5 | 78 (60–105) | 2.4 | 223 | |||||
| 960 | 49 | 98 | 115 | 15.6 | 19.8 | 3.7 (0–14) | 0.3 | 260 | 1020 | 0.0 | |||
| 971 | 86 | 97 | 226 | 2.0 | 17.3 | 35 (32–40) | 1.6 | 7.9 | 250 | 1.8 | |||
| 976 | 100 | 32 | 270 | aa was derived from only two points in the flare decay and therefore no uncertainty range is given. | 1.7 | 28.2 | 76 (–) | 12.0 | 1.5 | 120 | 0.0 | y | |
| 997 | 74 | 28 | 190 | 3.5 | 31.5 | 34 (7–62) | 5.0 | 180 | n | ||||
| 1040 | 75 | 420 | 190 | 8.4 | 19.4 | 8.7 (0–22) | 142 | 970 | |||||
| 1083 | 100 | 14 | 270 | 2.4 | 124.6 | 235 (186–302) | 0.2 | 40 | n | ||||
| 1114 | 100 | 95 | 270 | 2.8 | 43.6 | 68 (0–84) | 2.8 | 160 | |||||
| 1246 | 100 | 72 | 270 | 2.5 | 22.5 | 40 (32–47) | 3.8 | 5.6 | 240 | 0.0 | 0.75 | ||
| 1343 | 100 | 164 | 270 | 1.8 | 38.9 | 96 (79–113) | 2.3 | 150 | y | ||||
| 1384 | 55 | 23 | 133 | 3.1 | 50.7 | 51 (20–82) | 3.0 | 2.4 | 110 | 1.9 | 0.56 | ||
| 1410 | 100 | 37 | 270 | 6.1 | 152.7 | 110 (0–200) | 55.0 | 1.0 | 95 | 0.0 | 2.30 | ||
| 1443 | 69 | 51 | 174 | 3.5 | 35.4 | 26 (22–55) | 5.8 | 190 | |||||
| 1568 | 100 | 780 | 270 | 15.1 | 12.4 | 3.7 (0–15) | 0.4 | 120 | 3480 | 0.19 | |||
| 1608 | 96 | 16 | 258 | 3.7 | 70.6 | 82 (0–99) | 6.7 | 1.0 | 96 | n | 1.41 |
Note. — See main text (Sect. 4) for a description of individual columns. The value for is given together with the uncertainty range deriving from the fit to the flare decay in the – plane. When is derived from only 2 decay points no uncertainty is given in the Table. In this case no uncertainty range is given for ; this value, as well as the derived values for and , are in this case to be treated with caution.
The derived quantities () are computed assuming . For long loops (of several stellar radii) this assumption may be incorrect, as such large loops would have footpoints covering much of the stellar surface (even though loop expansion may partially offset this, see Sect. 3.2). However, the dependence of and on is moderate, with and . Thus, the values in Table 1 can be easily scaled to any value of .
The flares analyzed here are all X-ray bright, but not exceptionally so, when compared to other intense flares already observed in YSOs. The peak X-ray luminosities reported in Table 1, determined by fitting the spectrum of the peak ML block for the flare, range from erg s-1 up to erg s-1 for the most X-ray bright event. The latter one takes place on COUP 1568 (discussed in detail in Appendix Appendix A: Notes on selected individual events), at one of the most massive stars in our sample. Thanks to the large offset angle, the source does not suffer from pile-up even if the peak ACIS count rate approaches 1 cts/s. While certainly very high, the peak luminosity of erg s-1 is comparable to the values observed in other PMS flares, e.g. the erg s-1 determined at peak in a similar band by Tsuboi et al. (1998) for the flare observed with the ASCA satellite on the weak line T Tau V773 Tau.
More remarkable are the high temperatures present in COUP flares. Up to recently, flaring events with temperatures reaching up to 100 MK where considered exceptional. In the COUP sample, on the other hand, very high temperatures are common. While the ACIS spectral response does not allow to properly constrain temperatures in excess of 100 MK, the best fit values for the hottest ML block in the flare exceed 100 MK in about half of the events studied here. The fact that the temperature decay shows a clear regular pattern even when the best-fit values are above 100 MK (as for example is the case for COUP 1568), gives confidence in the fact that the peak observed temperatures are, in a number of cases, very high, hundreds of MK, even though their values cannot be accurately determined using ACIS spectra (see Sect. 3.3).
For the ONC YSO sources studied here, the nominal sizes of the flaring structures vary from a fraction of the stellar radius (e.g. COUP 7, 90, 141), with absolute sizes of order cm, to very large structures, up to a few times cm, i.e., 10–20 stellar radii. As discussed below, the largest events with a reliable size estimate (with small uncertainties) typically have .
A number of intense flares on active coronal sources have been analyzed to date with the approach used here. These include a number of YSOs, both accreting and non-accreting (YLW 15, HD 283572, LkH,92, V773 Tau, Favata et al., 2001), the nearby ZAMS star AB Dor (Maggio et al., 2000), a number of dMe flare stars (Favata et al., 2000b; Favata et al., 2000a, Reale et al., 2004), and a number of active binary systems as well as Algol (Favata & Schmitt, 1999). In all cases, without exception, the size of the flaring structure derived from the analysis is at most comparable to the stellar radius, and in most cases it’s smaller. On the other hand the present analysis of intense flares on YSOs in the ONC results, in a number of cases, in very large loop sizes, extending to several stellar radii, showing them to be events of a different nature from the flares analyzed to date.
The strongest evidence for large loop sizes in the COUP sample comes from well resolved long-lasting events with little sustained heating. In these cases, one is largely observing the undisturbed thermodynamic decay of the flaring structure, which, as discussed in Sect. 3, is directly related to the size of the flaring structure. One such example is COUP 1343, for which our analysis gives , and , resulting in a loop size of cm. The presence of a small amount of residual heating is derived from the tail of the light curve, which decays more slowly, and indeed the detailed simulation of Sect. 4.1 shows that for the first 50 or so ks the decay of both the emission measure and the temperature is well reproduced by a freely decaying loop of cm. In fact, if we were to relax our conservative assumption on the peak temperature of the loop (with the best-fit temperature clipped to 100 MK) and use the nominal best-fit temperature, the resulting loop size would be even larger.
Other similar cases of well determined flaring structure sizes include COUP 669, 891, 971 and 1246. In all these cases , with a well constrained value of , leading to a reliable determination of from Eq. 7. Both COUP 971 and 1246 have cm, while COUP 669 and 1343 have cm. With cm, COUP 891 is the largest of the well constrained loop structures. In all these cases, the uncertainties for resulting from the uncertainty in the determination of are of order 20–30%. Apart from COUP 971 (which, at , is likely to be a large “normal” coronal flare, with both loop footpoints anchored on the stellar photosphere), the well determined loops have –, which, as discussed in Sect. 6, is the typical corotation radius for a low-mass YSO (also likely to be the disk truncation radius), supporting the hypothesis that these loops may indeed be structures linking the star and the accretion disk.
For the large events with a well constrained loop size, the peak densities are all in the range – cm-3, and the equipartition magnetic fields (determined from Eq. 10, at the top of the loop) range from 40 to 250 G. In the assumption of a simple dipole geometry (very likely to dominate at large distance from the stellar surface) the photospheric field would be
| (11) |
Assuming an average equipartition field of 100 G and a typical loop length of , the corresponding field strength at the stellar surface would therefore be of order 6 kG, at the top of the range of the field strengths determined in YSOs by Zeeman splitting (Johns-Krull & Valenti, 2005).
In a few flares of Table 1, we obtain (e.g. COUP 332, 454, 848, 976), outside the range of validity of Eq. 5. Probably, in these events the analyzed part of the decay is too short to cover a significant part of the decay path, and the slope is not yet well defined. Cases which result in long flaring structures in the presence of strong sustained heating are to be regarded with caution, as the strong heating dominates the decay, hiding the intrinsic decay of the cooling plasma and potentially introducing a larger uncertainty in the results. Also, the hyperbolic form of Eq. 5 will tend to include lengths much smaller than the ’nominal’ results of Eq. 7 within the final error bar for . One such example is COUP 1410, for which and . While the nominal loop length is cm, the uncertainty range resulting from the uncertainty in is – cm, with a factor of ten error bar at the lower end.
A number of individual flaring events of particular interest are discussed in detail in Appendix Appendix A: Notes on selected individual events, where the individual light curves and the time evolution of the spectral parameters are also shown.
4.1. Detailed simulation of the flare on COUP 1343
Although the method used here has been widely applied in the literature, and its reliability tested for example in the case of the eclipsed flare observed by SAX on Algol (Schmitt & Favata, 1999; Favata & Schmitt, 1999), as discussed in the above Section no previous analysis based on this approach has resulted in such large loop sizes (of order AU). It is thus legitimate to ask: 1) whether such gigantic loops can be still described with standard loop models, closed magnetic structures where plasma is confined and moves and transports energy along the magnetic field, and 2) whether the diagnostics we are using (in particular the slope in the – plane) are still valid. To check on the applicability of the method to such extreme regimes, and to validate its use on the present sample, we have modeled one of the well-resolved large flares from the COUP sample in detail. We have used a time-dependent hydrodynamic model of plasma confined inside a coronal loop, as already done for other more regular stellar flares (Reale et al., 1988; Reale et al., 2004).
We have chosen to model the large event on COUP 1343, in which the peak count rate is approximately larger than the characteristic rate and which appears, from the analysis performed using the approach described in Sect. 3.3, to have evidence for little sustained heating. The event lasts some 130 ks, and both the rise phase and most of the decay are not interrupted by gaps in the observations. Additionally, the decay in the – plane is well defined. The event and its analysis with the analysis method used here (as described in Sect. 3.3) is shown in Fig. 1.
To model the event on COUP 1343 in detail, we have assumed the plasma to be confined in a loop with constant cross-section and half-length cm, symmetric around the loop apex. The flare simulation is triggered by injecting a heating pulse in the loop which is initially at a temperature of MK (which is the dominant temperature in the characteristic spectrum as well as the temperature observed at the end of flare decay). We have chosen to deposit two heat pulses with a Gaussian spatial distribution of intensity 10 erg cm-3 s-1 and width cm (1/100 of the loop half-length) at a distance of cm from the footpoints, i.e. very close to the footpoints themselves (Reale et al., 2004). After 20 ks the heat pulses are switched off completely, with no residual heating in the decay, as indicated by the density-temperature diagnostics for this specific flare. We have computed the evolution of the loop plasma by solving the time-dependent hydrodynamic equations of mass, momentum and energy conservation for a compressible plasma confined in the loop (Peres et al., 1982; Betta et al., 1997), including the relevant physical effects such as the plasma thermal conduction and radiative losses (computed assuming solar metal abundances – at these high temperatures however the line losses are a minor contributor, so that the results are robust against differences in the plasma metal abundance). The gravity component along the loop is computed assuming a radius and a surface gravity , typical of low-mass pre-main sequence objects. The results of the simulations are shown in Fig. 3, together with the observational results for COUP 1343.

The computed evolution of the flare’s parameters largely resembles the evolution computed for other stellar flares (e.g. Reale et al., 2004), although on larger scales. The heat pulses make the loop plasma heat rapidly ( hour) to temperatures above 200 MK and the initially denser chromospheric plasma near the loop’s footpoints expands dynamically upwards at speeds above 2000 km/s, to reach the loop apex on similar timescales (also about 1 hour). After this first impulsive phase, the temperature does not change much and the evaporation continues substantially but less dynamically. After the end of the heat pulse, the plasma begins to cool while still filling the loop. The density begins to decrease only two hours later.
From the density and temperature distribution of the plasma along the model loop, we can synthesize the expected plasma X-ray spectrum filtered through the ACIS spectral response, and the relative spectral parameters as they would be determined through a spectral fit to the ACIS data. We have computed the emission in the coronal part of the loop, i.e. above the loop transition region, assuming a hydrogen column density cm-2 (i.e. the value obtained from the fit to the source’s characteristic level spectrum). The dashed line in Fig. 3 (top left panel) shows the ACIS light curve resulting from the simulation, integrated above 1 keV, assuming a loop cross-section radius of cm, i.e. . The smaller than customary ( being assumed elsewhere) is necessary to provide a good fit to the flare’s decay; the small also results in footpoints still small relative to the photosphere. The spectra obtained from the loop modeling have been fit with 1- model spectra, and the resulting evolution of the emission measure and of the temperature, as well as the – diagram are also shown in the figure. A visual comparison of the model results with the actual light curve and with the evolution of the measured spectral parameters indicates that the loop simulation results are in good qualitative agreement with the data and that, therefore, the data are compatible with the flare occurring in a single giant flaring structure. The modeling could be further improved by changing some of the simulation’s parameters; for example the light curve’s agreement for ks could be improved by including a low residual heating active during the late decay (as done e.g. by Reale et al., 2004 in their simulation of a large flare on Proxima Cen). However, such changes would not alter the large-scale features of the flaring loop, in particular its large size, and thus for the purpose of the present work they are not necessary.
One additional diagnostic provided by detailed simulations such as the one discussed here is the rise time of the event. This is not available with the more general analysis employed for the complete sample of flares discussed in the present paper, which only uses the decay phase. In the case of COUP 1343 the rise phase is very steep, with a very peaked light curve. Not all impulsive heating functions will produce such steep rise; we find that to produce the steep rise it is necessary to have strongly localized heating deposited very close to the loop footpoints. More diffuse heating, or heating localized near the loop apex would produce a smoother light curve.
5. Complex flaring events
While the present paper deals with all the flaring events in the COUP sample which can be modeled within the framework described by Reale et al. (1997), a number of events are present in the sample which do not show such regular behavior, and which cannot therefore be analyzed with the same approach. Perhaps the most dramatic one is the flare on COUP 450, which, coincidentally, was also observed at mm wavelengths. COUP 450 is associated with a well known radio source (GMR-A, Garay et al., 1987) and is identified with star HC 573 from Hillenbrand & Carpenter (2000).
The X-ray event has been briefly reported by Getman et al. (2003), and the COUP light curve for the event is shown in Fig. 4. As discussed in detail by Bower et al. (2003), the source also flared in the mm regime, although the mm flare started significantly later (about two days after the start of the X-ray flare). The mm flare lasted some 20 days, with erratic variability continuing for tens of days thereafter. The COUP observation only covers the first day or so of the mm event (which has a much spottier time coverage), and no obvious correlation between the details of the two light curves is present. The counterpart to COUP 450 has been studied by Bower et al. (2003) who (using IR Keck spectroscopy) identify it as a heavily absorbed K5 T Tauri star with average photospheric magnetic fields kG determined from Zeeman-splitted infrared lines.
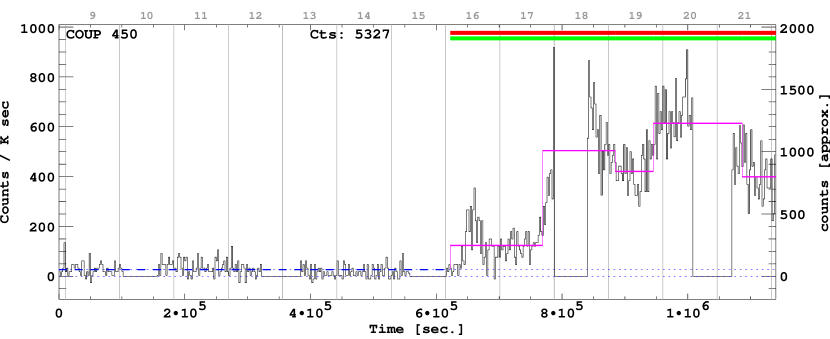

The COUP 450 event is not exceptional either in terms of its peak luminosity (with a rise of in X-ray count rate at peak) or in terms of its duration (other events with durations of a few days are present in COUP). It is however one of the most complex events in terms of its light curve shape, and it lies at the extreme of complex flares, which lack a clear, well defined decay phase. Such events cannot therefore be analyzed with the method used here. In this specific case, the analysis is also hampered by the very strong degree of pile-up present in the Chandra observation, so that while the raw count rate ensures a ’high-resolution’ view of the light curve, most events are lost to pile-up, and the residual pile-up free events suffer from very limited statistics. Nevertheless it is possible to still resolve the light curve in a number of intervals, allowing us to monitor the evolution of the spectral parameters.
The time evolution of the flare can be seen in the bottom panels of Fig. 4. The very significant amount of pile-up in the ACIS observation results in a very small pile-up free count rate. In the light curve shown in the top panel of Fig. 4 the purple line shows the ML blocks of the pile-up free events: although the raw count rate approaches 1 cts/sec, the pile-up free ML blocks have durations of tens of ks, which clearly subsample the event’s evolution. Even so, however, the irregular evolution of the event is readily visible. No regular decay is present; the emission measure does not decrease, and the temperature shows an irregular behavior, with a strong increase in the next to last bin. Whether this is evidence of strong reheating within the same flaring structure or whether this is a separate structure undergoing flaring (perhaps induced by the first event) cannot be inferred from our data, specially because of the coarse time sampling caused by pile-up.
The lack of a regular evolution for this event does not allow us to make (using the approach adopted in the present paper) any inference about the size and characteristics of the flaring region, and thus about the flaring mechanism and the underlying physics. The clear lack of a decay does point in this case to a complex heating function, with a highly time-variable release of energy in the flaring plasma, and – perhaps – to the involvement of different structures in the flaring, rather than to the single, confined plasma structure inferred from the analysis of the simpler events discussed in Sects. 3 and 4.
6. Discussion
In a significant number of cases the size of the flaring structures derived here for intense flares in COUP sources is large (several stellar radii) with absolute sizes up to cm. In a few of them, the evidence for large loop sizes is strong, because we could constrain negligible heating to be present during the decay. Significant heating would have made the diagnosed lengths shorter and at the same time more uncertain. Given the high plasma temperatures at the peak of the flare ( MK) the magnetic field necessary to confine the plasma typically is of a few hundred G. This scenario is very different from the one observed in more evolved stars, ZAMS or MS, in which the same type of analysis of flare decay as performed here has invariably yielded relatively compact magnetic structures , compatible with scaled-up version of the geometry observed on the Sun. Also the limited number of flares previously studied with the same technique on YSOs (Favata et al., 2001) have shown evidence for compact structures. This is not in contradiction with the evidence from the COUP sample, as the YSOs studied by Favata et al. (2001) all are in the nearest SFRs (thus allowing studies of much less intense flares) and were the result of shorter observations (and therefore biased against the long lasting events well represented in COUP).
Such long loops are unlikely to be anchored on the star alone, as the centrifugal force would rip them open and eject the plasma. The corotation radius is defined as the distance at which a test gas particle in keplerian orbit around the central star has the same angular velocity as the star,
| (12) |
The effective gravitational potential (gravity plus centrifugal) takes the form of a vanishing gradient at the corotation radius, which is a saddle point, allowing only for magnetically dominated plasma to be present above and below the equatorial plane. The plasma favors moving inward while inside of the corotation radius, but flowing outward while outside of the corotation radius. Unless the magnetic field is strong enough to provide sufficient tension therefore enforcing corotation, the field itself would easily be opened up by plasma flowing downhill in the effective gravitational potential.
Following Mestel & Spruit (1987) – hereafter MS87 – and assuming the simplest stellar dipole field, a scaled-up version of the Sun for the stellar activity (with the magnetic field strength proportional to the rotational velocity of the star, i.e. the case of MS87, so that ), Table 1 in MS87 gives a list of sizes of the largest closed loops that can possibly exist for a rotating solar-mass star under similar condition. By simply re-scaling with our stellar parameters, for loops of temperatures on the order of 100 MK or higher, the largest equatorial extent for closed magnetic loops (in the notation of MS87, -cusp point, see their Fig. 1), will likely be in the range of 3–4 , for a slow rotator (6–8 days, or – in the notation of MS87, where is the rotation rate of the star), and high plasma temperature ( and , where is the ratio of magnetic to thermal energy in the corona). Similar considerations have recently been applied by Jardine (2004) in the context of ’coronal stripping’ in fast rotating, supersaturated stars.
Our flaring sources have typical rotational periods (when they are known) of a few days, up to a week. For typical CTTSs periods of 6–8 days, the corresponding corotation radius is about to cm, equivalent to , if . Loop structures larger than this would have difficulty anchoring on the star alone without very strong magnetic field tension to counter balance the centrifugal force. What is then the magnetic geometry which can support coherent fields of hundreds of G over cm? In the case of YSOs one obvious possibility is to have magnetic flux tubes connecting the stellar photosphere with the disk, at the co-rotation radius or somewhat outside it. As e.g. discussed by Shu et al. (1997), the twisting of the magnetic field lines induced by the differential (Keplerian) rotation of the inner disk rim and the photosphere will twist the flux tubes, resulting in longer loops and presumably in the stressed field configurations which drive the flaring. A good candidate among COUP flaring sources for star-disk flaring structures is COUP 1083, a moderate mass star with d and with a flare implying , in the presence of moderate sustained heating, with an uncertainty range –. Even assuming a very young YSO, with a large radius ,the loop length is . Given the above consideration on stability of large magnetic loops in rotating stars, it is unlikely that this type of loops can be anchored on the star alone.
Magnetic flux tubes extending from the inner rim of the disk to the stellar photosphere provide a natural location for the intense flares found here on a number of sources. An additional open question is what heating mechanism can heat the plasma in these long loop to such high temperatures. While the general coronal heating mechanism is still not fully established, the most modern magnetohydrodynamic simulations (e.g. Peter et al., 2004 and Schrijver et al., 2004) point to the heating being due to shuffling of the loop’s footpoint, a natural result of convective motions in the photosphere. The photospheric convection is certainly present in accreting YSOs, and shearing of the disk would provide an equivalent, natural source of loop footpoint shuffling on the disk side.
It should be stressed that the COUP flaring sources analyzed in the present paper present a large variety of flaring structures. While the long flaring loops which likely connect the star with the accretion disk are well represented in the sample, so are also the more compact structures which have very similar characteristics with the ones observed on more evolved stars, ZAMS or MS. Thus, it appears from the present analysis that two types of (flaring) coronal structures can coexist on YSOs: one which appears similar to the one present in older, more evolved stars (and thus likely to be a scaled-up version of the solar corona) and one made of very extended magnetic structures, which is instead peculiar to YSOs, being dependent on the presence of disks on which to anchor one footpoint of the very long loops. While unfortunately none of the COUP sources has more than one flare sufficiently bright to be analyzed with the present technique, some sources (notably COUP 597 and COUP 891, both discussed in Appendix Appendix A: Notes on selected individual events) show, in addition to the long events linked with long loops, some short events, too short to be analyzed, but likely originating in compact loops (given the small ), so that it would appear that both types of coronae could exist, at the same time, in a given YSO.
Wolk et al. (2005) have presented an analysis of flare characteristics and frequency in “young suns” in the COUP database. Only two of our objects are in common with the sample of Wolk et al. (2005), namely COUP 223 and 262. While no statistical conclusions can be drawn from only two objects, the flare on COUP 262 results in a long coronal structure (, see discussion in Sect. A.3), showing that these extended magnetic structures were indeed present in the young Sun.
Very recently, Loinard et al. (2005) have obtained evidence for the presence of long magnetic structures, in T Tau S: their radio VLBI observations show that, in addition to a compact source which they identify as the star’s magnetosphere, a fainter streak of radio emission is present, extending to a distance of about from the star, which they state “may result from reconnection flares at the star-disk interface”. The size of the radio structure (, T Tau S having a radius ) is very similar to the loop lengths we have derived here from the analysis of the large X-ray flares, providing independent support for the presence of such long, coherent magnetic structures in YSOs.
6.1. The role of disks and of accretion
To investigate the role of disks in the presence of long magnetic structures one would ideally like to have a clear separation of the sample in stars with disk and stars without. Unfortunately, the available diagnostics do not allow us to do this in an unambiguous way. The most complete investigation on the presence of disks in the ONC is the work of Hillenbrand et al. (1998), who have compared the results of a number of indicators for the presence of disks in the ONC, including IR excesses in a number of color bands and Ca ii emission. Emission in Ca ii should indicate the presence of active accretion, and thus will miss “quiescent” disks. NIR excesses are often used as an indicator of the presence of disks, and Hillenbrand et al. (1998) have quantitatively modeled the expected excesses in a number of bands, using models very similar to the ones of Meyer et al. (1997) and converging on similar conclusions. As discussed in detail in Hillenbrand et al. (1998) the IR excess is expected to be produced by the disk material being heated both by the stellar radiation and by the friction induced by accretion. In practice, its magnitude depends on a number of factors, such as the relative importance of accretion vs. the size of the disk’s inner hole, the relative contrast between the disk emission and the photosphere and the system inclination. Disks with low accretion rate and with a large inner hole, generating only a far-IR excess could be difficult to see in the NIR (see also the discussion in Meyer et al., 1997).
Hillenbrand et al. (1998) conclude that the excess (determined by taking into account the star’s spectral type and thus effective temperature and intrinsic colors and its reddening) is the most effective single indicator of the presence of disks; measurements in in the bands would have be even better but were not available to Hillenbrand et al. (1998) except for few stars. However, while clearly is an effective indicator on a statistical basis, its value for determining whether individual stars have a disk is much less clear. The distributions shown e.g. in Fig. 10 of Hillenbrand et al. (1998) have strong tails to negative values (as far as ) and a significant number of stars with Ca ii emission (thus, accreting systems) do not have excesses. Even more significantly, as discussed in Sect. 7.3 of Hillenbrand et al. (1998), a number of sources with disks visible in the HST images (“proplyds”, from the O’Dell & Wong, 1996 sample) do not have IR excesses, clearly showing that some sources with disks escape detection through IR excesses.
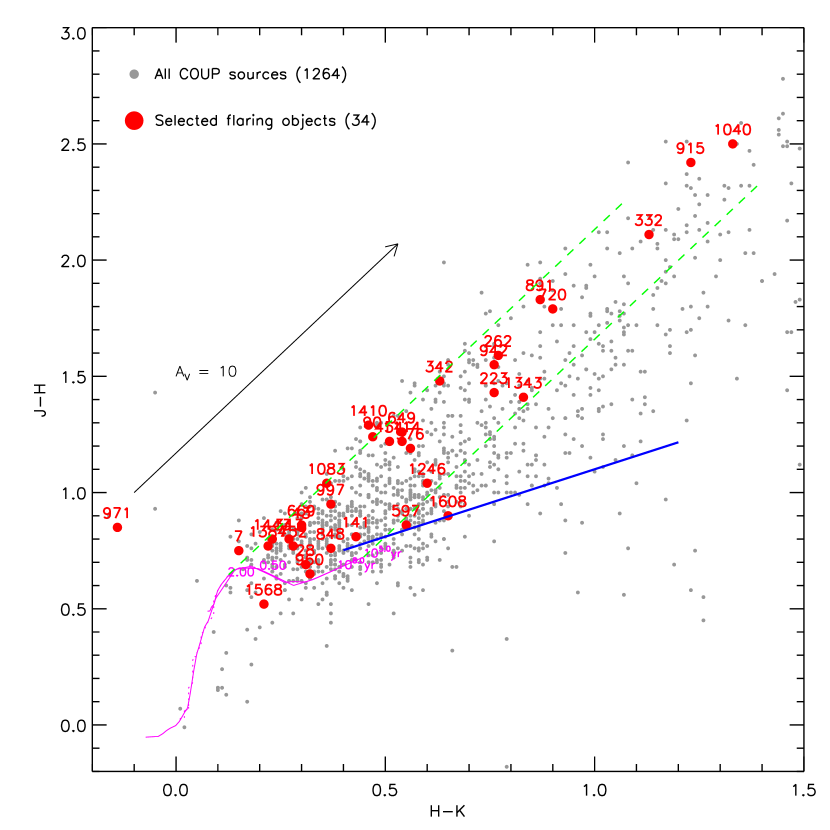
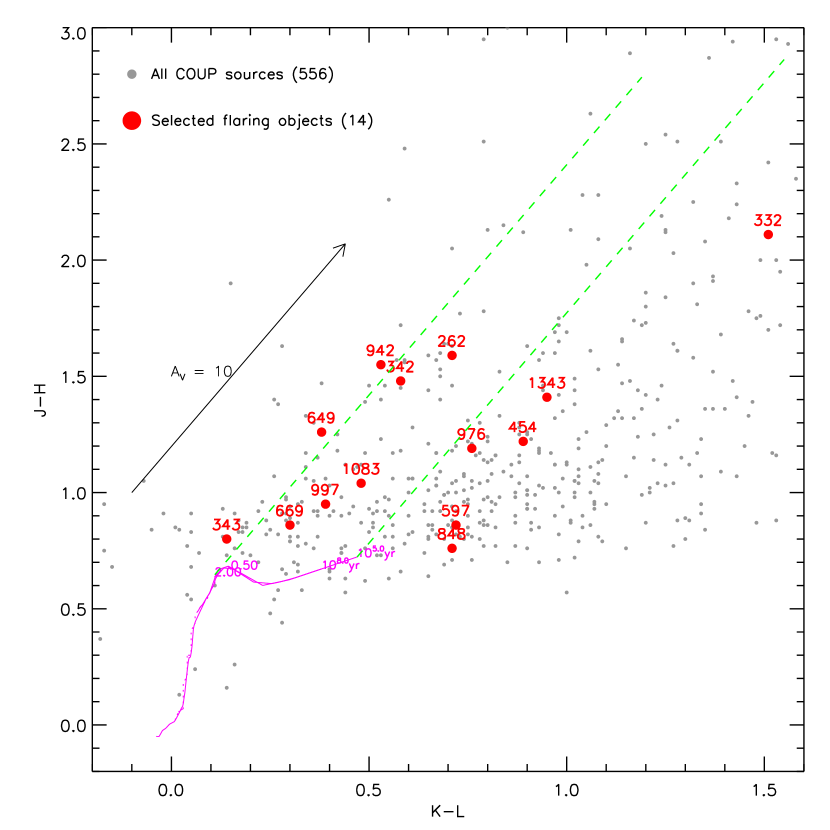
In the present paper, we have tried to analyze whether a relationship exists between the detection of long flaring structures and the presence of disks from the available indicators, bearing however in mind the above caveat. In Table 1 we report, for all the COUP sources analyzed in our sample, the available data from the compilation of Getman et al. (2005) – the original source for most of the IR data is Hillenbrand et al. (1998) – regarding Ca ii emission and excess in colors. We also report whether the sources have an excess in the NIR bands from inspection of Fig. 5, although (quoting Hillenbrand et al., 1998 literally) “calculating disk fractions simply by counting the relative number of stars outside of and inside of reddening vectors in observed color-color diagrams is clearly naive”.
Fig. 5 plots the IR color-color diagrams for all COUP sources for which NIR photometry is available (from Getman et al., 2005), with the subsample studied in the present paper singled out. The slanted blue line in Fig. 5 is the observational mean locus of CTTSs in Taurus derived by Meyer et al. (1997). All sources lying to the right of the reddened photospheric locus in Fig. 5 (bounded by the green dashed lines) have NIR colors compatible (bearing in mind the above caveat) with the presence of disks similar to the ones present in Taurus YSOs. For objects whose NIR colors place them in the reddened photospheric region the situation is however much less clear as they could still have disks, perhaps with low accretion and large interior holes, generating negligible IR excesses. Indeed, as discussed by Meyer et al. (1997) – see their Fig. 5 – the most important parameter driving the NIR excess is the accretion rate, and for a given color excess there is a minimum accretion rate, thus disk heating rate, needed to generate a NIR excess, independent of central hole size and of the disk inclination. Also, large holes () will produce no NIR excess in the bands, with any excess shifted redward of m.
From Fig. 5 it is evident that none of the COUP sources with strong flares has a significant excess (with the exception of COUP 1608 and, marginally, COUP 597), while 6 sources (out of 13 for which photometry is available) show a band excess. Of these 6 (COUPs 332, 454, 597, 848, 976, 1343), 5 have no band excess, while COUP 597 is the only one possibly displaying excesses in both and . In the framework of the Meyer et al. (1997) models, COUP 597 is the only one whose colors would be compatible with the presence of an accreting disk with a moderate-size central hole, while the colors of COUPs 332, 454, 848, 976 and 1343 (with excess but no excess) would be compatible with the presence of a central disk with a larger size central hole (few stellar radii) and low accretion rate. The remaining sources in our flaring sample have no measurable excess in these bands, which would be compatible either with their being diskless sources or their having disks characterized by a very low accretion rate and with large inner holes.
An additional complexity comes from the fact that star-disk magnetic coupling requires a gaseous disk at the corotation radius, while NIR excesses are only sensitive to the dust content of the disk. But, given sufficient heating, the dust might be sublimated relatively near the star leaving behind the needed gas disk without an NIR excess. As discussed by Muzerolle et al. (2003), for sufficiently large accretion rates, the inner rim lies beyond the corotation radius, so that pure gaseous disks must extend inside the dust rim.
The situation is however clearly more complex, as evident from the fact that some sources which fall, in the color-color diagrams of Fig. 5, in the region of normal reddenened photospheres with no disks have significant excesses. Unfortunately the overlap between the two samples is not very large (13 out of 32 sources have colors, 19 out of 32 have determinations, and only 6 have both), but all 6 sources for which both indicators are available have a excess, while 3 of them fall in the region of reddened normal photospheres in Fig. 5. In the whole sample of 1616 COUP sources for which optical data are available, 472 have a determination; of these, 388 have (82%), compatible with an excess due to circumstellar material, while 71 have . In the present sample, for 30 out of 32 sources (94%), a comparable number as the complete sample given the low statistics.
Further evidence that disks may be present also when no excess in NIR colors is observed comes from the COUP data directly. Tsujimoto et al. (2005) have recently searched the COUP databases for sources showing significant Fe 6.4 keV fluorescent emission, of which they found 7 cases. In all cases, fluorescent emission was detected during intense flares, a fact easily explained by the need for a sufficient number of hard ( keV) photons to excite the fluorescence. Two of the Tsujimoto et al. (2005) sources are also in our large flare sample, namely COUP 649 and 1040. The remaining 5 fluorescing sources have too low statistics (either because of the short duration of the flare or because of the low peak count rate) for our analysis. Flares are however not a necessary condition for fluorescent emission, as shown by the detection of 6.4 keV fluorescence in the Oph YSO Elias 29 in quiescence by Favata et al. (2005). At the same time, the large equivalent widths of the 6.4 keV line observed in the COUP sample (as well as in Elias 29) are compatible only (as discussed by Favata et al., 2005 and Tsujimoto et al., 2005) with the fluorescence originating in a centrally illuminated disk observed face on. A disk illuminated from above, or other topologies (such as fluorescence from the photosphere) would result in a much lower equivalent width, likely too low to be detected on COUP sources. Yet most of the Tsujimoto et al. (2005) sources (and in particular COUP 649 and 1040), for which a disk is certainly present, given the observed X-ray fluorescence, show no NIR excess, although some of them (e.g. COUP 649) do show a significant excess in . Again, NIR excesses appear to be, in the ONC, a sufficient condition for a disk to be present, but not a necessary one, with providing a more sensitive indicator.
Given the biases affecting the samples and the problems affecting disk diagnostics, we refrain from formal correlation analysis on e.g. flaring loop size and the presence of disk, limiting the analysis to qualitative considerations. Using as an indicator, the only two sources with in the present sample (which we take to imply that disks are most likely not present) both have flares confined to compact magnetic structures (COUP 7 with and COUP 960 with ), while both compact and large magnetic structures are present in the sources with .
The 6 sources with significant excess comprise flares spanning both large loops and more compact structures (comparable to the stellar size): large structures appear present on COUP 332 (although the determination of loop size suffers from a large uncertainty), COUP 454, with cm, COUP 848, with cm, and COUP 1343, with cm. On the other hand COUP 597 has cm and COUP 976 has cm. Large loops are also present in sources with no excess, such as COUP 669 () and COUP 1083 ( cm), so that no clear correlation appears present between the presence of large loops and excess. With one single exception (COUP 1608) none of the sources in the present sample show significant excesses.
Only one strongly accreting source (COUP 141, with Ca ii equivalent width Å) is present in our sample of large flares; two sources (COUP 1114 and COUP 1608) show very modest emission (and presumably accretion rates), and all other sources show (when available) Ca ii in absorption or filled in and thus little or no ongoing accretion. The statistical significance of this is difficult to assess given the biases of our sample (discussed in Sect. 2), and the fact (Preibisch et al., 2005) that accreting sources in the COUP sample are statistically intrinsically fainter than the non-accreting sample (as well as more absorbed), introducing a small bias against strong flares from accreting sources being present in our sample. Interestingly, COUP 141 is one of the cases of compact loops, with , so that in this case no disk-photosphere magnetic structures need to be postulated, and the flare is likely to be a normal coronal event, similar to the ones observed in more evolved stars. COUP 1114 and COUP 1608 both only result in upper limits to the size of the flaring structure.
In the complete COUP sample, out of 1616 sources for which optical data are available, Ca ii data are available for 537 sources. Of these, 198 have Ca ii in absorption, 189 have Ca ii in emission and 150 have filled lines (equivalent width of the Ca ii lines reported as “0.0” in Getman et al., 2005). Among the sources with Ca ii determination the fraction of sources in emission is then 35%, while in the flaring sample discussed in the present paper only 3 sources out of 20 for which the data are available have Ca ii in emission, i.e. 15%. Given the small numbers, and the biases present in the various samples, it’s difficult to assess the significance of the difference. If the lack of long flaring structures in accreting YSOs is however real, given that long magnetic structures connecting the disk to the star are certainly present, it implies that active accretion inhibits the formation of strong flares in the extended magnetic structures connecting the disk to the star. Long and intense flares (and thus very hot plasma) appear to be present in non-accreting structures connecting the disk to the star.
7. Conclusions
In the complete COUP sample of YSOs in the ONC, 32 flares have sufficient statistics (in terms of flare duration and photon count rate) and regular evolution to grant a detailed analysis of their decay. The type of flare decay analysis employed here allow us to derive the size of the flaring loops in the presence of heating extending into the decay phase, and, under simple assumptions, estimates of the plasma density and confining magnetic field.
The most notable result from our analysis is the strong evidence for very large flaring structures in these stars. The magnetic structures confining the plasma in a number of cases are much larger than the stars themselves. Among the events analyzed, a large fraction have very high peak temperatures ( MK), and some are very long-lasting, with the longest flares extending to up to a week in duration. The peak X-ray luminosity for the most intense flare reaches erg s-1, comparable to other very bright flares observed in YSOs.
Our sample is limited to the brightest 1% of COUP flares, and the results may not be representative of the average magnetic reconnection event in Orion stars. Nevertheless, the present results show that very extended magnetic structures confining hot flaring plasma exist in YSOs. Structures of comparable sizes have never been seen in more evolved stars, and, given the short rotational periods of many of the flaring COUP stars, would not be stable if anchored onto the photosphere with both footpoints. These long magnetic structures are in the present paper interpreted as linking the stellar photosphere with the inner rim of the circumstellar disk.
The available indicators of the presence of disks do not allow for a formal analysis of whether large flaring loops are linked to the presence of disks; in particular stars without NIR excesses are not necessarily diskless, as they may e.g. have disks with little dust. However in a limited number of sources the NIR data clearly point to disks being present, either as excess in color-color diagrams or as strong excesses above the de-reddened photospheric colors (). Both small flaring structures (likely anchored on the photosphere only) and long flaring structures, with sizes which would extend well into the disk (assuming the disk to be truncated at the co-rotation radius) are present in these stars. Both types of structures (loops anchored on the star only and loops connecting the star to the disk) are then perhaps likely to coexist in YSOs with disks.
For the two sources in our sample without any excess, and for the star with a strong Ca ii accretion signature, the flaring structures are relatively compact. This suggests that inner disks are needed for reconnection in star-disk magnetic loops and that heating to X-ray temperatures is inhibited by mass loading associated with YSO accretion. More statistics are clearly needed to corroborate the present conclusions, and hopefully future, already approved long X-ray observations of other star-forming regions will be able to supply the needed additional evidence.
The data presented in the present paper thus constitute the first direct evidence for the presence of very long magnetic structures in YSOs, and, by inference, of magnetic structures linking the stellar photosphere with the circumstellar disk. Such structures are postulated by magnetospheric models of YSO accretion, but had not been directly detected to date.
Appendix A: Notes on selected individual events
The present Appendix presents a detailed discussion (together with the relevant light curves and diagrams from the analysis) for a number of individually selected COUP sources. Its purpose is both to discuss in detail some peculiar or particularly representative event and to show the variety of flare shapes and characteristics present among the ONC YSOs.
A.1. COUP 28
COUP 28 is a , star of spectral type M0, showing a NIR excess () and no evidence for active accretion. Its rotational period is 4.4 d. It displays one of the longest flares (Fig. 6) of the COUP sample, with the total duration of the event extending over more than a week. Unfortunately an observation gap has blocked much of the flare rise, which however appears to be slow and extending over more than one day. The peak seems to be observed, and this allows a reliable analysis of the decay phase. The sources is at a large off-axis angle, so that no pile-up is present even if the flare at peak reaches a high count rate. The flare’s peak count rate is almost the source characteristic level. The peak temperature, at MK, is a moderate one for COUP flaring sources (although it is very high by the standard of flares observed in older stars), and is still well determined on ACIS spectra. The vs. diagram shows, as typical in both solar and stellar flares, the temperature peaking well before the . The excellent stastistics allows us to follow the flare’s evolution in detail, and the temperature decay shows evidence for reheating (in block 9, Fig. 6), as also reflected in the change in slope of the light curve decay, which is not a simple exponential but rather shows evidence for two different time scales. In this case, fitting an average decay to both the light curve and the slope in the vs. diagram still provides a good estimate of the parameters of the flaring region (Reale et al., 2004). At the flare is a relatively compact one among the ones observed in COUP.
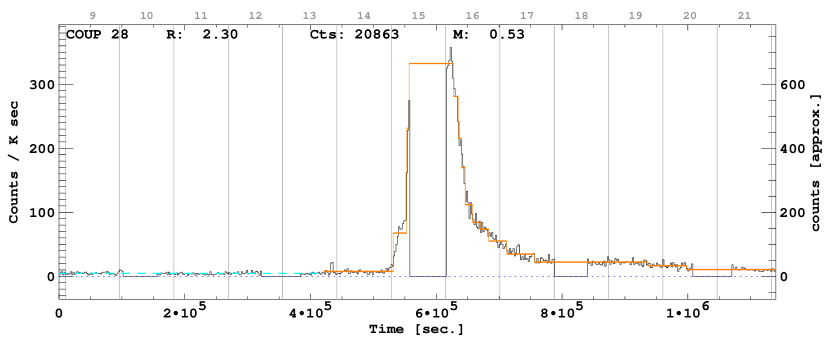

A.2. COUP 43
COUP 43 is a known SB2 binary; the mass and radius computed by Hillenbrand (1997) for the unresolved source are and . Its spectral type is M1, and it shows no evidence of active accretion; an excess () is present. The flare (Fig. 7) is a double event, with the second flare beginning while the first one is still in its decay. The rise phase of the first event is lost in an observation gap, and therefore only the second event, with a duration of about two days, and which shows an impulsive rise, has been analyzed. While the limited statistics only allow us to subdivide the decay in three intervals, the steep implies very limited sustained heating, and thus a long structure () driven by the slow decay ( ks). The two flares are sufficiently well separated, so that the first (incomplete) event does not significantly affect the spectral analysis of the second event. However, the lack of coverage of the latest phases of the decay imply caution in the interpretation of the analysis results, as a flattening of the temperature decay could imply a final shallower and thus a smaller loop size.
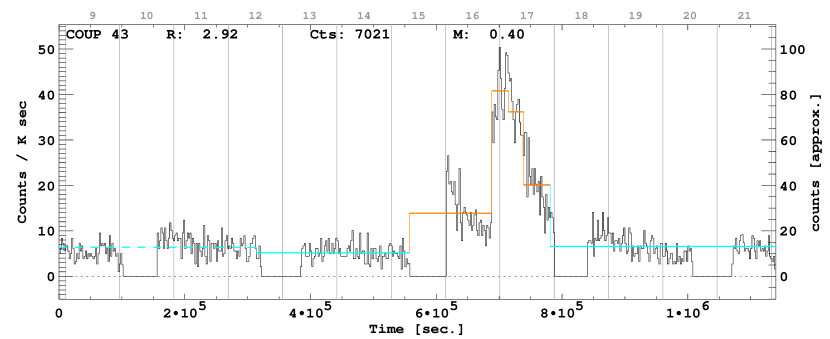

A.3. COUP 262
COUP 262, with and is a “young Sun”, and thus of particular interest for flare studies. In the context of COUP, its flaring activity is also discussed by Wolk et al. (2005). With spectral type K5, it shows no evidence for active accretion and has a rather strong excess (), pointing to a relatively massive but inactive disk being present (although no excess is present). Although the flare (Fig. 8) has a very sharp peak, it decays slowly ( ks), lasting for a few days. The event represents a relatively modest increase over the characteristic level of a factor of 4, but the shallow implies a high level of sustained heating during the decay, so that (also given the high temperature, MK) the resulting flaring loop is very large, , although the significant uncertainty in implies a lower confidence range of . Nevertheless, even at the lower end of the confidence range, the flaring region is larger than normally found in active stars, providing evidence that large loops, likely connecting the star to the disk, must have existed for the young Sun.
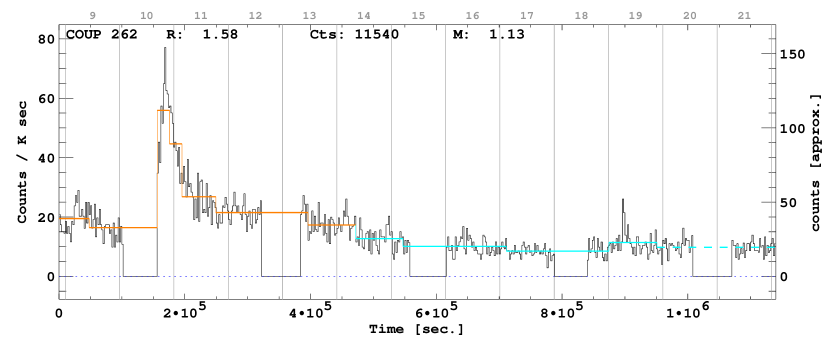

A.4. COUP 597
COUP 597 is a somewhat more massive star than COUP 262, with and . The strong Ca ii absorption shows it not to be actively accreting. The flare (Fig. 9) appears to be the superposition of two events, a less intense and more long-lasting one and a more intense one of which only the very fast decay is visible, as the rest falls into an observation gap. As the analysis relies on the delay of the second, slower flare, the first, fast event should have no effect on the results. The peak temperature for the longer event (determined during the rise phase) may be affected at some level from the presence of the first flare. However, given the very moderate peak temperature, and the weak dependance (as ) of the loop size on peak temperature, this will not have a strong effect on the results.
Of interest here is the slow rise of the longer flare, which appears to take place over a day or so. The loop size resulting from the analysis is , thus a moderate size loop. The size is largely driven by the slow temperature decay and resulting shallow (with , implying strong sustained heating). The slow rise can therefore imply either a very slowly rising heating function, or perhaps (using the results of the modeling of COUP 1343, Sect. 4.1) a heating source distributed along the loop (or even concentrated near the loop top) rather than localized at the loop footpoints.
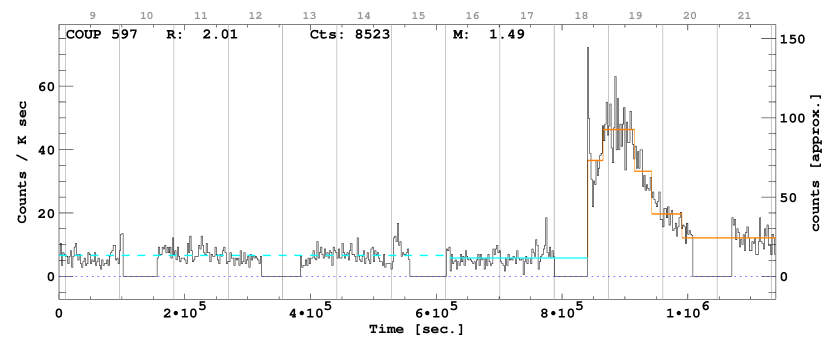

A.5. COUP 649
COUP 649, is a typical low-mass member of the ONC, with and . It shows no evidence for active accretion and has an excess ().
The flaring event has a very peculiar evolution (Fig. 10), with an initial very slow rise, lasting for about a day, followed by a plateau at about the characteristic rate; after another half day, an impulsive peak increases the count rate by another factor of two, and then the decay begins. Notwithstanding the oddly shaped light curve, the event shows some of the characteristics of a magnetically confined flaring structure, in particular the temperature which peaks while the count rate is still increasing, and has already started to decrease on the plateau. Somewhat peculiarly, the secondary sharp peak preceding the decay does not result in an increase in the temperature.
The limited statistics does not allow a detailed analysis, with only two points on the flare’s decay. The peak temperature ( MK) is moderate by the standard of the other large flares analyzed here, and the nominal length of the flaring structure is , although with a large uncertainty driven by the uncertainty on .
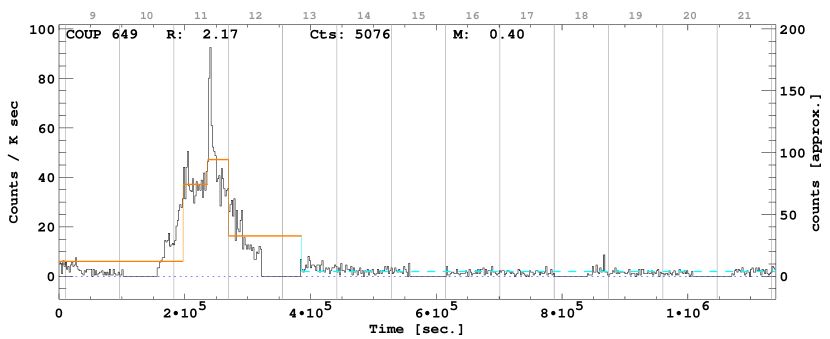
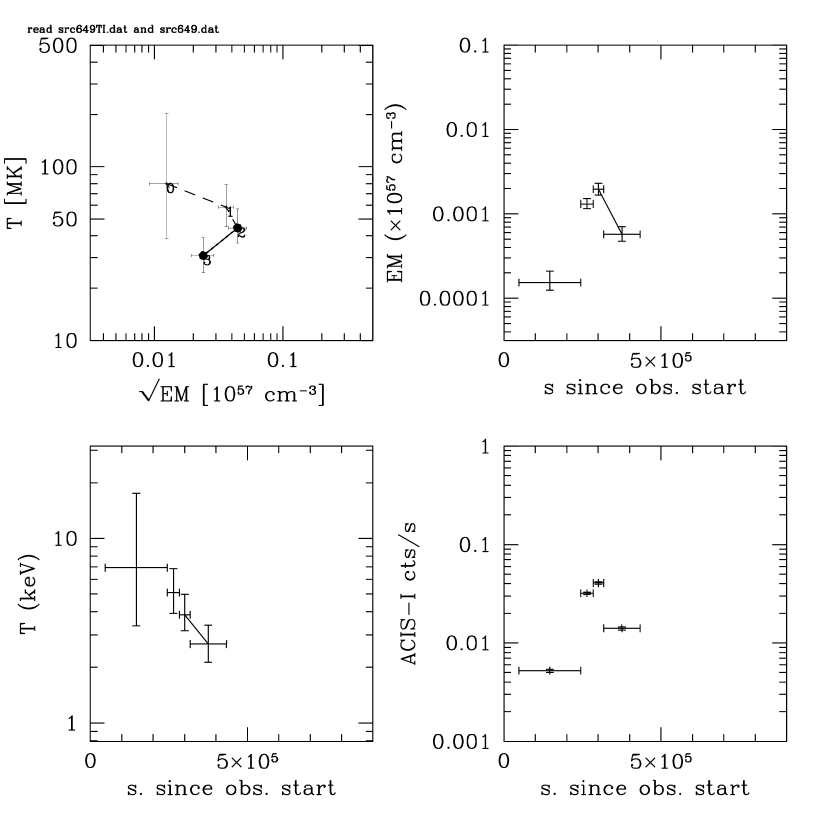
A.6. COUP 669
COUP 669 is a relatively massive object, with and , and an excess (). The flare (Fig. 11) is a well defined impulsive event, for which the rise phase has however been cut by an observing gap. The peak temperature, at MK is relatively modest, but the fast decay of the temperature implies limited sustained heating, resulting in a flaring loop with a reasonably well determined size, , typical of the large flaring loops in the COUP sample.
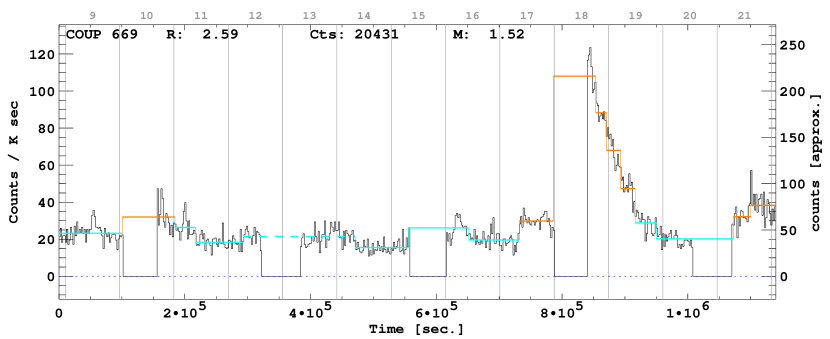

A.7. COUP 752
Another typical low-mass object, COUP 752, has and , no evidence for ongoing accretion, and an excess (). COUP 752 undergoes a very intense flare (Fig. 12), with a peak count rate more than the characteristic one. The event lasts over 5 days, and the rise phase is long (half a day) and well observed. The excellent statistics allow for a detailed analysis of the event, although the initial part of the decay unfortunately falls in an observing gap. The flare’s peak temperature slightly exceeds 100 MK, still falling in the domain in which the ACIS detector gives reliable temperature determinations.
Notwithstanding the very large increase in count rate, the event follows well the evolution in the – plane for a flare confined in a single loop. The temperature peaks (block 1) when the emission measure has just started to rise (and still is only about one tenth of the peak value), and then decreases to MK when the emission measure has peaked. The decay does not follow a simple exponential law; rather, there is clear evidence for sustained heating, with well defined reheating events. In particular, in block 11 (immediately after the first observing gap) the temperature increases again briefly, and the decay of both the light curve and the emission measure changes slope, clear evidence for reheating of the plasma.
Our analysis shows a very shallow , indicative of the presence of strong ongoing heating during the flare decay, as it is also evident from the increase in plasma temperature. As a consequence, only an upper limit to the flaring structure’s size can be derived, at , with a best-fit value . The resulting minimum confining magnetic field, at G is relatively strong.
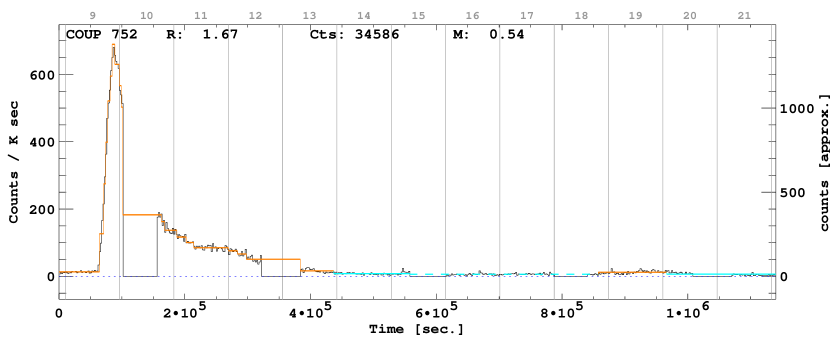

A.8. COUP 891
COUP 891 is the most massive object in the COUP flaring sample, with , , a strong excess (), no evidence for accretion and significant obscuration ( mag). The X-ray light curve suffers from significant pile-up, and therefore we have used, for our analysis, the list of photons extracted from an annular region free from pile-up, as described by Getman et al. (2005). This strongly reduces the number of photons available for a spectral analysis, so that only moderate statistics are available for this event.
Two flares are present in the COUP light curve (Fig. 13); however the first one is too short and cannot be analyzed with the approach adopted here. The second event is a well defined impulsive event, with a fast rise and a regular, exponential decay, well traced for more than four days. At the peak, the flare count rate is larger than in quiescence. The peak temperature is slighly above 100 MK, but still within the range of the ACIS instrument. The fast decay of temperature results in a fairly steep , and thus in little sustained heating. The long decay time ( ks) therefore results in a long flaring structure, .
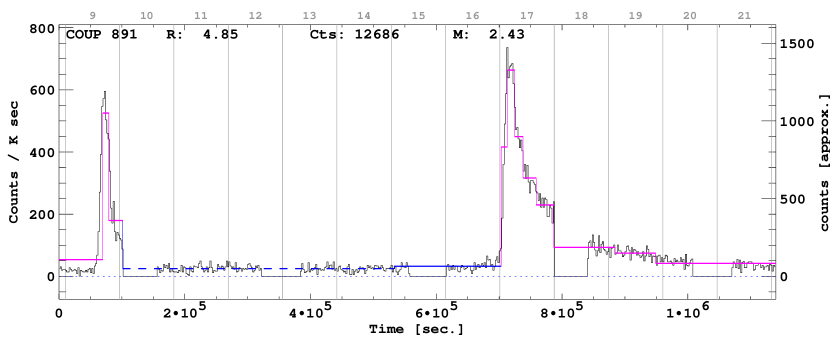

A.9. COUP 971
COUP 971 is a low mass () star with . The Ca ii in absorption points to a non-accreting system. The flaring event (Fig. 14) is a typical example of a short impulsive flare. The decay in the – plane is steep and regular, pointing to little if any residual heating. The result is a moderate size loop (), similar to the ones resulting from the analysis of intense flares in more evolved stars; this is likely an example of an event confined in a structure anchored to the stellar photosphere only.
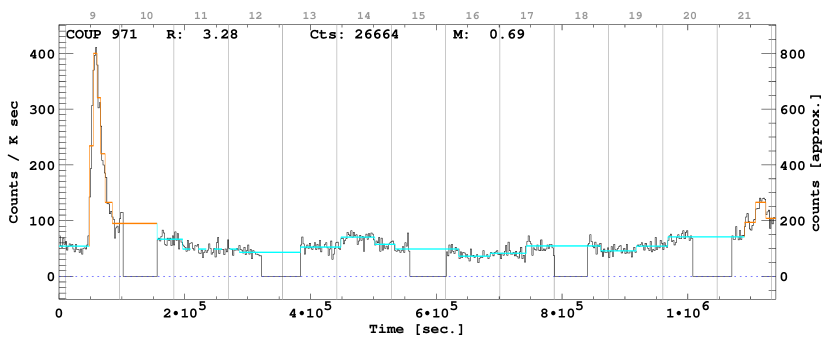

A.10. COUP 1083
Little optical information is available for COUP 1083, and in particular no mass and radius estimate is known. A rotational period has however been derived ( d) for this star. Its spectral type has been estimated at M0, showing that the object must have a moderate mass.
The flare present in the COUP 1083 lightcurve has a peculiar shape, well visible in Fig. 15, with a very slow rise, lasting more than one day, and a decay lasting about 3 days. The peak of the flare unfortunately falls in an observing gap, and it thus not visible. We have analyzed the event assuming that the observed maximum is the actual peak, but in practice the peak might be higher, although this would not substantially affect our conclusions.
Notwithstanding the peculiar light curve, the evolution of the event follows the one theoretically expected for a confined flare, with the temperature peaking prior to the and a regular decay in the – plane. A second event may be starting in the final phase of the decay of the flare, on day 12, as shown both by the increasing count rate and by the increasing temperature. The second flare is cut by the observation gap and thus nothing can be derived for it. We have not included the last ML block in the analysis.
Although the statistics are limited (and thus the error bars large), the derived steep is compatible with limited sustained heating, so that a long structure, cm, is derived from the analysis due to the slow flare decay ( ks). The large size is also compatible with the very slow rise time, as discussed for the detailed model of COUP 1343 (Sect. 4.1).
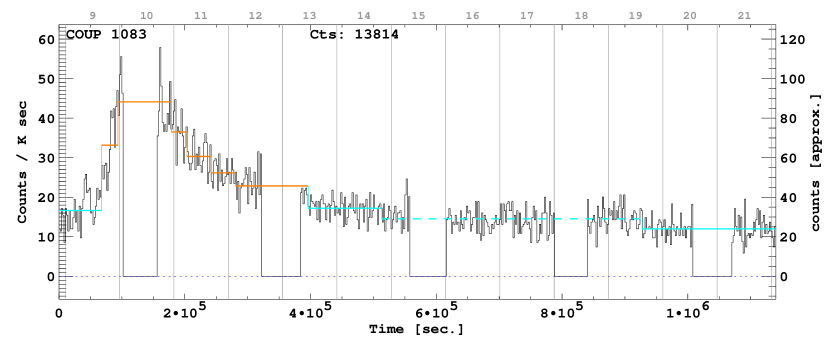

A.11. COUP 1246
COUP 1246 is one of the lowest-mass stars in the present sample, with and . It shows no evidence for active accretion, but it has a sizable -band IR excess () and is one of the sources showing an excess but not a band one; its rotational period has been determined at d. The flare (Fig. 16) is a very well defined impulsive event, with a fast rise and a peak count rate the characteristic rate. Also in this case the peak observed temperature is somewhat above 100 MK, but still within the range of reliability of ACIS. The decay in the – plane is well defined, and closely follows the one expected from the models of confined flares, allowing to analyze the event in some detail. The light curve plotted in the top panel of Fig. 16 shows clear evidence for a second, smaller flare developing on the tail of the first one, resulting in an increase in temperature at the flare end. Statistics are insufficient to analyze the second flare at any level of detail, and therefore the last block has not been included in the analysis. The resulting size of the flaring region is , i.e. a typical event for the COUP sample.
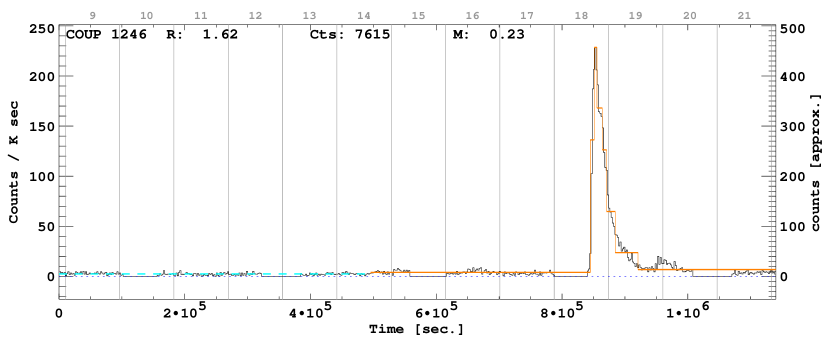

A.12. COUP 1343
Very little is known about the optical counterpart to COUP 1343 (the analysis for the flare is shown in Fig. 1), with no mass or radius estimates known, although a rotational period measurement ( d) is available. The flare is a very well defined event, with a clean impulsive rise and an undisturbed decay. The peak flare luminosity is larger than the characteristic source luminosity, allowing a clean analysis of the flare spectral characteristics. In the analysis we have ignored the last segment of the flare (the one extending into day 13), for which the temperature has too large an error (also because of the data gap). The peak temperature of the flare is very high, with a nominal best-fit temperature of MK. As discussed above such high temperatures cannot be reliably determined with ACIS, and therefore the resulting flare size (based on the assumption MK) is to be considered as a lower limit.
The rapid temperature decrease implies that little sustained heating is present, so that the observed decay is close to the thermodynamic decay of the loop. The smooth decay also argues for the lack of significant reheating. Therefore, with ks and MK, the analysis results in cm, or . Even if COUP 1343 were a relatively massive star, with a radius of a few , the flaring structure would still be several times the size of the star. The resulting magnetic field, while moderate in itself (150 G), must be coherently organized over some 0.1 AU.
As described in Sect. 4.1 the evolution of the same event has also been simulated in detail, confirming that the temperature and emission measure evolution are the result of a flare confined in a large loop of the same size of the one found by the decay analysis discussed here, with impulsive heating.
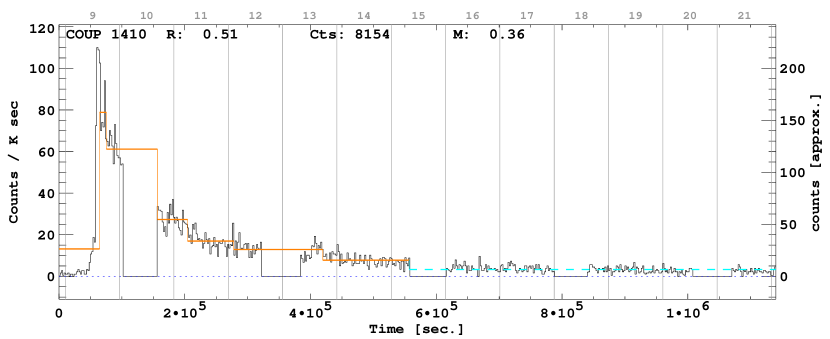
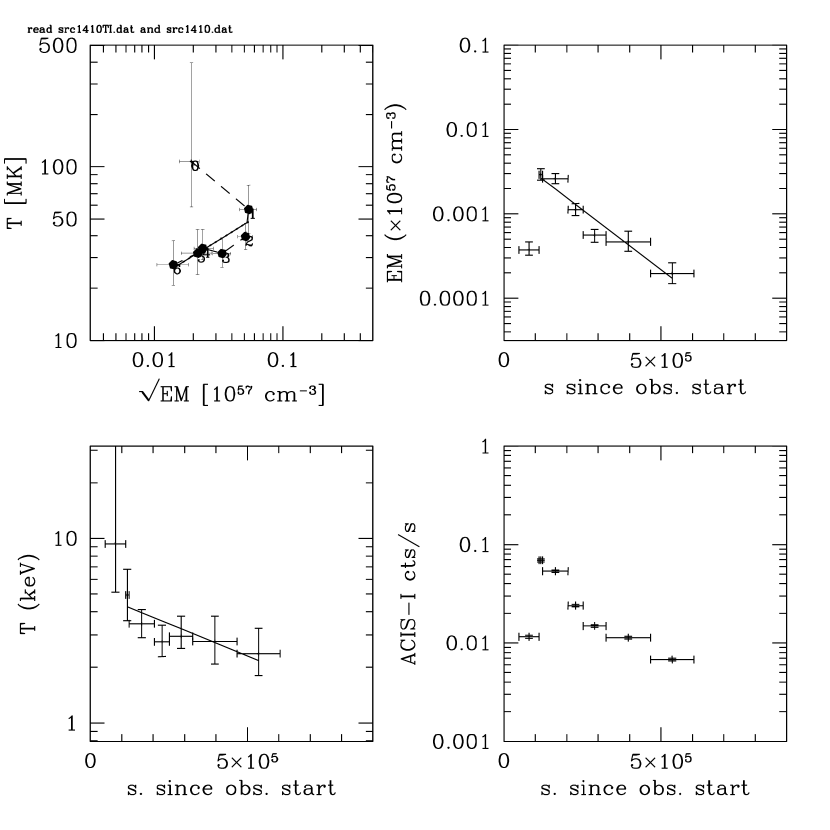
A.13. COUP 1410
COUP 1410 appears more evolved than the rest of the sample, with an estimated age yr, and a consequently small radius () for its mass (). It shows no evidence for accretion from Ca ii emission, but it has a significant -band excess (). The rotational period has been measured at d.
The flare (Fig. 17) has a well defined impulsive rise, followed by a very long decay extending for over a week, with ks. Even though significant heating is present (as shown by the shallow ), the resulting size of the flaring structure is , very long with respect to the (small) stellar radius. However, the uncertainty on results in a significant uncertainty on , which has a lower range of , the same large size as found for the best determined large events in the COUP sample, making this event a good candidate for a star-disk connecting structure.
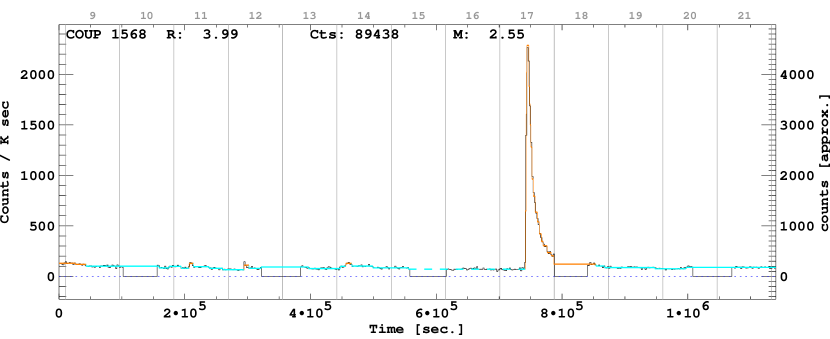

A.14. COUP 1568
COUP 1568 is another relatively massive object in the flaring sample, with and . It has a small IR excess ().
The flare (Fig. 18) is relatively short, lasting just one day, but it is intense, peaking at over the characteristic rate, with excellent statistics due to the source’s off-axis angle which prevents pile-up. The impulsive phase is very sharp, and the decay almost a perfect exponential. The peak temperature is very high: the best-fit values for the ACIS spectra at peak are MK, however with a very large uncertainty which always include values as low as 100 MK, due to the ACIS spectral response.
Once in the decay phase, the temperature decays very slowly, resulting in a very shallow . Therefore only an upper limit to size of the flaring structure can be obtained, cm, with a best fit value . Unlikely many of the large COUP flares studied in this paper, this event is very likely to be compact, with size smaller than the star itself. A small size is also implied by the very fast rise phase (which constrains the time scale with which the chromospheric evaporation will fill the flaring loop). Given the compact size, together with the large peak emission measure and high temperature, the peak flare density will likely be high ( cm-3), as must the confining magnetic field ( kG)
References
- Betta et al. (1997) Betta R., Peres G., Reale R., Serio S. 1997, A&AS 122, 585
- Bower et al. (2003) Bower G. C., Plambeck R. L., Bolatto A., McCrady N., Graham J. R., de Pater I., Liu M. C., Baganoff F. K. 2003, ApJ 598, 1140
- Culhane et al. (1970) Culhane J. L., Vesecky J. F., Phillips K. J. H. 1970, Solar Physics 15, 394
- Drake (2005) Drake J. J. 2005, in F. Favata, G. Hussain (eds.), Cool Stars, Stellar Systems and the Sun, ESA-SP 560, in press
- Favata & Micela (2003) Favata F., Micela G. 2003, Space Science Reviews 108, 577
- Favata et al. (2001) Favata F., Micela G., Reale F. 2001, A&A 375, 485
- Favata et al. (2000a) Favata F., Micela G., Reale F., Sciortino S., Schmitt J. H. M. M. 2000a, A&A 362, 628
- Favata et al. (2005) Favata F., Micela G., Silva B., Sciortino S., Tsujimoto M. 2005, A&A 433, 1054
- Favata et al. (2000b) Favata F., Reale F., Micela G. et al. 2000b, A&A 353, 987
- Favata & Schmitt (1999) Favata F., Schmitt J. H. M. M. 1999, A&A 350, 900
- Feigelson & Montmerle (1999) Feigelson E. D., Montmerle T. 1999, ARA&A 37, 363
- Flaccomio et al. (2003) Flaccomio E., Micela G., Sciortino S. 2003, A&A 397, 611
- Garay et al. (1987) Garay G., Moran J. M., Reid M. J. 1987, ApJ 314, 535
- Getman et al. (2003) Getman K. V., Feigelson E. D., Garmire G., Murray S. S., Harnden F. R. 2003, IAU Circ. 8068, 2
- Getman et al. (2005) Getman K. V., Flaccomio E. et al. 2005, ApJS in press (this issue)
- Grosso et al. (1997) Grosso N., Montmerle T., Feigelson E. D. et al. 1997, Nat 387, 56
- Grosso et al. (2004) Grosso N., Montmerle T., Feigelson E. D., Forbes T. G. 2004, A&A 419, 653
- Hartmann et al. (1994) Hartmann L., Hewett R., Calvet N. 1994, ApJ 426, 669
- Hillenbrand & Carpenter (2000) Hillenbrand L. A., Carpenter J. M. 2000, ApJ 540, 236
- Hillenbrand (1997) Hillenbrand L. A. 1997, AJ 113, 1733
- Hillenbrand et al. (1998) Hillenbrand L. A., Strom S. E., Calvet N., Merrill K. M., Gatley I., Makidon R. B., Meyer M. R., Skrutskie M. F. 1998, AJ 116, 1816
- Imanishi et al. (2003) Imanishi K., Nakajima H., Tsujimoto M., Koyama K., Tsuboi Y. 2003, Publ. Astr. Soc. Japan 55, 653
- Jardine (2004) Jardine M. 2004, A&A 414, L5
- Johns-Krull & Valenti (2005) Johns-Krull C. M., Valenti J. A. 2005, in F. Favata, G. Hussain (eds.), Cool Stars, Stellar Systems and the Sun, ESA-SP 560, in press
- Johns-Krull et al. (2004) Johns-Krull C. M., Valenti J. A., Saar S. H. 2004, ApJ 617, 1204
- Kastner et al. (2002) Kastner J. H., Huenemoerder D. P., Schulz N. S., Canizares C. R., Weintraub D. A. 2002, ApJ 567, 434
- Loinard et al. (2005) Loinard L., Mioduszewski A., Rodriguez L. F., Gonzalez R. A., Rodriguez M. I., Torres R. M. 2005, ApJ Letters, in press, astroph/0501062
- Maggio et al. (2000) Maggio A., Pallavicini R., Reale F., Tagliaferri G. 2000, A&A 356, 627
- Mestel & Spruit (1987) Mestel L., Spruit H. C. 1987, MNRAS 226, 57
- Meyer et al. (1997) Meyer M. R., Calvet N., Hillenbrand L. A. 1997, AJ 114, 288
- Muzerolle et al. (2003) Muzerolle J., Calvet N., Hartmann L., D’Alessio P. 2003, ApJ 597, L149
- O’Dell & Wong (1996) O’Dell C. R., Wong K. 1996, AJ 111, 846
- Pallavicini et al. (1990) Pallavicini R., Tagliaferri G., Stella L. 1990, A&A 228, 403
- Peres et al. (1982) Peres G., Serio S., Vaiana G. S., Rosner R. 1982, ApJ 252, 791
- Peter et al. (2004) Peter H., Gudiksen B. V., Nordlund Å. 2004, ApJ 617, L85
- Preibisch et al. (2005) Preibisch T. et al. 2005, ApJS in press (this issue)
- Priest & Forbes (2002) Priest E. R., Forbes T. G. 2002, Astronomy and Astrophysics Review 10, 313
- Reale (2002) Reale F. 2002, in F. Favata, J. Drake (eds.), ASP Conf. Ser. 277: Stellar coronae in the Chandra and XMM era, ASP, San Francisco, 103
- Reale et al. (1997) Reale F., Betta R., Peres G., Serio S., McTiernan J. 1997, A&A 325, 782
- Reale et al. (2002) Reale F., Bocchino F., Peres G. 2002, A&A 383, 952
- Reale et al. (2004) Reale F., Güdel M., Peres G., Audard M. 2004, A&A 416, 733
- Reale & Micela (1998) Reale F., Micela G. 1998, A&A 334, 1028
- Reale et al. (1988) Reale F., Peres G., Serio S., Rosner R., Schmitt J. H. M. M. 1988, ApJ 328, 256
- Schmitt & Favata (1999) Schmitt J. H. M. M., Favata F. 1999, Nat 401, 44
- Schmitt et al. (2005) Schmitt J. H. M. M., Robrade J., Ness J.-U., Favata F., Stelzer B. 2005, A&A in press
- Schrijver et al. (2004) Schrijver C. J., Sandman A. W., Aschwanden M. J., DeRosa M. L. 2004, ApJ 615, 512
- Serio et al. (1991) Serio S., Reale F., Jakimiec J., Sylwester B., Sylwester J. 1991, A&A 241, 197
- Shu et al. (2000) Shu F. H., Najita J. R., Shang H., Li Z.-Y. 2000, Protostars and Planets IV 789
- Shu et al. (1997) Shu F. H., Shang H., Glassgold A. E., Lee T. 1997, Science 277, 1475
- Stelzer et al. (2000) Stelzer B., Neuhäuser R., Hambaryan V. 2000, A&A 356, 949
- Stelzer & Schmitt (2004) Stelzer B., Schmitt J. H. M. M. 2004, A&A 418, 687
- Sylwester et al. (1993) Sylwester B., Sylwester J., Serio S. et al. 1993, A&A 267, 586
- Tsuboi et al. (1998) Tsuboi Y., Koyama K., Murakami H. et al. 1998, ApJ 503, 894
- Tsujimoto et al. (2005) Tsujimoto M., Feigelson E., Grosso N. et al. 2005, ApJS in press (this issue)
- Wolk et al. (2005) Wolk S., Harnden, F. R. J., Flaccomio E., Micela G., Favata F., Shang S., Glassgold A., Feigelson E. D. 2005, ApJS in press (this issue).