Optical and X-ray studies of chromospherically active stars : FR Cancri, HD 95559 and LO Pegasi
Abstract
We present a multiwavelength study of three chromospherically active stars, namely FR Cnc (= BD +16°1753), HD 95559 and LO Peg (=BD +22°4409), including newly obtained optical photometry, low-resolution optical spectroscopy for FR Cnc, as well as archival IR and X-ray observations.
The BVR photometry carried out during the years 2001 - 2004 has found significant photometric variability to be present in all three stars. For FR Cnc, a photometric period has been established. The strong variation in the phase and amplitude of the FR Cnc light curves when folded on this period implies the presence of evolving and migrating spots or spot groups on its surface. Two independent spots with migration periods of 0.97 and 0.93 years respectively are inferred. The photometry of HD 95559 suggests the formation of a spot (group) during the interval of our observations. We infer the existence of two independent spots or groups in the photosphere of LO Peg, one of which has a migration period of 1.12 years.
The optical spectroscopy of FR Cnc carried out during 2002-2003, reveals the presence of strong and variable Ca II H and K, Hβ and emission features indicative of high level of chromospheric activity. The value of 5.3 for the ratio of the excess emission in to , , suggests that the chromospheric emission may arise from an extended off-limb region.
We have searched for the presence of color excesses in the near-IR JHK bands of these stars using 2MASS data, but none of them appear to have any significant color excess. We have also analyzed archival X-ray observations of HD 95559 and LO Peg carried out by with the ROSAT observatory. The best fit models to their X-ray spectra imply the presence of two coronal plasma components of differing temperatures and with sub-solar metal abundances. The inferred emission measures and temperatures of these systems are similar to those found for other active dwarf stars.
The kinematics of FR Cnc suggest that it is a very young (35 - 55 Myrs) main-sequence star and a possible member of the IC 2391 supercluster. LO Peg also has young disk-type kinematics and has been previously suggested to be a member of the 100 Mys old Local Association (Pleiades Moving Group). The kinematics of HD 95559 indicate it is a possible member of the 600 Myrs old Hyades supercluster.
1 Introduction
Differential rotation in late-type stars having convective envelopes drives a magnetic dynamo leading to strong chormospheric emission and the formation of a corona. The Solar corona, though readily visible because of its proximity, is only about of the Solar photospheric emission. Rapidly rotating late-type stars, however, display an extremely enhanced coronal activity when compared with that of the Sun. Strong X-ray and nonthermal radio emission in late-type stars are well-known indicators of enhanced coronal activity (Drake, Simon & Linsky 1992). Ayres and collaborators have shown (e.g., Ayres et al. 1995) that the emission from coronae (K) and chromospheres (K) are closely correlated, and thus stars with intense coronae will also have strong chromospheres. While many active stars have been identified as such through their above-average X-ray and radio emission, it is only through detailed optical photometric and spectroscopic studies that their activity can be classified into known types, such as the RS CVn, BY Dra and FK Comae classes. The common characteristic of all these various classes of active star, be they single stars or binaries, is rapid rotation: single, rapidly rotating stars are either young stars which have not yet lost most of their angular momentum or (in a few rare cases) are the results of the merger of a close binary system, while rapid rotation in close binaries is the natural result of spin-orbit tidal coupling and can occur even in middle-aged and/or old stars.
RS CVn types are binary systems that contain a hotter component with spectral type F- to G- and luminosity class V or IV, and a cooler component that is usually a sub-giant or a giant K-type star (Hall 1976). RS CVns have been further subdivided into three groups according to their orbital period (P) : short period RS CVn (P 1 d); classical RS CVn (1d P 14d); and long period systems usually containing at least one cool giant component (P 14d). BY Dra type stars have properties similar to the RS CVn systems, but consist of a late dKe or dMe type star with orbital or rotational period in the range of to . As originally defined by Bopp & Fekel (1977), BY Dra types may include active single main-sequence stars as well as members of detached binary systems. (In the alternate definition of active binary systems of Fekel, Moffett & Henry 1986, there is no restriction on the spectral type of the companion star or on the orbital period for RS CVn binaries, except that the more active star is in an evolved evolutionary state, and systems with F- and G type dwarf primaries are now classed as BY Dra binaries rather than as a sub-type of RS CVns). FK Com stars are a rather rare class of apparently single, rapidly rotating late-type (G or K) giant stars which were first described by Bopp & Stencel (1981): the origin of these stars is still poorly understood, with the hypothesis that they are the remnants of coalesced binaries being the most widely accepted. As a group, the late spectral type BY Dra stars tend to more often exhibit Hα emission and more frequent flaring activity than the RS CVn systems, but this is probably mostly due to the greater contrast of their chromospheric emission lines relative to their weaker photospheric emission. Both RS CVns and BY Dra binaries typically rotate synchronously with their orbital period, but there are known systems (Glebocki & Stawikowski 1997) which are known to rotate asynchronously, e.g., the prototype K3.5V K 3.5V binary system BY Dra which has a rotational period of 3.84 and an orbital period of .
The soft (0.1 - 2.0 keV) X-ray luminosities () of RS CVn systems are generally in the range of erg s-1 (Drake, Simon & Linsky 1989), while BY Dra stars tend to have erg s-1 (Dempsey et al. 1993). In either case the value of for these stars are times the X-ray luminosity of the Quiet Sun. The radio luminosity () of RS CVn systems ranges from to erg s-1 Hz-1 (Morris & Mutel 1988; Drake, Simon & Linsky 1989), while for the BY Dra types it is typically erg s-1 Hz-1 (Caillault, Drake & Florkowski 1988; Güdel et al. 1993), much more than the Quiet Sun value of erg s-1 Hz-1 in both cases. In this paper we present a detailed investigation based on our extensive optical observations and archival X-ray data of three chromospherically active stars selected on the basis of their strong X-ray and radio fluxes. These stars are FR Cnc, HD 95559 and LO Peg.
The star BD +16°1753 (= MCC 527) first came to be noticed as a potential active star when it was identified as the likely optical counterpart of a soft X-ray source in the Einstein Slew Survey, 1ES 0829+15.9, with an observed X-ray flux of erg s-1 cm-2 (Elvis et al. 1992; Schachter et al. 1996). This X-ray source was rediscovered in the ROSAT All-Sky Survey (RASS) at a somewhat weaker (but more statistically significant) level of erg s-1 cm-2, and dubbed 1RXS J083230.9+154940 in the RASS Bright Source Catalogue (Voges et al. 1999). In the photometric notes annex of Hipparcos catalogue (Perryman et al. 1997), it was regarded as an unsolved variable star and given the name FR Cnc. It was recently classified as a BY Draconis type in the 74th special Name-List of the variable stars (Kazarovets et al. 1999). The implied X-ray luminosity of erg s-1 and ratio of X-ray to bolometric luminosity of both show that FR Cnc has an active corona at or near the saturation limit of of (Schachter et al. 1996). Recently, Upgren, Sperauskas & Boyle (2002) have given two measurements of the radial velocity of FR Cnc (see Table 5) which differ only by an amount of the order of the measurement error, and the authors thus conclude that it is not a binary system. A preliminary report on FR Cnc based on a limited subset of the data was presented by Pandey et al. (2002).
HD 95559 (= BD 23°2287) has recently been shown to be a double lined spectroscopic binary with an orbital period of . With a photometric period of it is tightly synchronized to the orbital motion (Fekel & Henry 2000). Previous reports that this system has a photometric period (Jeffries, Bertram & Spurgeon 1994; Strassmeier et al. 2000) appear to have been the detection of the alias of the orbital period. HD 95559 is a pair of K1 V stars with a Li-based age younger than the Hyades cluster. Fekel & Henry (2000) conclude that optical variability in this system is due to the rotational modulation of the star spots and thus identify it as belonging to the (binary) BY Dra type.
LO Peg (=BD+22°4409) is a single young K5V - K7V type star and is a member of the local association (Jeffries & Jewell 1993; Montes et al. 2001). It is an active star showing strong and Ca II H and K emission lines (Jeffries et al. 1994). Jeffries et al. (1994) proposed six probable rotational periods, and stated that the periods of 0.3841 d and 0.42375 d are more likely. Subsequently, Robb & Cardinal (1995) eliminated completely the possibility of the 0.38417 d period. Evidence of an intense downflow of material and optical flaring on LO Peg have been presented by Eibe et al. (1999). Recently, Zuckerman, Song & Bessel (2004) has identified LO Peg as a member of a group of Myr old stars that partially surround the Sun.
The paper is organized as follows: in §2, we describe the primary observational datasets that we have analyzed, and the methods of data reduction. The optical light curve and the period analysis of the star FR Cnc are discussed in §3. In §4, we present the folded light and color curves of all three stars and provide an interpretation for the drift in phase of their wave minima. In §5, we discuss the low-resolution optical spectra of FR Cnc that we have obtained. The ROSAT X-ray spectra of the stars HD 95559 and LO Peg are discussed in §6, and §7 contains a comparison of their X-ray properties with other similar stars. The physical parameters, JHK photometry and kinematics of the stars FR Cnc, HD 95559 and LO Peg are described §8, 9, and 10, respectively, while we present our conclusions in §11.
2 Observations and Data reductions
2.1 Optical Photometry
FR Cnc, HD 95559 and LO Peg were observed in Johnson B, V and Cousins R filters from 2001 to 2004 at the State Observatory of Naini Tal (now renamed as Aryabhatta Research Institute of Observational Sciences, ARIES). The observations were made with the 104-cm Sampurnanand telescope (SNT) to which a CCD (field of view ) in the years 2001 -2003, and a CCD (field of view ) during the season 2003-2004, were attached. A log of the observations is given in Table 1. A number of CCD frames were taken on each night with different exposure times ranging from 10 to 120 secs depending upon the seeing conditions and the filter used. Several bias and twilight flat frames were taken during the observing runs. Bias subtraction, flat-fielding and aperture photometry were performed using IRAF111IRAF is distributed by National Optical Astronomy Observatories, USA. For each star, differential photometry in the sense of variable minus the comparison was done as all the program, comparison and check stars were in the same CCD frame.
UBVRI observations of FR Cnc along with that of Landolt (1992) standard SA 98 region were obtained on 22 February 2004 for photometric calibration. The average magnitudes of FR Cnc in the UBVRI filters were and , respectively. The present photometry is well matched to the Weis (1993) photometry. LO Peg was also observed for photometric calibration using PG 2213-006 standard fields (Landolt 1992) on 03 October 2002 in B, V, R and I band. The corresponding average magnitudes are , , and , respectively.
2.2 Optical Spectroscopy
Spectroscopic observations were carried out on 2002 November 15 and 2003 January 20 to 24 at the Vainu Bappu Observatory, Kavalur with the OMR spectrograph fed by the 234-cm Vainu Bappu Telescope (VBT). The data were acquired with a CCD camera of square pixel size, covering a range of and having a dispersion of . A signal-to-noise ratio between 20 to 30 was achieved. During these observations we took ten spectra of FR Cnc in the region, six in the region and five in the Ca II H and K region. A total of 21 spectra were thus taken. HD 26795, a K3V type star, was observed as the standard.
The spectra have been extracted using the standard reduction procedures in the IRAF packages (bias subtraction, flat fielding, extraction of the spectrum and wavelength calibration using arc lamps). The spectral resolution was determined by using emission lines of arc lamps taken on the same nights. Spectral resolution () of at and at was achieved. All the spectra were normalized to the continuum and equivalent widths (EWs) for emission lines were computed using IRAF task splot. The error in the measurements of EWs of the , and CaII H and K lines was computed by measuring the EWs of 4 moderate absorption features at 6494, 6163, 6122 and 6103 Å in each spectra. The standard deviation for each absorption feature was computed from the 10 spectra available. The mean of the standard deviations thus obtained was 0.04 Å, and was taken as the error in the measurement of the EWs of all the absorption as well as the emission line features (see also Padmakar et al. 2000).
2.3 X-ray
The stars HD 95559 and LO Peg were observed serendipitously in pointed observations of the ROSAT PSPC detector. This instrument had an energy range from 0.1-2.4 keV with a rather low spectral resolution ( at 1 keV). A full description of the X-ray telescope and detectors can be found in Trümper (1983) and in Pfeffermann et al. (1987). The ROSAT X-ray data for these two stars were obtained from the High Energy Astrophysics Science Archive Research Center (HEASARC). The ROSAT observational parameters are given in Table 1. LO Peg was observed on two occasions, the first on 1993 November 11-13, and the second a month later on 1993 December 7-8, while the HD 95559 observation consisted of two short exposures in 1993 June separated by a week. (FR Cnc was not observed in any of the pointings made by ROSAT, but it was, however, detected in the ROSAT All-Sky Survey phase, as has already been mentioned in the introduction). HD 95559 and LO Peg were offset from the center of the PSPC field by 38.4 and 0.31 arcmin, respectively. Spectra of both the stars were accumulated from on-source counts obtained from circular region on the sky centered on the X-ray peak. The background was accumulated from several neighboring regions at nearly the same offset as the source.
3 Light curves and period analysis of FR Cnc
3.1 Present light curve
We obtained nine light curves, with each light curve corresponding to an observational run that was nearly continuous. Figure 1 shows the light curves of FR Cnc for each epoch. The mean epoch of the light curves, the observed maximum () and minimum () in the V band, peak to peak amplitude (), and phase minima () are listed in Table 2. was determined by a linear least square fitting of the second order polynomial at the minimum of each light curve. It appears that the shape and the amplitude of the light curves are changing during the observing season.
During the observing season 2001-2003 for the star FR Cnc the comparison and check stars were TYC 1392 2110 1 (= S1) and USNO-A2.0 1050-05766589 (= C), respectively. BD +16°1751 (= S2) of the spectral type G0 was taken as the comparison star during the observing season 2003-2004. The mean difference between the (S2-C) and (S1-C) in each BVR filter was added to each BVR data of 2003-2004 season before plotting. No significant light variation was detected between the different measures of comparison and check stars () (see the bottom panels of Figure 3 (a to i)) indicating that the comparison stars are constant during the present observations. The nightly mean of the standard deviation () of different measures of comparison and check stars in B, V and R filter was 0.007,0.007 and 0.008 mag, respectively. Similarly, determined for and was 0.006 and 0.01 mag.
Large gaps in the dataset lead to complications in the interpretation of the power density spectrum as the true frequencies of the source are further modulated by the irregular and infrequent sampling defined by the window function of the data. Therefore, the calculation of the dirty power density spectrum from the light curve was followed by deconvolution of the window function from the data using one dimensional CLEAN (Roberts, Lehar & Dreher 1987) algorithm in Starlink’s PERIOD package, where we have assumed quasi-sinusoidal light curve. The power spectrum picks out the rotation period despite the noise and the fact that the light curve is not exactly sinusoidal (Bailer-Jones & Mundt 2001). The uncertainty in the period determination is set by the finite resolution of the power spectrum. This is determined as , where P is period and is the duration of the observations (Roberts, Lehar & Dreher 1987). The CLEANed power spectra presented here were obtained after 100 iterations with a loop gain of 0.1. Data for each epoch were analyzed separately for the periodicity by using the CLEAN algorithm. Inset in each panel of Fig. 1 shows the corresponding CLEANed power spectrum. The epoch and the period are mentioned inside each panel of Fig. 1. The period is found to be constant, within the uncertainty, for each epoch.
The entire data were also analyzed together using the CLEAN algorithm to improve the period determination. The top panel of Figure 2 shows the discrete power spectra, with the corresponding window and CLEANed power spectra shown in the middle and the bottom panel. The highest peak in the CLEANed power spectrum corresponds to a period of
3.2 Hipparcos light curve
The light curve based on the Hipparcos photometric data is shown in Fig. 1 (j). The total number of measurements with Hipparcos is 70 during three years (1990 March - 1992 November) of observations. We have also analyzed the Hipparcos data using the same algorithm as used for our photometric data. The CLEANed power spectrum is shown in the inset of Fig. 1 (j). The highest peak here corresponds to a period of , which is close to the period determined from the present data.
4 Folded Light and Color curves
4.1 FR Cnc
The data were folded using the period of , and an arbitrary epoch of JD 2451943.1980. Fig. 3 shows the plot of and as a function of phase at different epochs. The mean epoch is mentioned at the top of each panel of Fig. 3. As can be seen from Fig. 3, the phase coverage is fair to reasonably good in most of the light curves.
The value of was nearly constant during most of the epochs indicating that the brightness of the unspotted photosphere was constant from epoch to epoch. During the epoch ’b’ it went to its minimum value. At the same time a smaller variation () during this epoch is probably associated with a continuous reduction of the spot coverage. Light curve during the epoch ’b’ has two maxima whereas during the epoch ’c’ it has one flat maximum and one minimum indicating the formation of a new group of spots that further separate into two groups of spots during the epoch ’d’ and ’e’. An increase in the amplitude by 0.05 mag during the epoch ’e’ indicates an increase in the spot coverage on the surface of the star that remained constant during epoch ’f’. However, poor phase coverage during the epochs ’f’, ’g’ and ’i’ does not allow us to follow this progress of spots properly. The activity level in our observation became very high during the epoch ’h’, where the amplitude of variation became 0.21 mag and appeared to remain the same during the epoch ’i’. Variable size of the spot (or a group of spots) are indicated by the variable depth of the light minimum in the light curves. The minimum of the light changed by 0.1 mag from epoch ’a’ to epoch ’h’ (see Table 2).
Comparing the light curves of FR Cnc from epoch ’a’ to epoch ’i’, a shift in the phase of the minimum and a variable amplitude is quite evident. Such cycle-to-cycle variation of both the amplitude and phase of the minimum has been seen for some rapidly rotating stars like LO Peg (Dal & Tas 2003), Speedy Mic (Barnes et al. 2001), AB Dor (Bos 1994; Donati & Collier Cameron 1997) and PZ Tel (Innis et al. 1990).
Variation in the color of the star is correlated with its magnitude i.e. the star becomes redder when fainter, and bluer when brighter, supporting the starspot hypothesis. The significance of correlation has been calculated by determining the linear correlation coefficient, r, between the magnitude and the colors. The value of r between V and (B-V), V and (V-R) and (B-V) and (V-R) was found to be 0.11, 0.35 and 0.581 with corresponding probability of no correlation being 0.00181, and 0, respectively.
4.1.1 Phase of the light minimum
The phase minimum of light () for the nine light curves in V band were plotted against the mean epoch listed in Table 2 and shown in left panel of Figure 4. To illustrate the spot motions over several longitudinal cycles, we define the longitude as longitude + n*360°or ( + n*1), where n is the cycle number. The phases of the light minima directly indicate the mean longitude of the dominant groups of the spots. The presence of two spots is clearly established by two well separated straight lines. Both the spots are closer to each other during the epoch ’g’, with a longitudinal separation of . Both the spots are visible during all the epochs, except during the epoch ’c’. Poor phase coverage during the epoch ’f’ could not establish the presence of the second spot. It is interesting to see the variable separation of the two spots. This could be due to the different latitudinal positions of the two spots and the presence of differential rotation in the star. Due to differential rotation, spots at different latitudes would give rise to a different migration rate for associated (Raveendran & Mohin 1995).
The following relation was fitted to the data by the method of the least squares:
| (1) |
where is the angular velocity of the spot or the rate of phase shift (degrees/day), P is the corresponding period in days, t is time in days, is reference time, and is the reference spot longitude in degree. Applying the above relation, the rate of phase shift for the spots A and B are determined as degree/day and degree/day, respectively. The corresponding migration period for the spot A and B are found to be years and years, respectively. These migration periods, being so close to each other, indicate that the spots that are located at different longitudes rotate with almost the same angular velocity. It thus appears that the observed phase minima of FR Cnc are well arranged in two permanent strips with approximately the same slope (i.e. same migration period), which can be interpreted as two long-lived active longitudes.
4.2 HD 95559
Stars HD 95467 and BD +33°2294 were observed for the differential photometry of the program star HD 95559. The data were folded using the following ephemeris for HD 95559:
JD = 2450359.094 + 1.52599775E,
where the epoch corresponds to a time when the more massive star is in front of the less massive star and period is spectroscopic orbital period (Fekel & Henry 2000). Variation in the B V R magnitude and colors of the program star with respect to the comparison star are shown in Fig. 5a and 5b. The nightly mean of of the different measures of comparison and check stars was determined 0.006 in each B and V filter, and 0.007 in R filter. The comparison star was constant during the observations as shown in the bottom panel of Figure 5a and 5b. We have divided our observations into two epochs, namely, epoch ’a’ ( 2001 February 3-5) and epoch ’b’ (2001 March 31 - April 7). The amplitude and the phase of the minima with the mean epoch of the observations of this star are shown in Table 2.
It is interesting to examine the light curves of HD 95559 during the observing season 2001. During the epoch ’a’ the light curve has a flat topped maximum and only one minimum (Fig. 5a). During the epoch ’b’ that flat topped maximum developed into a minimum at a phase = 0.5. At the same time, the amplitude of the variation increased by 0.025 mag. The position of the minimum during the epoch ’a’ however, did not change from the phase 0.0. This directly indicates the formation of a new group of spots at phase 0.5. Light curves of HD 95559 during the observing season 1995-1997 had only one minimum and a sharp maximum (Fekel & Henry 2000).
It appears that the colors remain nearly constant during our observations in HD 95559. A larger amount of scatter is, however, seen during the epoch ’b’. This may be due to the formation of the new group of spots on the surface of the active star. The lack of brightness-color relation may be due to the presence of bright facular or plages like regions accompanied by dark spots in any one or both components of this binary system.
4.3 LO Peg
Photometric data of LO Peg were folded using the following ephemeris as given by Dal & Tas (2003):
HJD = .
The folded light curves are shown in Figure 6. The observations separated by a year were divided into two different epochs namely ’a’ and ’b’. The epoch ’a’ has observations from 2001 September 28 to October 15, and epoch ’b’ has the observations from 2002 September 28 to October 3. The ’b’ epoch observations partly coincide with one set of observations (2002 October 1-31) of Dal & Tas (2003). Table 2 shows the parameters determined from the light curves of the LO Peg. Phase minimum computed from our photometry at epoch ’b’ differs by 0.26 from that of Dal & Tas (2003) photometry. This may be due to the larger span of their observations, as phase mimimum changed significantly within a couple of rotational periods, probably as a result of change in the spot configuration. As in the case of FR Cnc no two light curves of LO Peg are similar in shape, size and amplitude, which is seen quite commonly in the BY Dra type of star.
A plot of the phase minima as a function of the mean epoch of the observations of LO Peg is shown in the right panel of Fig. 4. The solid circles represent the observations made by Dal & Tas (2003) and the solid triangles represent our observations. Two large groups of spots are clearly seen. We have fitted the eq. (1) by the linear least squares deviation method for the group of spots A and computed the rate of phase shift. The open circle in the right panel of Fig. 4 was not used in the fitting. The rate of the phase shift for the group of spots A was determined degree/day. The corresponding migration period is years.
From Fig. 6, it is clear that the color curves are strongly correlated with light curves, i.e. bluer at light maximum and redder at light minimum. This indicate that the variability is due to the dark spots present on the surface of the star.
We have also checked whether the comparison star (BD +22°4405) is variable or not. Star USNO-B1.0 1133-0542608 was used as a check star. The was computed between the different measures of comparison and check stars. Nightly mean of the was 0.010, 0.009 and 0.007 in B, V, and R filter, respectively. Lower panels of Fig. 6a and 6b show the plot of different measures of comparison and check stars and indicate that the comparison stars were indeed constant during the observations.
5 Chromospheric emission lines of FR Cnc
In late type dwarfs, emission is a good indicator of chromospheric activity. It has been suggested that the detection of emission above the continuum or even a filled-in emission is sufficient to indicate that K - M dwarf is a BY Dra variable (Bopp et al. 1981). Spectrum of FR Cnc in the region is shown in Figure 7. Spectrum of the star HD 26794 (V = 8.81 mag and Spectral type - K3V) is also shown in Fig. 7 for comparison. is in emission at all phases in FR Cnc. The measured equivalent width of the emission feature and the corresponding JD and phase of FR Cnc are listed in Table 3. The phase is determined using the photometric period of and an epoch of JD 2451943.1980 for phase 0. The equivalent width is seen to vary from 1.2 to 1.8 . Such a significant change in the profiles and the equivalent width on a time scale as short as few hours has also been reported for the active K5 V star LO Peg (Jeffries et al. 1994).
emission in late type stars is another indicator of enhanced chromospheric activity. Figure 8 shows the spectra of FR Cnc and the comparison star HD 26794 in the region. is seen clearly in emission, while it is in absorption in the comparison star. The ratio of excess emission with the correction given by Hall & Ramcey (1992) was also calculated for FR Cnc as
This yields a value of 5.34 for the mean values of the equivalent widths of and . According to Hall & Ramcey (1992), values of are indicative of the line emission likely arising from an extended region viewed off the limb, perhaps a stellar ‘prominence’.
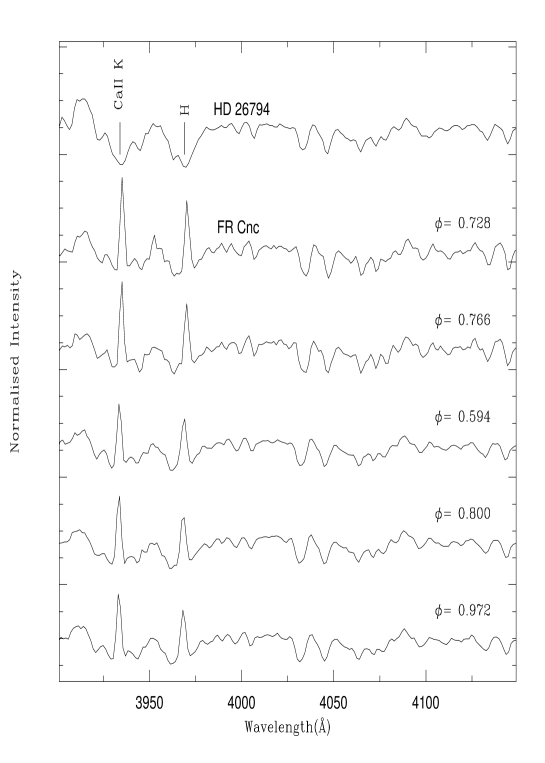
Figure 9 shows a comparison of spectrum of FR Cnc with that of HD 26794 in the region near the Ca II H and K lines. One can see that these lines have strong central emission components in the spectra of FR Cnc due to its active chromosphere. The spectrum of the Ca II H and K region taken on 15 November 2002 (0.72 and 0.76) was obtained close to the photometric epoch ’e’. The photometric light minima during this epoch are at phase of 0.44 and 0.75. The equivalent widths of the Ca II H and K lines in the 15 November 2002 spectra were found to be at a maximum during the photometric light minimum. Such a correlation is seen quite commonly among chromospherically active stars and is typically interpreted as evidence that, as in the solar case, the plage regions responsible for the Ca II emission are adjacent to the spotted regions responsible for the photometric modulation.
The equivalent widths of the and Ca II H and K lines in FR Cnc are in the range of 1.2 to 1.8 Å and 4.2 to 6.4 Å, respectively. This is similar to the equivalent width found in most BY Dra type stars (e.g., see Bopp 1987).
6 X-ray Spectra
The X-ray spectra of HD 95559 and LO Peg are shown in the right panel and the left panel of Figure 10, respectively. We created response matrices based on the available off axis calibration of the PSPC and using the appropriate ancillary response files. We used the xspec (version 11.2) spectral analysis package to fit the data with spectral model for thermal equilibrium plasma known as the Mewe-Kaastra-Liedahl or MEKAL model (Liedahl, Ostreheld & Goldstein 1995; Mewe, Kaastra & Liedahl 1995). The background subtracted X-ray spectra were fitted with 1T and 2T plasma models assuming the solar photospheric abundances given in Anders & Grevesse (1989) and allowing the abundance of every element other than H to vary by a common factor relative to their solar (photospheric) values. In each of the above models we assumed that interstellar absorption follows the absorption cross-sections given by Morrison & McCammon (1983) and we allowed the total intervening hydrogen column density to vary freely. We have also fitted the X-ray spectra with 1T and 2T collisional plasma model apec (Smith et al. 2001). The fitted parameters using these models were similar to those determined using the MEKAL model. For the star LO Peg there were two datasets corresponding to two observations. The spectrum was accumulated from each dataset and fitted using the above mentioned model individually as well as jointly. The best fit parameters were determined using the minimization technique. These parameters were found to be similar in either case. Table 4 summarizes the best fit values obtained for the various parameters along with minimum (= degrees of freedom), and the 90% confidence error bars estimated from minimum .
Single-temperature MEKAL models with abundances fixed to the solar values gave an unacceptably high value of for the both the stars – HD 95559 and LO Peg. However, single-temperature MEKAL models with abundances times the solar abundances and with plasma temperatures in the range of 0.63-0.77 keV were found acceptable for the star HD 95559, but not for LO Peg. Two-temperature plasma models with the abundances fixed to the solar value were not found to be acceptable for both the stars. Acceptable MEKAL 2T fits were achieved when the abundances were allowed to depart from the solar values for both the stars. The best fit two-temperature plasma models with sub-solar abundances along with the significance of the residuals in terms of their ratio for both the stars HD 95559 and LO Peg are shown in the left and the right panels of the Fig. 10. For HD 95559 an acceptable fit was obtained for abundances that were only times the solar values and with plasma components at temperatures of 0.45 keV and 1.27 keV. In the case of LO Peg the best fit plasma temperatures were keV and keV, with abundances that were only times the solar values for both the plasma components.
7 X-ray and radio properties: comparison with similar systems
A sample of 35 BY Dra systems were studied spectroscopically with ROSAT by Dempsey et al. (1997) assuming that their coronae had solar abundances. The average value of the low temperature () and the high temperature () components for these BY Dra systems are keV and keV, respectively. The value of the derived using sub-solar abundances for both the stars HD 95559 and LO Peg (see Table 4) is found to be more than the mean value of the BY Dra systems. Please note that the value of derived using the solar abundances (see Table 4) is found to be consistent to that of the average value for the other BY Dra systems in Dempsey et al. (1997). However, 2T plasma model using the solar abundances failed to fit the data with high signal-to-noise ratio and gave an unacceptable high value of for both of the stars. The values of are, however, consistent with that of the other BY Dra systems. The average volume emission measures and for the BY Dra systems in Dempsey et al. (1997) are and cm-3, respectively. The volume emission measure for the star HD 95559 is found to be times more than the average value of BY Dra systems. However, the value of for LO Peg is consistent with that of the BY Dra systems. The value of of the star HD 95559 using sub-solar abundances is consistent with those of the other BY Dra systems. However, the value of for LO Peg is times less than the average value of the other BY Dra systems.
X-ray flux measurements exist for a sample of 248 chromospherically active binary systems (CABS, Strassmeier et al. 1993). On the basis of Simbad222The SIMBAD database is operated at CDS, Strasbourg, France spectral classification and the catalogue of CABS we have divided the sample into 101 dwarfs, 65 subgiants, and 82 giants and computed the average X-ray luminosity. For the sample of 101 dwarfs the average and the median X-ray luminosity () are and erg s-1, respectively. The inferred for HD 95559, LO Peg and FR Cnc are 30.3, 29.7, and , where is in units of erg s-1, respectively, which are all close to the average value for active dwarf systems. The average and median X-ray luminosity for the 65 subgiants and, the 82 giants active systems are found to be and 30.83; and 30.8 erg s-1, respectively. This indicates that the evolved systems (subgiants and giants) are more X-ray luminous than the dwarf systems, as expected since these stars have larger surface areas from which to radiate X-rays. Radio flux measurements exist for a sample of 226 CABS (82 dwarfs, 64 subgiants and 80 giants). The average and median for a sample of 82 dwarfs are and 14.9 erg s-1 Hz-1, respectively. LO Peg has been detected as a radio source of (Condon et al. 1998). However, FR Cnc and HD 95559 do not have any radio observations. Using a distance of 25.1 pc, the radio luminosity () of LO Peg is found to be , which is again close to the typical value for BY Dra type.
8 Spectral Type, Temperature and Other Physical Parameters
The value of the total Galactic reddening in the direction of FR Cnc is estimated from Schlegel et al. (1998) to be 0.03 mag. However, given that the Hipparcos parallax of this star implies a distance of only 33 parsec, it is likely that its light suffers little if any reddening, and for the remaining discussion, we assume mag. Using the Hipparcos parallax of mas and the value of mag from our photometry, the absolute magnitude of FR Cnc is 7.64 mag. (The Hipparcos V-band measurements and the V magnitude of Weis (1993) lead to similar values for mag and mag, respectively). This value is consistent with a luminosity class V for this star. The color of FR Cnc derived from our photometry is , compared to a redder, but much lower precision, value of given in the Hipparcos Catalogue. The 1.11 value of is best matched with a spectral class of K5 V. While this is three subclasses earlier than the spectral class (K8) given in the Hipparcos Catalogue, the latter appears to be derived from a fairly crude spectral classification by Vyssotsky (1956) and thus the difference is likely not significant.
We have determined the spectral energy distribution (SED) of FR Cnc, HD 95559 and LO Peg using broad band UBVRI (present photometry and literature) and 2MASS JHK (Cutri et al. 2003) fluxes. We have assumed negligible reddening for each stars. The observed SED of FR Cnc, HD 95559 and LO Peg are shown along with the synthetic SEDs (Kurucz 1993). The synthetic SEDs are predicted from the intrinsic properties of the stars. The model SEDs are shown in Figure 11.
The values of and log g which best match to the observed SED are K and , respectively, and are consistent with the previously inferred K5 V spectral type for FR Cnc. The SED of HD 95559 (solid squares) is well matched with the synthetic SED for K1V type star. This indicates that HD 95559 is a K1V type star as concluded by Fekel & Henry (2000). The SED of the star LO Peg is represented by solid triangles. Observations of the star LO Peg by Jeffries et al. (1994) showed it to be a single K5-K7 dwarf, while Bowyer et al. (1996) had reported it to be a K8 type star. From the present photometry the absolute magnitude () and color (B-V = 1.04) of the star LO Peg are consistent with the spectral type of K3V. It is also clear from the Fig. 11 that the synthetic SED of K3V ( = ;log g = 4.5) type star is well matched with the SED of the LO Peg.
Using the Hipparcos parallax, the inferred and log g values, and various relations given in Landolt-Borstein (Schaifers & Voigt 1982) we have determined values of for FR Cnc, HD 95559 and LO Peg. These well-determined parameters along with the are given in Table 5.
9 2MASS JHK Photometry of FR Cnc, HD 95559 and LO Peg
One of the most remarkable properties sometimes attributed to chromospherically active stars is the evidence of infrared (IR) excesses, which is related to the properties of diffuse circumstellar matter (Scaltriti et al. 1993). Assuming negligible reddening and the 2MASS JHK magnitudes (Cutri et al 2003), we have determined the intrinsic and for FR Cnc, HD 95559 and LO Peg. The intrinsic and colors are 0.77 mag and 0.16 mag for a K5V type star and 0.54 mag and 0.11 mag for K1V type star (Koornneef 1983).
The intrinsic (J-K)0 and (H-K)0 colors of FR Cnc are mag and mag imply a color excess of mag and mag in (J-K) and (H-K) color, respectively. The intrinsic and colors of HD 95559 give the color excess in each (J-K) and (H-K) color. Assuming LO Peg as a K3V spectral type star and and . The color excess in LO Peg is mag and mag, respectively.
The values of the color excess for each stars are consistent with zero to within the uncertainties, indicating that all these three stars have no significant color excess in the JHK bands, which is also supported from the matching of the model SEDs as shown in Fig. 11.
10 Kinematics
We have computed the galactic space velocity components (U, V, W) for the star FR Cnc from the proper motion and parallax measured by the Hipparcos and the radial velocities measured by Upgren, Sperauskas & Boyle (2001) as listed in Table 5. The resulting values and their associated errors are given in Table 6.
FR Cnc, HD 95559 and LO Peg are inside the boundaries for the young disk population in the (U,V) and (W,V) diagrams (Montes et al. 2001). The (U,V,W) components of FR Cnc are close to that of the IC 2391 supercluster (-20.6, -15.7, -9.1) which is estimated to have an age of 35 to 55 Myrs, and for which several dozen possible late-type members have been previously identified. The star LO Peg has also been identified as a young star previously: as either a member of the 100 Myrs old Local Association (Montes et al. 2001) or of the 50 Myr old AB Dor moving group (Zuckerman, Song & Bessel 2004). We have also calculated the UVW component for the star HD 95559 using the radial velocity km s-1 (Fekel & Henry 2000) and the parallax and proper motion given in the Hipparcos Catalogue. The UVW components of this star (see Table 6) indicate that it is possible member of the 600 Myr Hyades supercluster, although as already noted its strong Li I absorption lines are more consistent with a Pleiades-type age of 100 Myrs.
11 Summary and Conclusions
The shape and amplitude of the photometric light curves of FR Cnc, HD 95559 and LO Peg are observed to be changing from one epoch to another. The change in the amplitude is mainly due to a change in the minimum of the light curve, and this may be due to a change in the spot coverage. This indicates the BY Dra type of variability in these dwarf systems. In such late-type of dwarfs, convection and rapid rotation generate a dynamo, resulting starspots activity. Two groups of spots are identified for FR Cnc and LO Peg. The spots are found to migrate, and migration periods of 0.97 year and 0.93 year are determined from the 4 years of data. A migration period of 1.12 years for one group of spots in LO Peg is also determined. A new group of spots formation in the star HD 95559 was seen during our observations. We determine the spectral types of FR Cnc and LO Peg to be K5V and K3V type, respectively.
Long term optical photometry of the star FR Cnc firmly establishes the rotation period of the star to be . Variable , and Ca II H and K emissions in the spectra of the FR Cnc indicate the presence of a heated atmosphere outside the photosphere. The chromospheric line emission seems to correlate with the photometric light curve, i.e. maximum at the light curve minimum, or minimum at the light curve maximum. The excess emission line ratio of FR Cnc implies that this emission likely arises from an extended region rather than from plage or prominences. The X-ray spectral parameters of HD 95559 and LO Peg are found to be consistent with that of other BY Dra type systems.
The bulk of the optical, X-ray and kinematical data indicate that these three stars are all active, young stars of 100 Myrs or less, whose high activity levels are primarily due to their youth. HD 95559 is particularly interesting in that it is both young and a synchronized close binary system, whose current rapid rotation is expected to persist for many Gyrs, and it is remarkably similar to another young synchronized binary system V824 Ara HD 155555 (see, e.g., Strassmeier & Rice 2000). We believe that this study has reconfirmed that selecting stars by their high X-ray to optical flux ratios is an efficient way to identify young active stars in the solar neighborhood.
References
- (1) Anders, E., & Grevesse, N. 1989, Geochim. Cosmochim. Acta, 53, 197
- (2) Ayres, T. R., et al. 1995, ApJS, 96, 223
- (3) Bailer-Jones, C. A. L., & Mundt, R. 2001, A&A, 367, 218
- (4) Barnes, J. R., Collier Cameron, A., James, D. J., & Steeghs, D. 2001, MNRAS, 326, 1057
- (5) Bopp, B. W. 1987, ApJ, 317, 781
- (6) Bopp, B. W., & Fekel, F. Jr. 1977, AJ, 82, 490
- (7) Bopp, B. W., Noah, P. V., Klimke, A., & Africano, J. 1981, ApJ, 249, 210
- (8) Bopp, B.W., & Stencel, R.E. 1981, ApJ, 247, L131
- (9) Bos, M. 1994, IBVS, No. 4111
- (10) Bowyer, S., Lampton, M., Lewis, J., Wu, X., Jelinsky, P., & Malina, R. F. 1996, ApJS, 102, 129
- (11) Caillault, J. -P., Drake, S. A., & Florkowski, D. R. 1988, AJ, 95, 887
- (12) Condon, J. J., Cotton, W. D., Greisen, E. W., Yin, Q. F., Perley, R. A., Taylor, G. B., & Broderick J. J. 1998, AJ, 115, 1693
- (13) Cutri, R. M., et al. 2003, 2MASS All-Sky Catalogue of Point Sources, VizieR On-line Data Catalogue II/246
- (14) Dal, H. A., & Tas, G. 2003, IBVS No. 5390
- (15) Dempsey, R. C., Linsky, J. L., Schmitt, J. H. M. M., & Fleming, T. A. 1993, ApJ, 413, 333
- (16) Dempsey, R. C., Linsky, J. L., Fleming, T. A., & Schmitt, J. H. M. M. 1997, ApJ, 478, 358
- (17) Donati, J. -F., & Collier Cameron, A. 1997, MNRAS, 291, 1
- (18) Drake, S. A., Simon, T., & Linsky, J. L. 1989, ApJS, 71, 905
- (19) Drake, S. A., Simon, T., & Linsky, J. L. 1992, ApJS, 82, 31
- (20) Eibe, M. T., Byrne, P. B., Jeffries, R. D., & Gunn, A. G. 1999, A&A, 341, 527
- (21) Elvis, M., Plummer, D., Schachter, J., & Fabbiano, G. 1992, ApJS, 80, 257
- (22) Fekel, F. C., & Henry, G. W. 2000, AJ, 120, 3265
- (23) Fekel, F. C., Moffett, T. J., & Henry, G. W. 1986, ApJS, 60, 551
- (24) Glebocki, R., & Stawikowski, A. 1997, A&A, 328, 579
- (25) Güdel, M., Schmitt, J. H. M. M., Bookbinder, J. A., & Fleming, T. A. 1993, ApJ, 415, 236
- (26) Hall, D. S. 1976, multi periodic variable star, Fitch, W.S. (ed.), Reidel Academic Publishers, Dordretch, 387
- (27) Hall, J. C., & Ramcey, L. W. 1992, AJ, 104, 1942
- (28) Innis, J. L., Coates, D. W., Thompson, K., & Lloyd Evans. T. 1990, MNRAS, 242, 306
- (29) Jeffries, R. D., & Jewell, S. J. 1993, MNRAS, 264, 106.
- (30) Jeffries, R. D., Bertram, D., & Spurgeon, B. R. 1994, IBVS No. 4091
- (31) Jeffries, R. D., Byrne, P. B., Doyle, J. G., Anders, G. J., James, D. J., & Lanzafame, A. C. 1994, MNRAS, 270, 153
- (32) Kazarovets, A. V., et al. 1999, IBVS No. 4659
- (33) Koornneef, J. 1983, A&A, 128, 84
- (34) Kurucz, R. L. 1993, private communication
- (35) Landolt, A. U. 1992, AJ, 104, 340
- (36) Liedahl, D. A., Osterheld, A. L., & Goldstein, W. H. 1995, ApJ, 438, L115
- (37) Mewe, R., Kaastra, J. S., & Liedahl, D. A. 1995, Legacy, 6, 16
- (38) Montes, D., et al. 2001, MNRAS, 328, 45
- (39) Morris, D. H., & Mutel, R. L. 1988, AJ, 95, 204
- (40) Morrison, R., & McCammon, D. 1983, ApJ, 270, 119
- (41) Padmakar, Singh, K. P., Drake, S. A., & Pandey, S. K. 2000, MNRAS, 314, 733
- (42) Pandey, J. C., Singh, K. P., Sagar, R., & Drake, S. A. 2002, IBVS No. 5351
- (43) Perryman, M. A. C., et al. 1997, A&A, 323, L49
- (44) Pfeffermann, E., et al. 1987, in Soft X-ray Optics and Technology, Proc. SPIE, 733,519
- (45) Raveendran, A. V., & Mohin, S. 1995, A&A, 301, 788
- (46) Robb, R. M., & Cardinal, R. D. 1995, IBVS No. 4221
- (47) Roberts, D. H., Lehar, J., & Dreher, J. W. 1987, AJ, 93, 968
- (48) Schaifers, K., & Voigt, H. H. Landolt-Bornstein, Numerical Data and Functional Relationship in Science and Technology, New series, Group VI, Vol. 2b, Springer - Verlag, Berlin
- (49) Schachter, J. F., Remillard, R., Saar, S. H., Favata, F., Sciortino, S., & Barbera, M. 1996, ApJ., 463, 747
- (50) Scaltriti, F., et al. 1993, MNRAS, 264, 5
- (51) Schlegel, D. J., Finkbeiner, D. P., & Davis, M. 1998, ApJ, 500, 525
- (52) Smith, R. K., Brickhouse, N. S., Liedahl, D. A., & Raymond, J. C. 2001, ApJ, 556, L91.
- (53) Strassmeier, K. G., & Rice, J. B. 2000, A&A, 360, 1019.
- (54) Strassmeier, K. G., Hall, D. S., Fekel, F. C., & Scheck, M. 1993, A&AS, 100, 173
- (55) Strassmeier, K. G., Washuettl, A., Granzer, T., Scheck, M., & Weber, M. 2000, A&AS, 142, 275
- (56) Trümper, R. A. 1983, Adv. Space Res, 2, 241.
- (57) Upgren, A. R., Sperauskas, J., & Boyle, R. P. 2002, Balt. Astron., 11, 91
- (58) Voges, W., et al. 1999, A&A, 349, 389
- (59) Vyssotsky, A. N. 1956, AJ, 61, 201
- (60) Weis, E. W. 1993, AJ, 105, 1962
- (61) Zuckerman, B., Song, I., & Bessel, M. S. 2004, ApJ, 613, L65
| Object | Nights | Duration of | Instrument | Telescope | |
|---|---|---|---|---|---|
| observations | |||||
| Optical Photometry | |||||
| FR Cnc | 43 | 2001 Feb. - 2003 Jan. | CCD | SNT | |
| FR Cnc | 10 | 2003 Dec. - 2004 Jan. | CCD | SNT | |
| FR Cnc | 70* | 1990 Mar. - 1992 Nov. | Hipparcos | Satellite | |
| HD 95559 | 11 | 2001 Feb. - 2001 Apr | CCD | SNT | |
| LO Peg | 7 | 2001 Oct. - 2002 Oct. | CCD | SNT | |
| Optical Spectroscopy | |||||
| FR Cnc | 1 | 2002 Nov. 15 | OMR spectrograph | VBT | |
| (CCD) | |||||
| FR Cnc | 5 | 2003 Jan. 20 - 24 | ” | VBT | |
| X-ray observations from ROSAT | |||||
| Source | Observation | Duration of | exposure | Count rate | offset |
| ID | observations | (sec) | (cts/sec) | (arcmin) | |
| HD 95559 | rp200987n00 | 1993 June 2 - 9 | 4874 | 38.4 | |
| LO Peg | rp201753n00 | 1993 Nov. 11 - 13 | 5968 | 0.31 | |
| LO Peg | rp201753a01 | 1993 Dec. 7 - 8 | 14012 | 0.31 | |
| Mean epoch | Amplitude | phase minima | |||
|---|---|---|---|---|---|
| 240000.0+ | I | II | |||
| FR Cnc | |||||
| (a) 51984.75 | 0.106 | -0.716 | -0.610 | 0.33 | 0.75 |
| (b) 52245.50 | 0.063 | -0.670 | -0.607 | 0.29 | 0.66 |
| (c) 52267.00 | 0.108 | -0.683 | -0.575 | 0.27 | - |
| (d) 52308.75 | 0.100 | -0.697 | -0.597 | 0.23 | 0.58 |
| (e) 52598.00 | 0.153 | -0.725 | -0.572 | 0.44 | 0.75 |
| (f) 52626.25 | 0.158* | -0.738 | -0.580 | - | - |
| (g) 52643.75 | 0.128* | -0.728 | -0.600 | 0.39 | 0.62 |
| (h) 52992.00 | 0.210 | -0.721 | -0.511 | 0.25 | 0.54 |
| (i) 53022.25 | 0.181* | -0.736 | -0.555 | 0.21 | 0.53 |
| HD 95559 | |||||
| (a) 51945.40 | 0.051 | -0.435 | -0.384 | 0.00 | - |
| (b) 52003.80 | 0.076 | -0.481 | -0.405 | 0.00 | 0.53 |
| LO Peg | |||||
| (a) 52190.80 | 0.081 | -0.483 | -0.402 | 0.50 | - |
| (b) 52548.00 | 0.050 | -0.495 | -0.445 | 0.66 | - |
| JD | Phase | EWs () | |||
|---|---|---|---|---|---|
| 240000+ | |||||
| 52594.400 | 0.73 | 6.45 | 5.70 | - | - |
| 52594.431 | 0.77 | 5.39 | 4.58 | - | - |
| 52660.197 | 0.32 | - | - | 1.51 | - |
| 52660.220 | 0.35 | - | - | 1.21 | - |
| 52660.463 | 0.64 | - | - | - | 0.40 |
| 52660.486 | 0.67 | - | - | - | 0.33 |
| 52661.204 | 0.54 | - | - | 1.498 | - |
| 52661.251 | 0.59 | 5.19 | 4.59 | - | - |
| 52661.417 | 0.79 | - | - | 1.32 | - |
| 52661.446 | 0.83 | - | - | - | 0.36 |
| 52662.199 | 0.74 | - | - | 1.82 | - |
| 52662.248 | 0.80 | 5.06 | 4.86 | - | - |
| 52662.379 | 0.96 | - | - | 1.39 | - |
| 52662.452 | 0.05 | - | - | - | 0.40 |
| 52663.168 | 0.91 | - | - | 1.55 | - |
| 52663.217 | 0.97 | 5.67 | 4.22 | - | - |
| 52663.247 | 0.01 | - | - | 1.36 | - |
| 52663.371 | 0.16 | - | - | 1.64 | - |
| 52663.422 | 0.22 | - | - | - | 0.31 |
| 52664.253 | 0.23 | - | - | 1.62 | - |
| 52664.508 | 0.53 | - | - | - | 0.31 |
| Object | Model | Abundancesa | DOF | ||||||
|---|---|---|---|---|---|---|---|---|---|
| (keV) | (keV) | ||||||||
| HD 95559 | MEKAL 1T | 1.0(fixed) | 0.00 | 0.31 | 5.7 | - | - | 28.3 | 10 |
| MEKAL 1T | - | - | 1.7 | 9 | |||||
| MEKAL 2T | 1.0(fixed) | 0.00 | 0.26 | 4.1 | 1.16 | 5.8 | 2.5 | 8 | |
| MEKAL 2T | 1.6 | 7 | |||||||
| LO Peg | MEKAL 1T | 1.0(fixed) | 0.00 | 0.31 | 1.6 | - | - | 37.7 | 23 |
| MEKAL 1T | 0.01 | 0.5 | 0.58 | 7.6 | - | - | 2.0 | 22 | |
| MEKAL 2T | 1.0(fixed) | 1.8 | 21 | ||||||
| MEKAL 2T | 1.3 | 20 |
| Parameter | FR Cnc | HD 95559∗ | LO Peg |
|---|---|---|---|
| Sp. Type | K5V | K1V | K3V |
| (mag) | |||
| (mag) | |||
| () | |||
| log g | |||
| (mas/y) | |||
| (mas/y) | |||
| (mas) | |||
| (km/s) | |||
| FR Cnc | ||||
| HD 95559 | ||||
| 0.1 | ||||
| LO Peg | ||||
| 29.0 | ||||
![[Uncaptioned image]](/html/astro-ph/0506010/assets/x1.png)
![[Uncaptioned image]](/html/astro-ph/0506010/assets/x2.png)
![[Uncaptioned image]](/html/astro-ph/0506010/assets/x3.png)
![[Uncaptioned image]](/html/astro-ph/0506010/assets/x4.png)
![[Uncaptioned image]](/html/astro-ph/0506010/assets/x5.png)
![[Uncaptioned image]](/html/astro-ph/0506010/assets/x6.png)
![[Uncaptioned image]](/html/astro-ph/0506010/assets/x7.png)
![[Uncaptioned image]](/html/astro-ph/0506010/assets/x8.png)
![[Uncaptioned image]](/html/astro-ph/0506010/assets/x9.png)
![[Uncaptioned image]](/html/astro-ph/0506010/assets/x10.png)
Light curves and corresponding CLEANed power density spectra (insets) of FR Cnc at different epochs. The epoch is mentioned at the top of each panel, and the period is written at the top of inset. The bottom right panel (j) shows the Hipparcos light curve along with its power spectrum
 .
.
![[Uncaptioned image]](/html/astro-ph/0506010/assets/x12.png)
![[Uncaptioned image]](/html/astro-ph/0506010/assets/x13.png)
![[Uncaptioned image]](/html/astro-ph/0506010/assets/x14.png)
![[Uncaptioned image]](/html/astro-ph/0506010/assets/x15.png)
![[Uncaptioned image]](/html/astro-ph/0506010/assets/x16.png)
![[Uncaptioned image]](/html/astro-ph/0506010/assets/x17.png)
![[Uncaptioned image]](/html/astro-ph/0506010/assets/x18.png)
![[Uncaptioned image]](/html/astro-ph/0506010/assets/x19.png)
![[Uncaptioned image]](/html/astro-ph/0506010/assets/x20.png)
light curves and (B-V), (V-R) color curves of FR Cnc folded using a period of , and shown for nine different epochs. The epoch (JD=2400000.0+ is marked at the top of each panel. The bottom panel in each Figure represents the plot of different measures between the comparison (TYC 1392 2120 1 for Fig. a to g and BD +16°1751 for Fig h and i) and the check (USNO-A2.0 1050-05766589) star.


.