CONSTRAINTS FROM GALAXY-AGN CLUSTERING ON THE CORRELATION BETWEEN GALAXY AND BLACK HOLE MASS AT REDSHIFT 11affiliation: Based, in part, on data obtained at the W.M. Keck Observatory, which is operated as a scientific partnership between the California Institute of Technology, the University of California, and NASA, and was made possible by the generous financial support of the W.M. Keck Foundation.
Abstract
We use the clustering of galaxies around distant active-galactic nuclei (AGN) to derive an estimate of the relationship between galaxy and black hole mass that obtained during the ancient quasar epoch, at redshifts , when giant black holes accreted much of their mass. Neither the mean relationship nor its scatter differs significantly from what is observed in the local universe, at least over the ranges of apparent magnitude () and black-hole mass () that we are able to probe.
Subject headings:
galaxies: high-redshift — cosmology: large-scale structure of the universe — quasars: general1. INTRODUCTION AND RESULTS
The study of black holes has been driven to the forefront of extragalactic research by the recent discovery of black holes as massive as a billion suns inside nearby bulge galaxies. Simple physical arguments (e.g., Silk & Rees 1998) suggest that these enormous objects should profoundly affect the process of galaxy formation, a belief that is strengthened by the tight observed correlation between the masses of local galaxies and their black holes (Gebhardt et al. 2000; Ferrarese & Merritt 2000). Various theoretical models attempt to explain the existence of the correlation with a wide range of physical processes. Since these models make discordant predictions for the evolution of the correlation over time, we decided to test them by measuring the relationship between galaxy and black hole mass in the distant past, at redshifts .
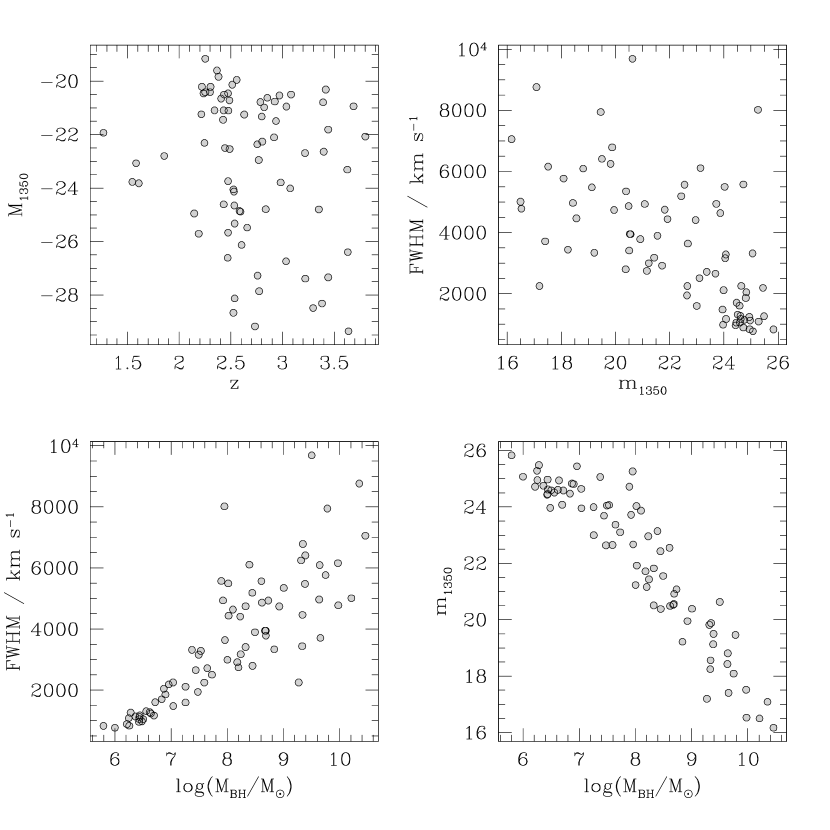
A novel approach (see, e.g., Kauffmann & Haehnelt 2002) let us use our existing surveys (Steidel et al. 2003; Steidel et al. 2004) of galaxies at redshifts to measure the dependence of galaxy mass on black hole mass over a 5-decade baseline of black hole mass, reaching masses roughly 1000 times smaller than the limits of other surveys (e.g., Shields et al. 2003; Walter et al. 2004; Croom et al. 2005) at similar redshifts. After using the technique of Vestergaard (2002) to estimate the masses of the black holes that powered each of the 79 active-galactic nuclei (AGN) in our survey (see figure 1 and the appendix), we estimated the typical halo mass for black holes in different mass ranges by measuring how strongly the other galaxies in our survey clustered around them.
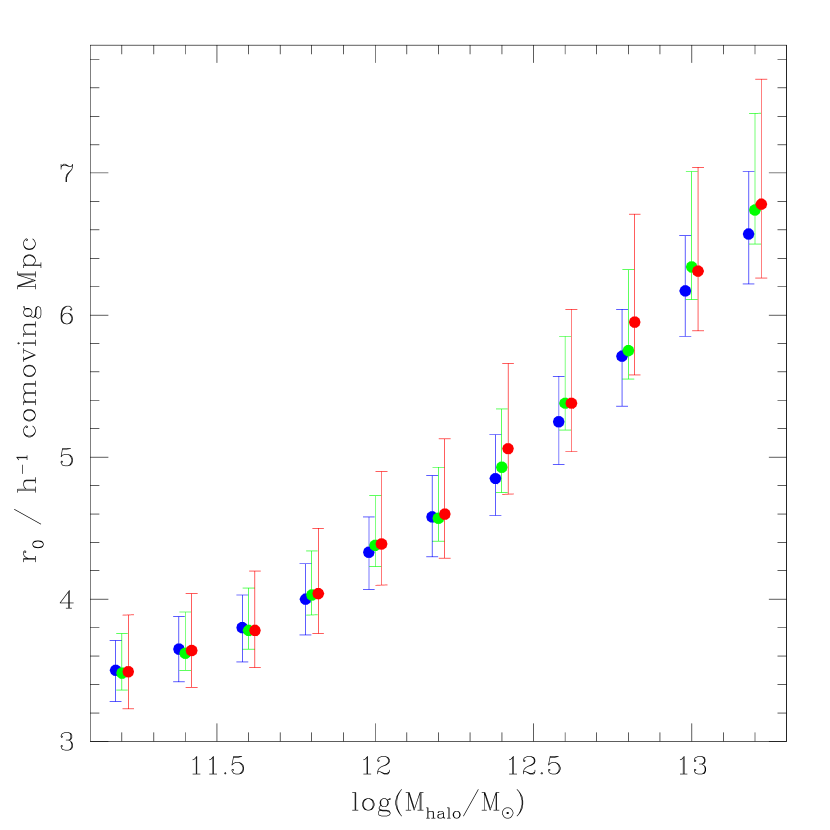
Adelberger & Steidel (2005) describe our analysis in more detail. Briefly, we estimated the cross-correlation length from the number of galaxy-AGN pairs with angular separation and comoving radial separation Mpc with the approach of Adelberger (2005), then used the GIF-LCDM numerical simulation (Kauffmann et al. 1999) of structure formation in a standard cosmological model to estimate from the total (dark matter plus baryon) mean mass of the galaxies associated with black holes in each mass range. The relationship between and depends on the redshift and on the mass of the typical (non-active) galaxies in our survey, but the resulting systematic errors in are small compared to the random errors (figure 2).
We found galaxy-AGN cross-correlation lengths of for the AGN with and for the with . The inferred relationship between and is shown in Figure 3.
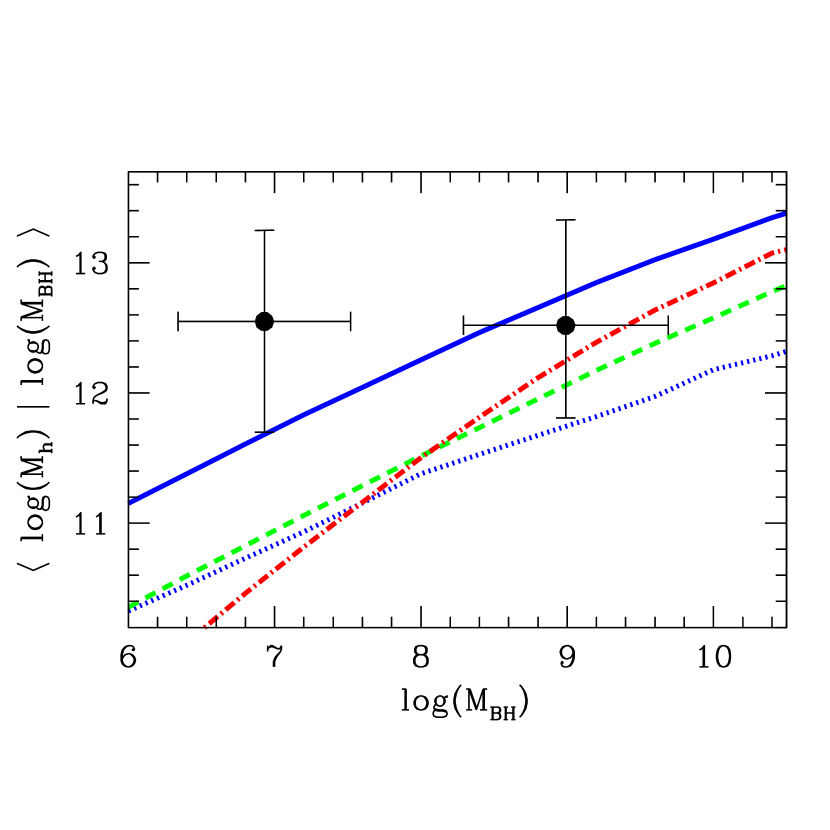
If the predicted relationship between galaxy and black-hole mass has the form , with a function to be specified and a random deviate, the expectation value of for a given value of follows from the elementary relationship
| (1) |
where , , is the distribution of measured in the GIF-LCDM simulation and extrapolated with the appropriate Press-Schechter (1974) formula, and is the distribution of at fixed galaxy mass, which depends on and on the characteristics of the random variable . Solving equation 1 numerically for different functions under the assumption that has a Normal distribution with rms , we find the theoretical tracks shown in Figure 3.
The solid blue line is for a – relationship identical to the one observed locally, (Ferrarese 2002). For this line we assumed , roughly the expected error in our black hole masses (Vestergaard 2002). The line therefore assumes negligible intrinsic scatter in the correlation. It fits the data well.
The other lines show that alternative relationships in the literature generally provide a worse fit. The green line results from scaling the ratio of black hole to galaxy mass by , as advocated by many semi-analytic models (e.g., Haehnelt, Natarajan, & Rees 1998; Wyithe & Loeb 2002; Volonteri, Haardt, & Madau 2003). The red line shows the redshift prediction of a model in which black holes accrete a fixed fraction of the total gas mass in each merger (Di Matteo et al. 2003). The dashed blue line assumes that the mean – relationship is the same as observed locally but that its intrinsic scatter has increased to dex. Increasing the scatter decreases the typical mass of galaxies that contain black holes of a given mass. This is because galaxies with low masses are much more common than galaxies with high masses; when the scatter in the – relationship is big, the largest black holes are more likely to reside in low mass galaxies with unusual ratios of than in high mass galaxies with normal ratios. The clustering of galaxies around AGN would therefore be far weaker than we observe if there were no relationship at all between and .
A test suggests that the three alternatives to the no-evolution model ( scaling, supply limited accretion, large ) disagree with the observations at the 90–95% level. They can therefore be considered marginally consistent with our present data, although the odds are against them and more extreme evolution from the local relationship (e.g., Haehnelt & Rees 1993) can be ruled out with high significance.
The apparent lack of evolution in the – correlation seems consistent with models in which the correlation results from active feedback from the black hole. In these models the black hole mass is pinned near the maximum allowed by its halo at all times. If this maximum is set by the escape velocity at a fixed proper radius from the black hole, it will not depend strongly on redshift. One might object that black holes are able to enter the quasar phase in these models only because their masses have temporarily fallen below the maximum allowed by their growing halos, and so the most luminous AGN should never lie on the correlation. As long as the quasar phase occurs near the end of the accretion, however (e.g., Hopkins et al. 2005), the black hole should have nearly achieved its equilibrium mass. In any case, a slight decrease in at fixed would make the predictions fit our data even better.
It is a pleasure to acknowledge several interesting conversations with L. Ho, L. Hernquist, L. Ferrarese, J. Kollmeier, and S. White. This work would not have been possible without the efforts of our collaborators D. Erb, M. Pettini, N. Reddy, & A. Shapley. Bob Becker, Richard White, and Michael Gregg generously shared their spectrum of FBQS0933+2845. KLA was supported by a fellowship from the Carnegie Institute of Washington; CCS was supported by grant AST 03-07263 from the National Science Foundation and by a grant from the Packard foundation. We are grateful that the people of Hawaii allow astronomers to build and operate telescopes on the summit of Mauna Kea.
Appendix A TECHNICAL DETAILS
The general population of galaxies tends to cluster more strongly around individual galaxies with larger masses. We exploit this effect to estimate the masses of the galaxies that harbor black holes. After estimating the characteristic mass of the general galaxy population from its measured correlation length (Adelberger et al. 2005), we use the GIF-LCDM simulation to calculate as a function of how strongly galaxies of mass cluster around galaxies of mass . We infer the masses of the galaxies that harbor various black holes by finding the value of required to match the observed cross-correlation length . Figure 2 shows the relationship we used to estimate from our measured cross-correlation length the typical mass of the galaxies containing the black holes (green points). Adopting other plausible relationships between and would change the inferred masses by less than their random uncertainties. Percival et al. (2003) and Kauffmann & Haehnelt (2002) have shown that halos undergoing mergers have the same correlation length on large scales as other halos of the same mass, so our estimates of should provide reasonable estimates of the halos masses even if AGN are fueled by mergers.
To estimate the random uncertainty in , we took a Monte-Carlo approach that exploited the similarity of the AGN-galaxy cross-correlation length to the galaxy-galaxy correlation length. We generated many alternate realizations of our data by treating randomly chosen galaxies in each field as that field’s AGN, rather than the true AGN themselves, and recalculated for each simulated sample. Since the galaxies in our survey outnumber the AGN by more than twenty to one, the simulated samples are nearly independent of each other and of the true sample. We took the rms spread in among them as the uncertainty in our measured measured correlation length . The distribution of for the predicted values of in figure 3 should be roughly equal to the distribution of in the simulated samples around the line , where is the galaxy-galaxy correlation length in our sample. We used this distribution to associate our measured values of with a -value.
Our conclusion depends on the assumption that the estimated black hole masses are not wildly inaccurate. We estimate from an AGN’s luminosity at Å and CIV line-width with the relationship that is observed in the local universe: (Vestergaard 2002). Correcting for a stellar contribution to the AGNs’ luminosities (which we have not done) would decrease our lowest observed values even further, strengthening our conclusions. Our estimated black-hole masses would be too low for some AGN with small if their observed CIV emission line were produced in the narrow-line region rather than the broad-line region (as we assume). In this case the line widths would be roughly equal to the galaxies’ stellar velocity dispersions (Nelson 2000), at least for radio-quiet AGN, but in fact the galaxies’ mean stellar velocity width ( km s-1) is an order of magnitude smaller than the mean AGN line-width for ( km s-1) or ( km s-1). It is far smaller than even the smallest observed AGN line-width in our sample, km s-1. Radio-loud AGN make up too small a fraction of our sample to affect our results if omitted. In any case, the observed range of is so large that our estimates of would have to be wrong by order of magnitude to alter our results significantly. We cannot rule out the idea that the relationship between , luminosity, and line-width was utterly different in the past, but it seems easier to believe that the relationship between and has not changed at all.
References
- (1)
- (2) Adelberger, K.L. & Steidel, C.C. 2005, ApJ, in press (astro-ph/0505210)
- (3) Adelberger, K.L. 2005, ApJ, 621, 574
- (4) Adelberger, K.L. et al. 2005, ApJ, 619, 697
- (5) Benson, A.J., Bower, R.G., Frenk, C.S., Lacey, C.G., Baugh, C.M., & Cole, S. 2003, ApJ, 599, 38
- (6) Croom, S.M. et al. 2005, MNRAS, 356, 415
- (7) Di Matteo, T., Springel, V. & Hernquist, L., 2005, Nature, 433, 604
- (8) Di Matteo, T., Croft, R.A.C., Springel, V., & Hernquist, L. 2003, ApJ, 593, 56
- (9) Ferrarese, L., Merritt, D. 2000, ApJ, 539, L1
- (10) Ferrarese, L. 2002, ApJ, 578, 90
- (11) Gebhardt, K., et al. 2000, ApJ, 539, L13
- (12) Haiman, Z. & Loeb, A. 1998, ApJ, 503, 505
- (13) Haehnelt, M.G. & Rees, M.J. 1993, MNRAS, 263, 168
- (14) Haehnelt, M.G., Natarajan, P., & Rees, M.J. 1998, MNRAS, 300, 817
- (15) Hopkins, P.F., Hernquist, L., Cox, T.J., Di Matteo, T., Martini, P., Robertson, B., & Springel, V. 2005, ApJ, submitted (astro-ph/0504190)
- (16) Kauffmann, G. & Haehnelt, M. 2002, MNRAS, 332, 529
- (17) Kauffmann, G., Colberg, J.M., Diafero, A., & White, S.D.M. 1999, MNRAS, 303, 188
- (18) Kormendy J., Richstone D., 1995, ARAA, 33, 581
- (19) Magorrian, J., et al., 1998, AJ, 115, 2285
- (20) Nelson, C. H. 2000, ApJ, 544, L91
- (21) Percival, W.J., Scott, D., Peacock, J.A., & Dunlop, J.S. 2003, MNRAS, 338, L31
- (22) Press, W.H. & Schechter, P. 1974, ApJ, 187, 425
- (23) Silk, J., Rees, M., 1998, A& A, 334, L1
- (24) Springel, V., Di Matteo, T., & Hernquist, L. 2005, ApJ, 620, L79
- (25) Steidel, C.C. et al. 2003, ApJ, 592, 728
- (26) Steidel, C.C. et al. 2004, ApJ, 604, 534
- (27) Shields, G.A. et al. 2003, ApJ, 583, 124
- (28) Vestergaard, M. 2002, ApJ, 571, 733
- (29) Volonteri, M., Haardt F., Madau, P. 2003, ApJ, 582, 559
- (30) Walter, F. et al. 2004, ApJ, 615, L17
- (31) Wyithe, J. S. B., Loeb, A. 2002, ApJ, 581, 886
- (32) Yu, Q., Tremaine, S. 2002, MNRAS, 335, 965