A large spin–up rate measured with INTEGRAL in the High Mass X–ray Binary Pulsar SAX J2103.5+4545
The High Mass X–ray Binary Pulsar SAX J2103.5+4545 has been observed with INTEGRAL several times during the last outburst in 2002–2004. We report a comprehensive study of all INTEGRAL observations, allowing a study of the pulse period evolution during the recent outburst. We measured a very rapid spin-up episode, lasting 130 days, which decreased the pulse period by 1.8 s. The spin-up rate, Ṗ10-7 s s-1, is the largest ever measured for SAX J2103.5+4545, and it is among the fastest for an accreting pulsar. The pulse profile shows evidence for temporal variability, apparently not related to the source flux or to the orbital phase. The X–ray spectrum is hard and there is significant emission up to 150 keV. A new derivation of the orbital period, based on RXTE data, is also reported.
Key Words.:
stars: individual: SAX J2103.5+4545 – X-rays: binaries – stars: neutron – Accretion, accretion disks1 Introduction
SAX J2103.54545 is a transient Be High Mass X-ray Binary (HMXRB) pulsar (pulse period 358 s) discovered with the Wide Field Cameras (WFC) on-board BeppoSAX during an outburst in February–September 1997 (Hulleman et al., 1998). A peak intensity of 20 mCrab was reached on 1997 April 11. The X–ray spectrum in the 2–25 keV energy band was fit by a power-law with a photon index =1.27 modified by photo electric absorption at lower energies (=3.11022 cm-2).
An orbital period of 12.68 days and an orbital eccentricity, , of 0.40.2 have been measured with the Rossi X-ray Timing Explorer (RXTE) during a second outburst lasting about 14 months observed in 1999 (Baykal et al., 2000).
The likely optical counterpart is a B0Ve star (V=14.2; Reig & Mavromatakis, 2003; Reig et al. 2004), making SAX J2103.5+4545 the Be/X-ray binary with the shortest orbital period known. SAX J2103.5+4545 does not follow the correlation found by Corbet (1986) between the orbital and spin periods in Be/X-ray binaries (which would imply an orbital period 190 days).
The absorption in the direction of the optical counterpart indicates a distance of 6.5 kpc (Reig et al., 2004), doubling the previous estimate of 3.2 kpc (Baykal et al., 2002) based on a model for the spin-up produced by accretion torques (Ghosh & Lamb, 1979).
A transition from the spin-up phase to the spin-down regime was observed with RXTE during the decline in the X-ray flux of the 1999 outburst (Baykal et al., 2002). During the initial part of the outburst the source exhibited a spin-up phase (the pulse period decreased by 0.9 s in 150 days), but when the flux dropped the pulse frequency saturated and, as the flux continued to decline, a weak spin-down phase started. This correlation between spin-up rate and X-ray flux indicates the formation of an accretion disk during the periastron passage. The X-ray spectrum, described by a power-law with a cut-off around 8 keV, displayed an iron emission line at 6.4 keV (Baykal et al., 2002).
During a XMM-Newton observation performed in January 2003, Inam et al. (2004), detected for the first time a soft blackbody component with a temperature of 1.9 keV and radius 0.3 km (assuming a 3.2 kpc distance), probably produced in the polar cap of the neutron star, as well as a transient quasi-periodic oscillation at 22.7 s. Besides the blackbody component, the 1–20 keV spectrum (using XMM–Newton and RXTE data) was fit with a power-law with a cut-off at 7.89 keV and an e-folding energy of 27.1 keV, together with an emission line at 6.42 keV. The equivalent width of this cold iron line was found to depend on the spin phase. Using RXTE data (MJD 52611.48 – MJD 52668.90), Inam et al. (2004) derived a pulse period of 354.7940 s (at the epoch of the XMM-Newton observation, MJD 52645.85) and a 57.5 days average spin-up rate of (7.4)10-13 Hz s-1.
Analyses of part of the INTEGRAL observations of the source have been reported by Lutovinov et al. (2003), Sidoli et al. (2004), Blay et al. (2004), Filippova et al. (2004) and Falanga et al. (2005). In this paper we report on the timing and spectral analysis of all INTEGRAL observations performed between December 2002 and July 2004.
2 Observations
The ESA INTEGRAL observatory, launched in October 2002, carries 3 co-aligned coded mask telescopes: the imager IBIS (Ubertini et al. 2003), which allows high-angular resolution imaging in the energy range 15 keV–10 MeV, the spectrometer SPI (Vedrenne et al. 2003; 20 keV–8 MeV) and the X-ray monitor JEM-X (Lund et al. 2003; 3–35 keV). IBIS is composed of a low-energy CdTe detector ISGRI (Lebrun et al. 2003), sensitive in the energy range from 15 keV to 1 MeV, and a CsI detector (PICsIT; Labanti et al. 2003), designed for optimal performance at 511 keV, and sensitive in the 175 keV–10 MeV energy range.
The INTEGRAL satellite performs regular scans of the Galactic Plane (GPS) every 12 days as part of the Core Programme to monitor the timing and spectral properties of known X–ray sources, discover new transient sources and map the diffuse emission from the Galactic plane (Winkler et al. 2003).
From December 2002 to July 2004, SAX J2103.5+4545 has been observed several times. Among these observations (170 pointings), some have been performed during the satellite performance and verification phase (December 2002), during the GPS (January 2003–July 2004), or during guest observer observations now in the public archive (May 2003). We have performed a comprehensive study of all these observations (see Table 1), concentrating in particular on the timing properties of SAX J2103.5+4545.
The data reduction has been performed using the OSA 4.2 release of the INTEGRAL analysis software, with the corresponding response matrices. Each pointing has a typical exposure of 2–3 ks. Only observations where the SAX J2103.5+4545 position offset was less than 9∘ have been considered. Only for a few of these pointings also JEM-X data were available, due to the smaller field of view of this instrument (offset less than 3.5∘). SAX J2103.5+4545 has been detected in the energy range 20–40 keV with IBIS/ISGRI in 113 pointings (see Table 1).
The 2–10 keV lightcurve of SAX J2103.5+4545 obtained with the RXTE All Sky Monitor (ASM) from 1997 to 2004 is shown in Fig. 1. The times of the two previous outbursts observed with BeppoSAX (in 1997) and RXTE (in 1999), as well as the epoch of the INTEGRAL observations reported here, are indicated.
| Start Time | End Time | Number | Detections | Timing |
|---|---|---|---|---|
| (MJD) | (MJD) | of obs. | ||
| 52617.86 | 52619.28 | 4 | 3 | N |
| 52620.74 | 52620.93 | 2 | 0 | N |
| 52629.63 | 52631.92 | 58 | 56 | Y |
| 52636.66 | 52637.87 | 21 | 0 | N |
| 52638.46 | 52640.07 | 2 | 0 | N |
| 52653.32 | 52653.40 | 2 | 1 | N |
| 52722.85 | 52722.93 | 3 | 0 | Y |
| 52737.03 | 52737.12 | 3 | 1 | Y |
| 52746.10 | 52746.18 | 3 | 3 | Y |
| 52761.26 | 52762.42 | 38 | 38 | Y |
| 52770.05 | 52770.10 | 2 | 2 | Y |
| 52782.06 | 52782.14 | 3 | 3 | Y |
| 52835.9 | 52836.03 | 3 | 1 | N |
| 52985.41 | 52985.49 | 3 | 0 | N |
| 52994.38 | 52994.47 | 3 | 0 | N |
| 53019.37 | 53019.45 | 3 | 0 | N |
| 53045.61 | 53045.69 | 3 | 0 | N |
| 53090.96 | 53091.00 | 1 | 0 | N |
| 53102.48 | 53102.56 | 3 | 0 | N |
| 53114.16 | 53114.24 | 3 | 0 | N |
| 53126.09 | 53126.14 | 2 | 2 | Y |
| 53137.88 | 53137.93 | 2 | 0 | N |
| 53164.97 | 53165.05 | 3 | 0 | N |
| 53188.96 | 53189.03 | 2 | 0 | N |

3 Results
3.1 Timing Analysis
In order to perform the timing analysis, we selected events with a Pixel Illumination Function (PIF, pixel fraction illuminated by the source) larger than 0.5. IBIS/ISGRI events have been collected in the energy band 20–40 keV, where the best statistics is available, while for JEM-X the range 3–30 keV has been used.
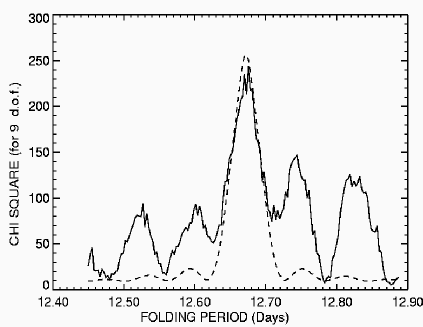
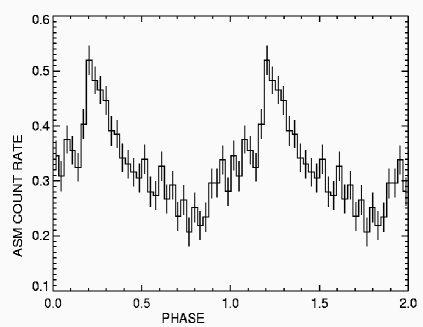
Arrival times have been corrected to the Solar System barycenter and for the Doppler delay due to the motion in the binary system. To perform this orbital correction, we adopted the ephemeris zero point from Baykal et al. (2000), but used an updated orbital period, Porb=12.670 days, that we calculated with epoch folding of all the available RXTE/ASM data (see Fig. 2 and Fig. 3). For our analysis, based on ASM dwell-by-dwell data, we used the epoch folding method described in Larsson (1996). The error estimate is based on Monte Carlo simulations and on the analysis of pulsations injected into the ASM lightcurve. From the Monte Carlo simulations we estimate the statistical error to be days. The slightly higher error estimate above includes also effect of the irregular source variability on the period determination. This latter effect is estimated from the injected pulsation.
Since the short duration of each single INTEGRAL pointing (2–3 ks) leads to a large uncertainty in the determination of the pulse period (typically about 10 s, even in presence of good statistics), we grouped the observations where a good estimate of the pulse period could be achieved in 7 separate data-sets consisting of the pointings performed during the same satellite revolution.
In Table 2 we list the start and end time of each group of observations, together with the source average IBIS/ISGRI count rate in the 20–40 keV range. In data-sets n.1, n.4 and n.5 also JEM-X data are available, and have been used in the timing analysis.
| Data-set | Start Time | End Time | IBIS/ISGRI | Pulse Period (s) | ||
|---|---|---|---|---|---|---|
| ID. | (MJD) | (MJD) | (s-1) | IBIS/ISGRI | JEM-X | |
| 1 | 52629.91 | 52631.84 | 5.16 | – | 355.09 | |
| 2 | 52722.85 | 52722.90 | 4.28 | 356. | ||
| 3 | 52746.10 | 52746.18 | 6.07 | 355. | 5 | |
| 4 | 52761.26 | 52762.42 | 4.07 | 353. | 32 | 353.47 |
| 5 | 52770.05 | 52770.10 | 8.62 | 351. | 8 | 355.4 |
| 6 | 52782.06 | 52782.12 | 6.45 | 351. | 3 | |
| 7 | 53126.09 | 53126.14 | 4.34 | 355. | ||

We searched for the SAX J2103.5+4545 spin period by using epoch folding techniques: we produced distributions versus trial period, and then we fit them in order to derive the best-fit period for each data-set, and its associated uncertainty (Leahy 1987). An example of a distribution is shown in Fig. 4.
The derived pulse periods are reported in Table 2. Our data-sets n.1 and n.4 include observations partly reported by Blay et al. (2004), Filippova et al. (2004) and Falanga et al. (2004).
A period difference of 1.77 s in 130.5 days is evident from the comparison of results from data-sets n.1 and n.4, which have the smallest uncertainty (Table 2). This spin-up is significantly higher than that measured during previous outbursts of this source.
The pulse period evolution during the INTEGRAL observations is shown in Fig. 7, where also the period measured by Inam et al. (2004) with RXTE has been shown for completeness. A linear fit to all these data indicates an average spin-up with a rate of Ṗ=10-7 s s-1 (=21.3, 8 degrees of freedom, dof).
A few examples of the folded light curves (background subtracted) obtained in different observations with ISGRI and JEM-X are shown in Fig. 5 and Fig. 6, respectively.


3.2 Spectral Analysis
We used data from all INTEGRAL observations to derive a spectrum with a very high signal to noise ratio. Since the source exhibits no significant spectral evolution during the outburst, this can be safely done.
The average source spectrum from 5 to 200 keV, has been investigated by simultaneously fitting JEM–X (5–20 keV) together with IBIS/ISGRI (20–200 keV), and SPI (20–200 keV) spectra, achieving net exposure times of 40 ks, 290 ks and 130 ks, respectively for the three instruments. An additional uncertainty of 5% was added quadratically to the statistical errors to account for systematic uncertainties in instrumental responses. Free relative normalizations between the three instruments were included. Since the energy range (5–200 keV) is not sensitive to the interstellar column density, we fixed it at 31022 cm-2 (Hulleman et al., 1998).
A single power-law is not able to describe the broad–band spectrum (reduced 2). The best-fit (=121.9 for 129 d.o.f.) is an absorbed power-law with a high energy cut-off (see Fig. 8), with the following parameters: photon index =1.53 , cut-off energy Ec=19 keV and e-folding energy Ef=32 keV. The 5–200 keV observed flux is 1.0510-9 erg cm-2 s-1 (based on the JEM–X response matrix). The source flux in the 2–10 keV energy range, corrected for the absorption, is 4.210-10 erg cm-2 s-1, which translates into a luminosity LX=21036 erg s-1 (2–10 keV, for a distance of 6.5 kpc).


4 Discussion
We have studied all the available INTEGRAL observations of SAX J2103.5+4545, obtained from December 2002 to July 2004. They cover part of the latest source outburst, which is the longest and brightest observed from this source since its discovery in 1997.
To perform a proper timing analysis of the INTEGRAL observations, we re-determined the orbital period of the binary system using ASM/XTE public data, obtaining a refined Porb of 12.670 days (to be compared with Porb of 12.68 days, measured with XTE during the 1999 outburst by Baykal et al., 2000).
The SAX J2103.5+4545 pulse profiles observed with INTEGRAL show evidence for temporal variability over the same energy range (15–40 keV), where a single asymmetric pulse profile seems to evolve to a double-peaked profile in some of the observations. On the other hand, in the lightcurves extracted at softer energies (3–30 keV) there is no clear evidence for a secondary peak. The INTEGRAL observations unfortunately do not cover the entire orbital phase; in particular, the data-sets n.3, n.5, n.6 and n.7 sample roughly the same orbital phase (these are indeed GPS observations, which are performed every 12 days, a value close to the source orbital period). Thus, apparently the complex variability of the pulse profile does not depend on the orbital phase. Also an obvious dependence on the source luminosity seems to be unlikely, since we observe different pulse periods from observations at similar fluxes (e.g., data-sets n.2 and n.7). The complex variability of the pulse profiles is a common feature among the class of accreting binary pulsars, also over the same energy range (White, Swank & Holt, 1983; Bildsten et al., 1997). In some sources the pulse shape variability shows a clear dependence on the source luminosity (first observed in EXO 2030+375, Parmar et al., 1989) or on the energy range (e.g. Vela X–1, Kretschmar et al, 1997). A simple geometric model with two pencil beams coming from the magnetic poles is too simple to explain the pulse profiles in most pulsars, and a more complex emission pattern or the inclusion of scattering effects in the transfer through highly magnetized plasmas are needed (e.g., Nagel, 1981). A computation of pulse profiles of medium-luminosity (L1036 erg s-1) binary X–ray pulsars has been performed by Kraus et al. (2003), who found that energy-dependent peaks in the profiles are mainly due to energy-dependent relative importance of the halo (which forms around the accretion funnel where the neutron star surface is irradiated) and the column contributions to the observed flux. It is also possible that the temporal variability of the pulse profile we observe in the same energy range can be due to time-dependent emission pattern, or to changes in the opacity of the magnetized plasma where the radiation propagates.
The pulse period evolution measured with INTEGRAL shows clear evidence for a spin-up episode, lasting at least 130 days from MJD 52629.9 (data-set n.1) to MJD 52761.3 (data-set n.4), where the pulse period decreased by 1.77 s.
Considering the overall pulse period history during the latest outburst (Fig. 7), a linear fit results in a spin-up rate Ṗ=10-7 s s-1.
We cannot exclude a more complex evolution of the pulse period than a simple steady spin-up over more than 1.3 years. In particular, it is likely that the spin-up trend induced by the accretion does not extend until the epoch of the data-set n.7.
A variation in the accretion rate can modify the pulse period derivative. A correlation of the spin-up rate with the X–ray flux has been indeed found for SAX J2103.5+4545 by Baykal et al. (2002) during the 1999 outburst, as predicted by the Ghosh and Lamb (1979) model for the torques exerted on the neutron star during the accretion through a disk. The existence of this correlation is indeed indicative of the formation of an accretion disk around SAX J2103.5+4545 during that outburst. The last pulse period measured with INTEGRAL (data-set n.7) has been determined after a long faint state lasting about 300 days (Fig. 7, upper panel). The reduced accretion rate could have increased the SAX J2103.5+4545 pulse period (a spin-down phase followed the spin-up trend during the 1999 SAX J2103.5+4545 outburst, Baykal et al. 2002), although the large uncertainty in the pulse period at that epoch (P=355 s) does not permit to draw firm conclusions.
The formation of an accretion disk in SAX J2103.5+4545 during the outburst in 1999 has been established from RXTE data (Baykal et al. 2002). Furthermore, the fact that our estimate of the spin-up rate (the highest ever measured in this source) has been measured during the brightest outburst observed from SAX J2103.5+4545, indicates that the correlation between luminosity and spin-up is still valid. It is thus tempting to discuss our results on the source spin-up rate in the framework of the Ghosh and Lamb (1979) theory.
In Fig. 9 we compare the measured pulse period derivative of 1.4910-7 s s-1 with the theoretical relation between the spin-up rate of a 1.4 neutron star and the quantity PL3/7, where P is the pulse period in seconds, and L is the source luminosity in units of 1037 erg s-1 (Ghosh & Lamb, 1979). Thus, assuming that the distance of 6.5 kpc is correct, a magnetic moment of 1.61030 Gauss cm3 is needed to explain the spin-up rate. This translates into a magnetic field of 1012 Gauss, which would imply a cyclotron line at energies around 10-20 keV, not observed in the source spectrum. The absence of lines could suggest a much higher neutron star magnetic field, 1013 Gauss, but this would imply a smaller distance, around 5 kpc. A distance of 5 kpc also agrees with the maximum spin-up trend measured with XTE during the 1999 outburst (Baykal et al., 2002): a pulse period derivative of 8.910-8 s s-1 (and pulse period P=358.166 s) for a source flux of 610-10 erg cm-2 s-1 can be explained with a neutron star of 1.4 and a magnetic moment 1031 Gauss cm3, located at a distance of about 5 kpc.
However, note that there are uncertainties in the dimensionless angular momentum adopted in the accretion torque theory (Li & Wang, 1996), which could significantly modify the estimate of the source distance derived with this method (see, e.g., Tsygankov & Lutovinov (2005), on the binary pulsar KS 1947+300). Another uncertainty is due to the source flux we adopted here, which is not the bolometric flux and has been measured from the average INTEGRAL spectrum in the energy range 5–200 keV.

The spin-up rate measured with INTEGRAL from SAX J2103.5+4545 is the largest experienced by this source (likely because of the higher brightness of the latest outburst) and is among the largest found for an X-ray binary pulsar. The frequent monitoring (as that performed with INTEGRAL during the GPS) of accreting pulsars is essential in the determination of the pulse period evolution, and crucial to test accretion theories.
References
- (1) Baykal, A., Stark, M.J., Swank, J.H., 2000, ApJ, 544, L129
- (2) Baykal, A., Stark, M.J., Swank, J.H., 2002, ApJ, 569, 903.
- (3) Bildsten, L., Chakrabarty, D., Chiu, J., et al., 1997, ApJS, 113, 367
- (4) Blay, P., Reig, P., Martinez Nunez, S., et al, 2004, A&A, 427, 293
- (5) Corbet, R.H.D., 1986, MNRAS, 220, 1047
- (6) Filippova, E.V., Lutovinov, A.A., Shtykovsky, P.E., et al., 2004, Astronomy Letters, 30, 824 (astro-ph/0410590)
- (7) Falanga, M., Di Salvo, T., Burderi, L., et al., 2005, in press as research note in A&A, (astro-ph/0503016)
- (8) Ghosh, P., Lamb, F.K., 1979, ApJ, 234, 296
- (9) Hulleman, F., in’t Zand, J.J.M., Heise, J., 1998, A&A, 337, L25
- (10) Inam, S.C., Baykal, A., Swank, J., et al., 2004, ApJ, 616, 463
- (11) Kraus, U., Zahn, C., Weth, C., et al., 2003, ApJ, 590, 424
- (12) Kretschmar, P., Pan, H.C., Kendziorra, E., et al., 1997, A&A, 325, 623
- (13) Labanti, C., Di Cocco, G., Ferro, G., et al., 2003, A&A, 411, L149
- (14) Larsson, S., 1996, A&AS, 117,197
- (15) Leahy, D.A., 1987, A&A, 180, 275
- (16) Lebrun, F., Leray, J. P., Lavocat, P., et al., 2003, A&A, 411, L141
- (17) Li X.-D., Wang, Z.-R., 1996, A&A, 307, L5
- (18) Lund, N., Brandt, S., Budtz-Jorgensen, C., et al., 2003, A&A, 411, L231
- (19) Lutovinov, A., et al., 2003, Astron.Lett., 29, 713
- (20) Nagel, W., 1981, ApJ, 251, 278
- (21) Parmar, A.N., White, N.E., Stella, L., 1989, ApJ, 338, 373
- (22) Reig, P., Mavromatakis, F., 2003, Atel 173
- (23) Reig, P., Negueruela, I., Fabregat, J., et al., 2004, A&A, 421, 673
- (24) Sidoli, L., Mereghetti, S., Larsson, S., et al., 2004, Proc of the V INTEGRAL Workshop, SP-552, p.475
- (25) Tsygankov, S.S., & Lutovinov, A.A., 2005, Astron Letters, 31, 88 (astro-ph/0501080)
- (26) Ubertini, P., Lebrun, F., Di Cocco, G., et al., 2003, A&A, 411, L131
- (27) Vedrenne, G., Roques, J.-P., Schoenfelder, V., et al., 2003, A&A, 411, L63
- (28) White, N. E., Swank, J. H., & Holt, S. S., 1983, ApJ, 270, 711
- (29) Winkler, C., Gehrels, N., Schoenfelder, V., et al., 2003, A&A, 411, L349