The Growth of the Local Void and the Origin of the Local Velocity Anomaly
Abstract
The Local Void is the nearest void from us and is thought to be playing an important role in the kinematics of the local universe, especially as one of the suspected source of the motion of the Local Group. The imbalance between the mass in the Local Void region and that contained in the concentration at the opposite side might contribute to the velocity of the Local group perpendicular to the Supergalactic plane, and this would be a prototype of the evolution of the large-scale structure. The proximity of the Local Void provides us the exclusive opportunity to investigate the kinematics around a void. Here we report the results of our observational study of the peculiar velocities of about 40 galaxies at the far-side of the Local Void, using the near-infrared Tully-Fisher relation. The galaxies at the boundary of the void shows an excess of receding motion, suggesting the expansion of the Local Void. We examined the effect of selection biases on the peculiar velocity
distribution, and concluded that the excess of receding motion could not fully attribute to selection biases.
Department of Astronomy, Faculty of Science, Kyoto University, Kitashirakawa-Oiwakecho, Kyoto, Japan 606-8502
Subaru Mitaka Office (Subaru Telescope), National Astronomical Observatory of Japan, Osawa 2-21-1, Mitaka, Tokyo, Japan 181-8588
Nobeyama Radio Observatory, National Astronomical Observatory of Japan, Minamimaki, Minamisaku, Nagano, Japan 384-1305
GEPI, Observatoire de Paris, Section de Meudon, 92195 Meudon Cedex, France
National Research Institute of Astronomy and Geophysics (NRIAG), Helwan, Egypt
1. Introduction
It is known that the (LG) has a motion against the microwave background with a velocity of km/s (Kogut et al. 1993). This motion is considered to be caused by gravitational forces from matters around the LG. During the past decade, several extensive projects aiming at understanding the distribution of the galaxies and the velocity fields in the local universe have been executed. Although it is claimed that results of these projects explain the motion of the LG for a certain degree (e.g., Dekel et al. 1999; Branchini et al. 1999; Hudson et al. 2004), it should be noted that these studies are based on the sample which is not distributed on the whole sky and there is deficient of galaxies located in the sky area obscured by the Milky Way. Especially, we know little about the origin of the LG’s motion perpendicular to the Supergalactic plane, which is considered to be more than 300 km/s (so-called the (LVA)), and the extent of this motion; specific to the LG, or common in the Local Supercluster? Understanding this motion is a crucial task for the studies of the velocity fields in the local universe.
It has been suggested that the is a main contributor of the LG’s motion perpendicular to the Supergalactic plane (Faber and Burstein 1988; Lahav et al. 1993; Takata et al. 1996; Burstein 2000). In Figure 1 the numbers of galaxies toward the positive and negative directions perpendicular to the Supergalactic plane are shown. There is a clear contrast of the number densities between two directions at km/s, which is caused by the existence of the Local Void; i.e., the Local Void is the nearest void from us, and the LG is on the edge of the Local Void. Thus it is natural to consider this density contrast affects the motion of the LG, and the Local Void apparently “pushes” the LG to SGZ direction. This effect can be considered to be a part of the evolution of the large-scale structure in the local universe; higher mass density regions are contracting and voids are expanding. If this is the case, the galaxies located at the far-side boundary of the Local Void must have an excess of receding motions in addition to the normal Hubble flow, caused by the mass concentration behind them. Measuring the motion of the galaxies located at the far-side boundary of the void is a simple and effective way to evaluate its gravitational effect on the LG. The objective of this study is to investigate the peculiar velocities of galaxies beyond the Local Void. We use the near-infrared (TFR) for deriving redshift-independent distances of galaxies. Since measuring the distances and of galaxies have large uncertainties and the errors are getting larger proportional to their distances, the proximity of the Local Void has a great value; it provides an exclusive opportunity of the study of the kinematics of galaxies at a specific structure.

2. Observations
2.1. Sample Selection
In order to construct a sample of galaxies beyond the Local Void for measuring their peculiar velocities using the Tully-Fisher relation, we adopted the following criteria:
-
1.
Galaxies around the North Supergalactic Pole: , ,
-
2.
Radial velocities km/s,
-
3.
Axial ratios in the three-band co-added images in the 2MASS (“
sup_ba” in the catalogue) are less than 0.721 (i.e., inclinations are larger than , assuming the intrinsic major-to-minor axis ratio of a spiral galaxy viewed as edge-on to be 0.2), -
4.
Extinction-corrected major axis size , for improving the detection rate of HI emission lines (Chamaraux et al. 1999).
By these criteria, 51 edge-on spiral galaxies have been selected for the near-infrared imaging observations and HI 21cm line measurements. Some objects have been discovered by our systematic optical plate search (Roman, Iwata & Saitō 2000), and radial velocities have been measured by us with the optical spectroscopy.
2.2. Near-infrared Imaging Observations
Near-infrared (-band) imaging observations were carried out using the (QUIRC) on the University of Hawaii 2.2m telescope at Mauna Kea, Hawaii. Observation dates were 07 – 09 July, and 04 – 05 Aug., 2001 (UT). The condition was mostly photometric throughout the observing. QUIRC has a HAWAII 10241024 HgCdTe array with a pixel scale of /pixel, yielding a field-of-view of . The exposure time of each frame was 120 sec or 180 sec and multiple frames are taken with dithering scale of . The total on-source integration times range from 900 sec to 1800 sec, depending on apparent surface brightness of the objects. In total 24 objects have been observed with UH88/QUIRC.
We also made additional observations during 2003–2004 with the (IRSF) / SIRIUS at Sutherland, South Africa, which has been constructed and operated by Nagoya University and National Astronomical Observatory of Japan. In this report we used the photometry data taken with IRSF for three objects.
2.3. Data reduction of near-infrared images
Basic data reduction including dark subtraction, flat-fielding, image alignment and stacking was made in a normal manner, using tasks in IRAF. Since the Local Void region is close to the Galactic plane, the images are crowded with foreground stars. It is quite important to remove these stars before executing photometry of target galaxies, for a precise measurement of their apparent magnitude. For faint stars we made the PSF fitting using Moffat profile for each star and subtracted them from reduced images. For bright stars their profiles are saturated and we could not execute profile fitting. In such cases we made interpolations of counts from surrounding pixels.
After the removal of foreground stars, isophotal ellipse with mag/sq.′′ are defined for each galaxy, and we calculated counts within the ellipse. Photometric zero points are derived for each night using UKIRT near-infrared standard stars. Photometric error in isophotal magnitude of sample galaxies is primarily dominated by errors in determining photometric zero point, and it is about 0.05mag.
We also add objects without our own -band imaging data
using data in two-micron all-sky survey extended source catalogue
(2MASS XSC; Jarrett et al. 2000).
There are 9 such objects, and for those galaxies
we used the mag/sq.′′ isophotal elliptical
aperture magnitude (“h_m_i20e”) in the catalogue.
For objects with our own imaging data,
the differences between isophotal magnitude based on our own
-band imaging data and that in 2MASS XSC are within 0.1 mag
in most cases. There are several cases, however, that the difference between
our photometry and 2MASS XSC are significantly large ( mag).
We think that these might be caused by the crowded foreground stars,
whose effects are sometimes difficult to be removed in the
2MASS’s low-resolution images.
2.4. HI 21cm line observations
¿From 2001 we have been executing 21cm HI line observations for our sample galaxies with the . So far the line widths of 23 galaxies have been measured. The errors of the measured widths were estimated to be less than 20 km/s in most cases. For 13 galaxies without our own HI line observation, we used the published data in the literature or the on-line database (Paturel et al. 2003). Many of the HI line widths in the literature have been obtained with the same telescope. The total number of sample galaxies with observed -band photometry and HI line widths are 36.
3. Near-infrared Tully-Fisher Relation
We used the objects’ line widths at 20% of peak fluxes and corrected for inclination, instrumental broadening and turbulent motions of HI clouds within the target galaxies. -band apparent magnitude were also corrected for inclination and internal extinction, as well as an extinction by our Galaxy. Degrees of the Galactic extinction at the positions of the sample galaxies were estimated using the extinction map by Schlegel, Finkbeiner & Davis (1998), and we assumed .
As a slope of the -band Tully-Fisher relation, we used , suggested by Bamford (2002), who used 2MASS XSC data of several cluster spiral galaxies to determine the near-infrared TFR slopes. We set a zero point of the relation by assembling 2MASS XSC data and HI line widths () in LEDA for galaxies across the all-sky area. The slope and zero points determined by this procedure is broadly consistent with those for -band TFR defined in previous studies such as Pierce & Tully (1988), Sakai et al. (2000) and Verheijen (2001); i.e., the following results do not change significantly if we adopt these alternative TFR parameters.
4. Peculiar Velocities of Galaxies beyond the Local Void
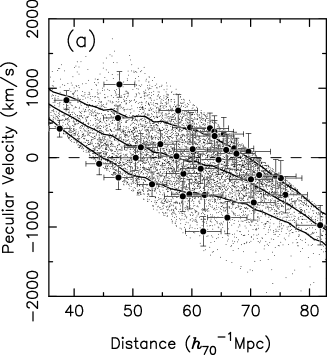
In Figure 2 we show a result of the application of the near-infrared TFR for our Local Void sample galaxies. The distances are estimated from the TFR, and the peculiar velocities are derived by subtracting the Hubble flows from radial velocities of galaxies with respect to the CMB frame (). The error bars include the typical errors in the estimation of inclinations and internal extinction as well as the observational errors for -band photometry and HI line widths. There are 8 galaxies whose estimated distances are smaller than 10 Mpc or larger than 100 Mpc. The peculiar velocity estimates of these galaxies are unusually large ( km/s). We think that these are due to the observational errors or unexpectedly large dust extinction. These galaxies have been removed from the sample and they are not shown in the figure. We are currently making additional HI observations for some of these galaxies with unusually large peculiar velocities.

Apparently in this plot the galaxies closer to us show the excess of motion against us and more distant galaxies have velocities coming toward us. However, we must consider the effect of selection biases. We restrict the sample galaxies to have radial velocities less than 5000 km/s, and there is no galaxy with km/s in our sample. The dotted lines in figure 2 represent constant radial velocities with km/s and 5000 km/s, respectively. Thus the sample galaxies cannot be located outside of the zone between these two dotted lines. We should also consider that the so-called Malmquist bias (e.g., Lynden-bell et al. 1988; Strauss & Willick 1995) can affect the distance-velocity distribution.
In order to estimate the amount of these selection effects, we made a statistical test using mock galaxy catalogues. We generated a random and uniform spatial distribution of galaxies which were within a cone with an opening angle of , and they were at distances between 40 Mpc and 100 Mpc from an observer. For each galaxy we added a random peculiar velocity in the direction of the line-of-sight. The amount of the velocities were drawn from a Gaussian distribution with a standard deviation of 500 km/s. This means that a boundary of the void is at 40 Mpc from the observer, and galaxies are distributed uniformly beyond it without systematic peculiar motions. We added errors to the distances of galaxies in this mock catalogue. The errors were assumed to be Gaussian which have standard deviations were proportional to their distances. The proportional factor of the errors was adjusted to match with our observed data and their error estimates. For each galaxy, the apparent peculiar velocity was calculated from the estimated distance (with an error) and its intrinsic peculiar velocity. Among them 40 galaxies whose “observed” radial velocities were between 3000 km/s and 5000 km/s were randomly selected. The estimated distance and a peculiar velocity were recorded for each of the selected galaxies. We executed this test 1000 times. In Figure 3 we show the estimated distances and the peculiar velocities obtained by this test. In the result of the test (Figure 3(a)) the simulated objects between 45 Mpc and 55 Mpc do show an excess of a false receding motion, but the amount of this excess is not so large; an average of mean peculiar velocities of galaxies in the distance range in 1000 tests are 170 km/s. In 9 times among 1000 tests the mean peculiar velocity were larger than 500 km/s, and there is only one case with mean peculiar velocities larger than 700 km/s. On the other hand, in our observed data, an average of the peculiar velocities of five galaxies with the estimated distances between 45 and 55 Mpc is 870 km/s (see Figure 3(b)). Thus from this test we conclude that the selection biases and reasonable random peculiar velocities of galaxies would not account for such a large excess of receding motion. So our observed data might indicate the presence of systematic receding motion of galaxies at the boundary of the Local Void.

5. Conclusion
We examined the peculiar velocities of galaxies beyond the Local Void, using the near-infrared Tully-Fisher relation. The galaxies at the far-side boundary of the Local Void have systematic peculiar velocities against us, and the motion cannot be fully attributed to the selection effects. These receding motions might indicate the expansion of the Local Void as an example of the evolution of the void-filament structure of the universe, and it would be partly responsible for the velocity anomaly of the Local group.
We are now conducting a study on the peculiar velocities of the galaxies in the Puppis region, which are at the opposite direction against the Local Void. We expect that the examination of the peculiar velocities of these galaxies
will reveal the local velocity field perpendicular to the Supergalactic plane and the extent of the Local velocity anomaly more clearly.
References
- Bamford (2002) Bamford S.P., 2002, MSci thesis, University of Durham (astro-ph/0210227)
- Branchini et al. (1999) Branchini, E., Teodoro, L., Frenk, C.S., et al. 1999, MNRAS 308, 1
- Burstein (2000) Burstein, D. 2000, in Cosmic Flows 1999: Towards an Understanding of Large-Scale Structure, ASP conf. ser. 201, ed. S. Courteau, M.A. Strauss & J.A. Willick, 178
- Chamaraux et al. (1999) Chamaraux, P., Masnou, J-L., Kaz’es, I., Saitō, M., Takata, T., & Yamada, T. 1999, MNRAS 307, 236
- Dekel et al. (1999) Dekel A., Eldar A., Kolatt T. et al. 1999, ApJ 522, 1
- Faber & Burstein (1988) Faber, S.M. & Burstein, D. 1988, in Large-Scale Motions in the Universe, ed. V.C. Rubin & G.V. Coyne, (Princeton; Princeton Univ)
- Hudson et al. (2004) Hudson M.J., Smith R.J., Lucey J.R., & Branchini E. 2004, MNRAS in press
- Jarrett et al. (2000) Jarrett, T. H., Chester, T., Cutri, R., Schneider, S., Skrutskie, M. & Huchra, J. P. 2000, AJ 119, 2498
- Kogut et al. (1993) Kogut, A., Lineweaver, C., Smoot, G.F. et al. 1993, ApJ 419, 1
- Lahav et al. (1993) Lahav, O., Yamada, T., Scharf, C., & Kraan-Korteweg, R.C. 1993, MNRAS 262, 711
- Lynden-bell et al. (1988) Lynden-Bell, D., Faber, S.M., Burstein, D. et al. 1988, ApJ 326, 19
- Paturel et al. (2003) Paturel, G., Petit, C., Prugniel, Ph., et al. 2003, A&A 412, 45
- Pierce & Tully (1988) Pierce, M.J., & Tully, R.B., 1988, ApJ 330, 579
- Roman, Iwata & Saitō (2000) Roman, A.T., Iwata, I., Saitō, M. 2000, ApJS 127, 27
- Sakai et al. (2000) Sakai S., Mould J.R., Hughes S.M.G., et al. 2000, ApJ 529, 698
- Schlegel, Finkbeiner & Davis (1998) Schlegel, D.J., Finkbeiner, D.P. & Davis, M. 1998, ApJ, 500, 525
- Strauss and Willick (1995) Strauss M.A. & Willick, J.A. 1995, Phys. Rep. 261, 271
- Takata et al. (1996) Takata, T., Yamada, T. & Saitō, M. 1996 ApJ 457, 693
- Verheijen (2001) Verheijen M.A.W. 2001, ApJ 563, 694