Honjo, Kamogata, Okayama 719-0232 Japan 11email: iwata@oao.nao.ac.jp 22institutetext: Subaru Mitaka Office (Subaru Telescope), National Astronomical Observatory of Japan,
Osawa 2-21-1, Mitaka, Tokyo 181-8588 Japan 33institutetext: Department of Astronomy, Faculty of Science, Kyoto University, Kitashirakawa-Oiwakecho, Sakyo-ku, Kyoto 606-8502 Japan 44institutetext: Laboratoire d’Astrophysique de Marseille, Traverse du Siphon, BP 8, 13376 Marseille, CEDEX 12, France 55institutetext: Department of Physics, Faculty of Science, Kyoto University, Kitashirakawa-Oiwakecho, Sakyo-ku, Kyoto 606-8502 Japan
Spectroscopy and Stellar Populations of Star-forming Galaxies at in the Hubble Deep Field - South ††thanks: Based on observations collected at the European Southern Observatory, Paranal (Chile); Proposal No.: 71.A-0419(A).
We present results of VLT/FORS2 spectroscopy of galaxies at in the Hubble Deep Field - South (HDF-S). A sample of galaxies was drawn from the photometric redshift catalogue based on the HST/WFPC2 optical images and the deep near-infrared images obtained with VLT/ISAAC as a part of the Faint Infrared Extragalactic Survey (FIRES) project. We selected galaxies with photometric redshift between 2.5 and 4. Most of the selected galaxies are bright in rest-frame UV wavelengths and satisfy color selection criteria of Lyman break galaxies (LBGs) at . The number of target galaxies with was 15. We identified new 5 firm and 2 probable redshifts in addition to confirmations of previously known 6 galaxies at . We found 6 among these 13 galaxies lie at a quite narrow redshift range at . Their spatial distribution is fairly concentrated and is at the edge of the HDF-S field, suggesting the possible existence of larger galaxy clustering. We examined stellar populations of the galaxies with spectroscopic redshifts through comparisons of their optical and near-infrared photometry data with template spectra generated by a population synthesis code. The ages from the onset of star formation for these star-forming galaxies with are typically 50–200 Myr, and their stellar masses are between (0.5–5) , consistent with previous studies. We also compared these SED fitting results with those for “distant red galaxies” (DRGs) at discovered by FIRES. DRGs have larger stellar masses, larger dust attenuation than our UV-luminous LBG sample, and their star formation rates are often comparable to LBGs. These trends suggest that majority of DRGs are indeed the most massive systems at the redshift and are still in the active star-forming phase. Unless the number density of DRGs is much smaller than LBGs, estimates based on UV selected sample could miss substantial part of stellar mass density at .
Key Words.:
cosmology: observations – galaxies: high-redshift – galaxies: distances and redshifts – galaxies: evolution – galaxies: stellar content1 Introduction
In recent several years, there has been much progress in understanding the nature of galaxies at high-redshift. Deep imaging of blank fields and the photometric redshift technique based on multi-band photometry have enabled a construction of large samples of high-redshift galaxies which are so faint that we need long exposures to obtain good signal-to-noise spectroscopy of them. The Lyman break technique, a simple variant of the photometric redshift techniques, intends to detect high redshift galaxies by finding a spectral break at redshifted Lyman limit and the discontinuity at shortward of Ly due to attenuation by intergalactic neutral hydrogen. The number of galaxies selected by the technique, so-called Lyman break galaxies (LBGs), amounts to an order of at (e.g., Steidel et al. ste96 (1996), ste03 (2003); Foucaud et al. fou03 (2003)), and several hundreds even at (Iwata et al. iwt03 (2003); Ouchi et al. ouc04 (2004)). Follow-up studies on LBGs such as optical spectroscopy (e.g., Teplitz et al. tep00 (2000); Pettini et al. pettini01 (2001); Shapley et al. shap03 (2003); Ando et al. and04 (2004)) and analysis of their stellar populations using optical-to-near-infrared spectral energy distribution (SED) (e.g., Sawicki and Yee sy98 (1998); Shapley et al. shap01 (2001); Papovich et al. pap01 (2001)) have been made. By these studies basic properties of LBGs have been clarified; their star-formation rates amount to several tens to several hundreds /year, dust attenuation is fairly small (), their stellar populations are dominated by relatively young massive stars (ages less than 1 Gyr in most cases) and stellar mass is an order of (about 1/10 of the Galaxy).
Although these studies have clearly indicated that the Lyman break technique is a powerful method to probe the star-forming galaxies at , the number fraction of LBGs among the total populations of galaxies at a redshift considered remains unclear. Since the Lyman break technique selects galaxies which show prominent discontinuity at Å and have flat UV spectra, sample galaxies are biased to actively star-forming galaxies with relatively small amount of dust attenuation. Recently, several studies based on deep near-infrared imaging revealed substantial populations of massive galaxies which are faint in optical bands but bright in near-infrared (e.g., Franx et al. frx03 (2003); Daddi et al. dad04 (2004); Chen and Marzke chen04 (2004)), and it has been suggested that optical (i.e., rest-frame UV) based samples may miss a significant amount of massive galaxies. However, due to their optical faintness, only a small fraction of these red galaxies have spectroscopic redshifts. Thus current estimates of their redshift distribution and number density have large uncertainties. Moreover, since the red color can be explained by both heavy dust attenuation and old stellar population, the nature of these galaxies – dusty star-forming galaxies or massive galaxies dominated by old stellar population – is unresolved.
The Hubble Deep Fields (HDFs) are one of the most prominent observations for the study of high-z galaxies. Deep imaging covering the optical wavelengths by HST/WFPC2 (Williams et al. wil96 (1996); Casertano et al. cas00 (2000)) as well as near-infrared images obtained by HST/NICMOS and ground-based observatories enabled the photometric redshift estimation down to , for both northern and southern HDFs. (e.g., Fernàndez-Soto et al. fsoto99 (1999); Yahata et al. yah00 (2000); Labbé et al. lab03 (2003) (hereafter L03); Vanzella et al. van04 (2004)). In the HDF-S we carried out a deep OII+44 narrow-band imaging using VLT/FORS1 to examine the escape fraction of Lyman continuum from galaxies at (Inoue et al. ino05 (2005)). Although precise redshift measurements were required to use the narrow-band image to discuss the Lyman continuum escape fraction, in the HDF-S only a handful spectroscopic observations have been made so far (Cristiani et al. cri00 (2000); Vanzella et al. van02 (2002); Sawicki and Mallén-Ornelas saw03 (2003); Rigopoulou et al. rig05 (2005)), and in particular, the number of galaxies identified to be at is still quite limited; only 2 galaxies at and 8 galaxies at have been reported. In order to increase the number of sample galaxies, we carried out spectroscopic observations of galaxies with photometric redshifts estimated to be at with VLT/FORS2. The precise redshift information is also useful to reduce the uncertainty of physical properties (stellar mass, ages, amount of dust attenuation) in SED fitting. In this paper we report the results of the spectroscopic observations. In section 2 we describe the sample selection, observations and data reduction. The results and a discussion on a spatial distribution of sample galaxies are presented in section 3. We also investigate the stellar population and star formation history of the galaxies (section 4), and compare them with properties of “distant red galaxies” discovered by Franx et al. (frx03 (2003)) in section 5. A summary and conclusions of the paper are presented in section 6.
Throughout the paper all magnitudes are presented in AB system. We adopt a set of cosmological parameters of (, , ) = (0.3, 0.7, 0.7).
2 Observations and data reduction
2.1 Sample selection and observations
The target field is the WFPC2 main field of the Hubble Deep Field - South, centered at R.A. = 22:32:56.2 Decl=:33:02.7. The WFPC2 observations, data reduction, data quality and object detection procedures are described in Casertano et al. (cas00 (2000)). Ultra-deep near-infrared , , -band imaging observations using VLT/ISAAC have been carried out as a part of the Faint Infrared Extragalactic Survey (FIRES). L03 utilized their near-infrared images and publicly available HST/WFPC2 optical images to estimate photometric redshifts for faint galaxies. The catalog contains 134 entries with a photometric redshift between 2.5 and 3.7. We selected a primary sample for spectroscopic observation with the corrected isophotal magnitude brighter than 25.0. The number of galaxies satisfying the criteria was 23.
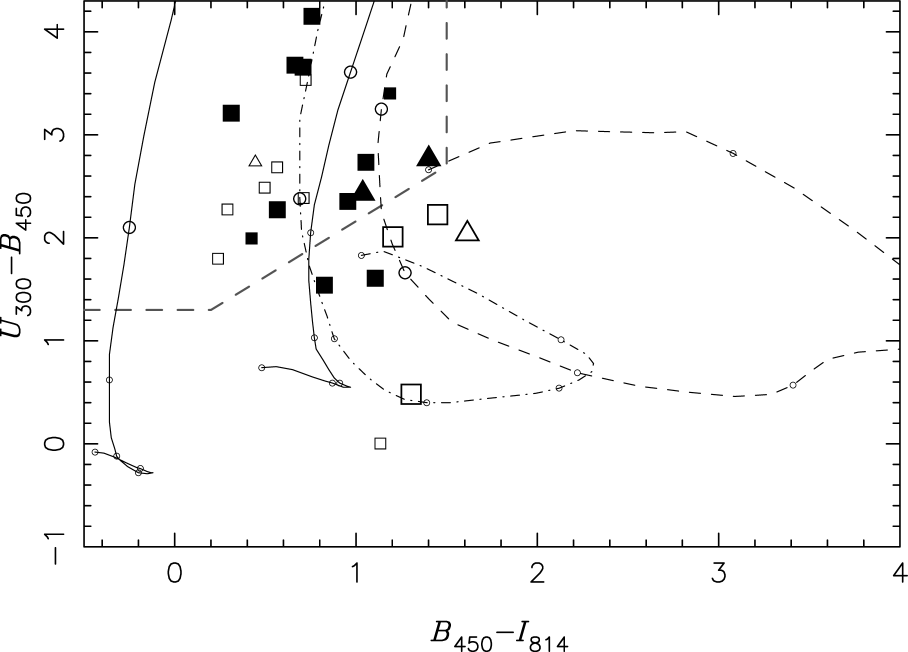
Figure 1 shows the distribution of sample galaxies in the versus two-color diagram. For those without detection, lower limits of colors are shown. Since the selection of the sample galaxies were not based on the Lyman break method but on the photometric redshift using multi-band imaging data, not all the sample galaxies satisfy the criteria for selection of LBGs defined by Madau et al. (mad96 (1996)). All except two objects with spectroscopic redshift determinations (shown with filled symbols in figure 1) satisfy the LBG color criteria (see §3). Two objects with spectroscopic redshifts lying at the outside of the LBG color area are HDFS0001 and HDFS0085. These two objects locate close to the edges of the WFPC2 image, and photometric errors in -band are estimated to be mag. Thus we expect that properties of sample galaxies with spectroscopic redshifts are quite similar to LBGs.
We made a multi-object spectroscopy using VLT/FORS2 in MXU mode. In this mode exchangeable mask unit with slitlets prepared on a focal plane were used. We defined the positions of slitlets on the HST/WFPC2 -band image, using the software provided by ESO. For some galaxies with , we could not set a mask due to overlappings with other target objects. On the other hand, we set some additional slitlets for fainter objects, i.e., , if they did not conflict with slitlets for bright objects. The final sample for spectroscopy consists of 15 galaxies with and 10 galaxies with . In table 1 basic parameters of the sample galaxies are listed.
The observations were executed in service mode, on 7 nights during 25th June to 28th July 2003. We used the 300V grism, which provides a 1.6Å / pixel resolution over 3300Å– 6600Å. Slit widths were , and the resolving power at 5900Å was 260. Exposure time for each shot was 999 sec in most cases, and the total on-source exposure time was 6.1 hours.
2.2 Data reduction
Basic data reduction steps, namely, bias subtraction (using overscan regions), cosmic-ray removal and flat-fielding have been made using IRAF. After the registration of all frames, the images were combined using the IRAF/IMCOMBINE task. The sky subtraction and extraction of one-dimensional object spectra were made using an interactive program developed by one of us (I.I.). Using that program a user can make a background fitting in any wavelength range and preview the result of subtraction before execution.
The flux calibration and sensitivity correction were made using spectral data of standard stars (Feige 110, LTT 1020 and LTT 6248) taken during the observing runs.
3 Results of spectroscopy
3.1 New redshift identifications
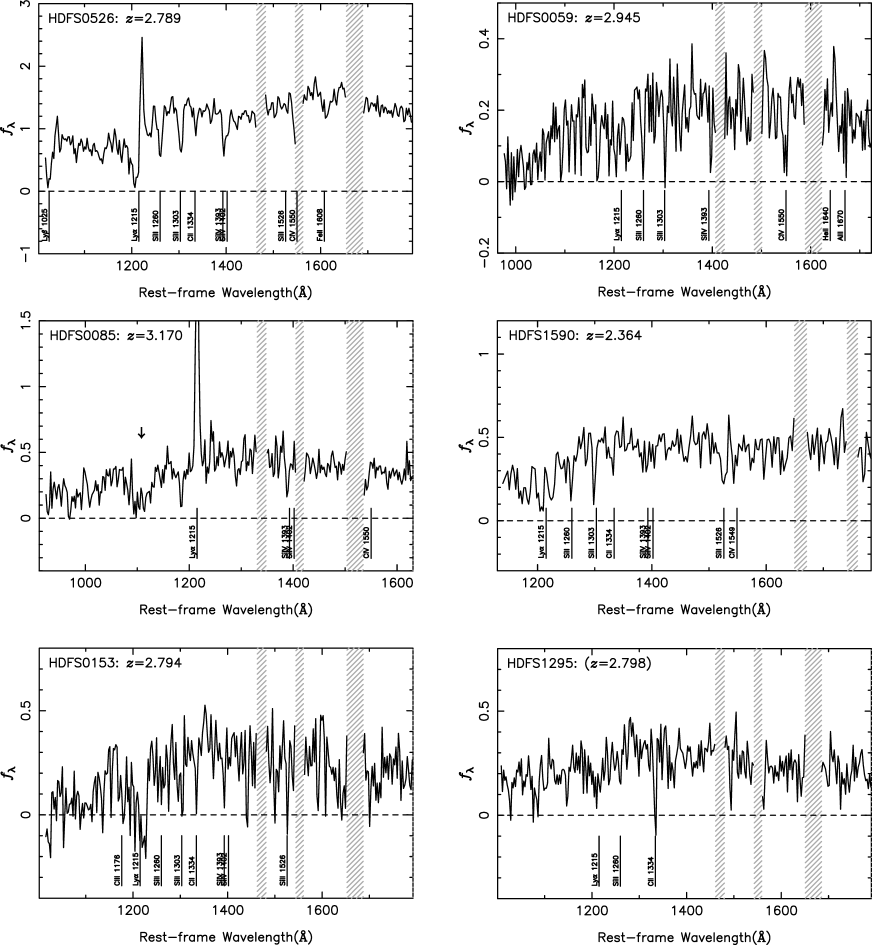
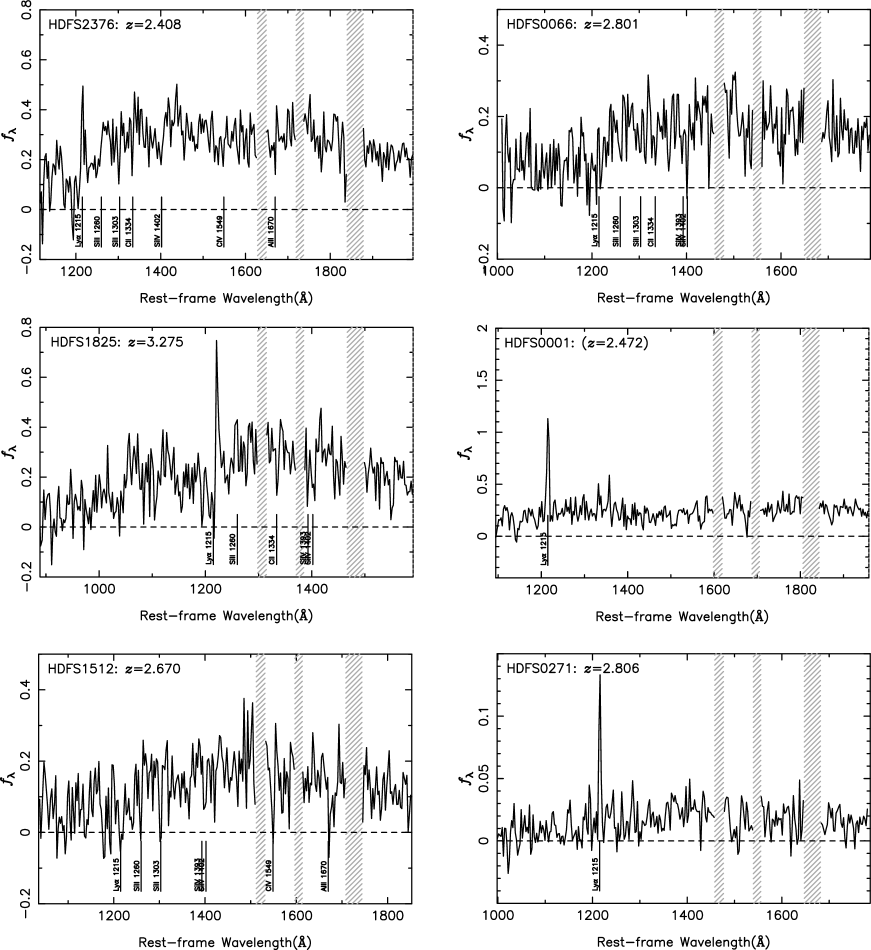
We firmly identified 5 new spectroscopic redshifts. All of these new redshift determinations are based on the identifications of three or more spectroscopic features, such as Ly emission, low-ionization absorption lines (e.g., Si ii and C ii), and the discontinuity of continua at 1216Å. They are labeled with asterisks in the sixth column of table 1. In figure 2 and 3 we show the extracted one-dimensional spectra of galaxies with redshift identifications. There are six galaxies with previously determined redshifts; one object HDFS00271 is a faint () Ly emitter, and the others are . Redshifts for these objects listed in table 1 are based on our spectroscopic data, and the differences from previous studies are less than 0.003. There is also one galaxy HDFS10652 (HDFS 223250.05603356.8) which we did not observe but the redshift has been determined to be by Vanzella et al. (van02 (2002)). Thus in total 12 galaxies with have been found in the HDF-S field. There are also two objects whose redshifts are likely to be newly determined by our observation, but the identifications are not definite because the S/N of spectra was poor and only one or two lines are firmly identifiable. We list these two probable redshifts in table 1 with parentheses. For galaxies whose spectra have Ly line as emission lines we show the rest-frame FWHMs and equivalent widths (EWs) in table 1. For HDFS00565 and HDFS00526 we measured FWHMs and EWs for combined spectra, because their positions are only apart and spectra are blended. We tried to extract spectra of their central parts separately and saw no difference in their redshifts (). Because the signal-to-noise ratios of spectra are poor, we could not measure EWs of absorption features.
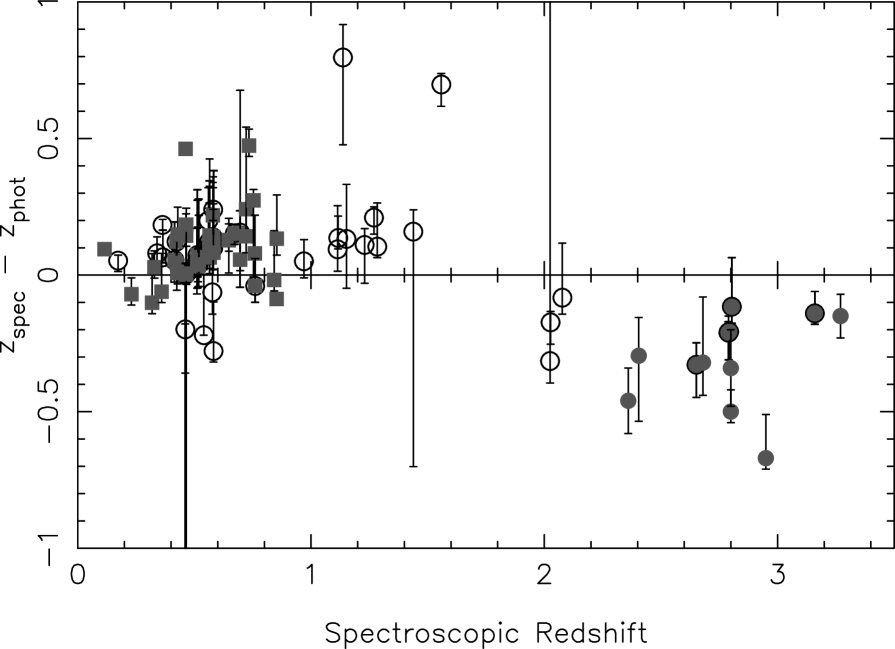
The spectroscopic redshifts obtained for our sample galaxies are always smaller than photometric redshifts estimated by L03. In Fig. 4 we show a comparison of spectroscopic and photometric redshifts for all galaxies in the HDF-S which have a published spectroscopic redshift. There is no object at for which photometric redshift is equal to or smaller than spectroscopic redshift. On the other hand, the photometric redshifts of galaxies at are systematically smaller than spectroscopic redshifts. This trend can be also seen in figure 6 of L03 but it is not clear due to smaller number of galaxies with spectroscopic redshifts.
3.2 Galaxy concentration at
We noticed that five among 12 galaxies with firm spectroscopic redshifts locate between a narrow redshift range from 2.789 to 2.806 (corresponding to a comoving length of Mpc). In figure 5 we show the spatial distribution of 12 galaxies with known redshifts. The five galaxies between , shown as filled circles, also lie within a sky area ( corresponds to Mpc (comoving) at ). In addition, in the spectrum of HDFS00085 at (shown as a triangle in figure 5) we identified a dump of a continuum around Å, which coincides with Ly clouds at (see a dip around 1100Å in the spectrum of HDFS0085 in figure 2). This feature suggests the existence of large amount of neutral hydrogen at toward the direction. We also note that one object among two with probable redshifts, HDFS01295 has an estimated redshift . It is also interesting the existence of HDFS00565 and HDFS00526. They are a pair of galaxies at , the most bright galaxies in our sample galaxies in -band, and they both show a prominent Ly emission, indicating they are experiencing a massive star formation. Because the comoving volume traced by the redshift range is less than 2% of the volume surveyed by the range , the possibility that this concentration is caused by chance is less than if we simply assume that the distribution of sample galaxies are random. From these findings we think that these galaxies would be members of a real galaxy concentration at within a 30 Mpc3 or smaller comoving volume. The sky positions of galaxies in the redshift range are located at the edge of the WFPC2 survey field, and it is possible that this concentration has an extension out of the surveyed area and the number of member galaxies might be larger than currently identified.
Daddi et al. (dad03 (2003)) examined a clustering properties of galaxies with photometric redshift estimates in the catalog by L03, and found a concentration of galaxies with red color () at . If we take account the possible systematic offset of their photometric redshift at (see §3.1), the concentration we found coincide well with that by Daddi et al. (dad03 (2003)), although selected galaxy types would be different from each other.

4 Stellar Populations of Star-forming Galaxies at
4.1 Method
The examination of stellar contents of star-forming galaxies at has a crucial importance on the understanding of their star formation history (SFH), and their connection with galaxy populations at different redshifts. Deep broad-band photometric data obtained by HST/WFPC2 (Casertano et al. cas00 (2000)) and VLT/ISAAC (L03) covers a rest-frame wavelength range from 750Å to 5700Å for a galaxy at with 7 bands, with which we can constrain some parameters of their stellar contents, such as stellar mass, SFH and amount of dust attenuation, with reasonable accuracy. In table 2 we list the six colors and and -band magnitudes for spectroscopic sample galaxies.
We used a population synthesis and evolution code PÉGASE version 2 (Fioc and Rocca-Volmerange fio97 (1997)) for generating a set of template galaxy spectra. The initial mass function adopted is that by Salpeter (sal55 (1955)) with a mass range of 0.1 – 120 . Two types of SFHs were considered, namely, a constant star-formation rate (SFR) and an exponentially decaying SFR. 111 For exponential SFH, four different values of the decaying timescale (10Myr, 50Myr, 100Myr, 1Gyr) were adopted. In order to model different chemical enrichment histories, three different SFRs relative to the total amount of baryons within a galaxy (consuming , , or of total baryons per Myr) were considered in constant SFR models. PÉGASE version 2 takes chemical evolution into account. We started calculations of synthetic spectra of stellar populations from zero-metal gas. The metallicity of interstellar gas of model galaxies at fitted ages is sub-solar. Although the measurements of the metallicity of LBGs still have large uncertainties, roughly a half Solar metallicity has been suggested (Pettini et al. pettini01 (2001)). Thus we think metallicity of our template spectra does not conflict with observations. We also calculated spectra of galaxies forming from solar initial metallicity, in order to examine the effect of metallicity on derived parameters of stellar populations. Stellar mass, ages and dust attenuation obtained using such high metallicity models did not change so much from results with low metallicity models; ages were a few dex younger and was 0.1–0.2 smaller, but stellar mass did not change significantly. So we think metallicity is not a dominant source of uncertainty in the estimation of stellar populations.
The procedures for finding the best-fitted models and estimating confidence levels we adopted are same as those made by previous authors (e.g., Papovich et al. pap01 (2001)). The outputs at 26 time steps from 10 Myr to 2.5 Gyr were used for fitting with observed SEDs of 13 sample galaxies (11 with firm and 2 with probable redshifts). Before executing the fitting, the absorption by intergalactic neutral hydrogen for each redshift of the object was applied, using analytic formula in Inoue et al. (ino05 (2005)). We also varied the amount of attenuation caused by dust within galaxies, from to 1.5 with a step of 0.01, by adopting an attenuation law proposed by Calzetti et al. (cal00 (2000)). For each template SEDs the normalization factor which minimize the static were explored. The is defined as
| (1) |
where , and are observed flux, model flux and estimated observational error in band , respectively, and is the normalization factor. As observational errors we only included photometric errors listed in the catalogs. We also tested cases which incorporated additional errors possibly associated with systematic differences between observing bands. Although the resulting values were reduced in the latter procedure, the changes in best-fitting parameters and confidence levels were insignificant. For objects with Ly emission line, flux densities attributed to Ly line were estimated from our spectra and they were removed from -band and / or -band flux densities. For each galaxy we recorded the values calculated for all models, and found the best-fit model which returned the minimum value.
The 68% confidence levels were calculated by a Monte Carlo resampling. We randomly perturbed the observed fluxes, assuming the gaussian distribution of errors. The amount of the perturbations were adjusted to match the photometric errors. We executed the SED fitting for the set of perturbed flux densities, and the resulting SED parameters were recorded. The test was repeated 1,000 times for each of sample galaxy. Then value to contain 68% of these simulated data were derived. This value was used to determine the range of model parameters for each object with 68% confidence level, by selecting models which return values smaller than that for unperturbed object fluxes. We also tested another way of the confidence level estimation with fixed values (i.e., without Monte Carlo resampling) following Avni (av76 (1976)). The area sizes covered by 68% confidence levels are smaller than those through Monte Carlo resampling in most cases, while for fainter objects the area sizes are comparable. Hereafter we use the 68% confidence level areas estimated with Monte Carlo resampling as typical errors in our SED fitting.
4.2 Results
In Fig. 6 and 7 we show the results of SED fitting. In table 3 we summarized results in case of constant SFRs and initial metal-free gas. Fig. 6 shows the age from the onset of the star formation activity and the amount of dust attenuation (in unit of color excess ). The choice of SFH (constant or exponentially decaying) does not make a large difference in estimated ages and amount of dust attenuation for most cases. The median age and color excess of sample galaxies are 130 Myr and for constant SFH, and 80 Myr and for exponentially-decaying SFH. When using exponentially-decaying SFHs, the best-fit decaying time scales are comparable to the age estimates. The median values of dust attenuation we derived are slightly larger than the value in some of previous studies (; e.g., Shapley et al. shap01 (2001); Steidel et al.ste99 (1999); but our values are consistent with those by Sawicki and Yee sy98 (1998)). We think the relatively smaller amount of dust attenuation in LBGs studied by Steidel and co-workers are due to their choice of filter set and color criteria. Their LBG selection criteria in and color diagram preferentially select galaxies with (see figure 2 in Steidel et al. ste03 (2003)). The estimated values of and the distribution of our sample galaxies in two-color diagram are consistent with each other (see figure 1).
In Fig. 7 the stellar mass estimates are plotted along the estimated ages. The difference of stellar mass due to the choice of SFH is again small: the median value of stellar mass is and for constant SFH and exponentially-decaying SFH, respectively. The one object which has times smaller stellar mass compared to other objects is HDFS0271. Because the -band magnitude of the objects is about 2 magnitude fainter than the average of -band magnitude of other objects, smaller stellar mass estimate for this galaxy is reasonable.


The properties of stellar populations in our sample galaxies obtained by the SED fitting analyses are broadly consistent with the results of previous studies for LBGs at (e.g., Sawicki and Yee sy98 (1998); Shapley et al. shap01 (2001); Papovich et al. pap01 (2001)).
A critical argument over the estimates of stellar populations in high-redshift galaxies through the SED fitting technique is that there might be a missing old stellar population which is not dominant in the wavelength range used for the fitting but contains significant mass of low-mass stars. In order to explore such possibility, we also tested a SED fitting with model spectra which incorporate two components of stellar populations. One is a single-age stellar population burstly formed in 2 Gyr ago ( for an object at ), and the other is a stellar population formed by a constant star formation. The age and SFR of the latter were changed in a same way as we did in the fitting with a single component. The ratio of total baryonic mass (including both stellar and gaseous mass) for old and constant components within a model galaxy were changed from 1:100 to 10:1. By this test we intended to estimate the maximal amount of old stellar component which reasonably agrees with observations. For about half sample galaxies the best-fitted models were those with less than 10% of the total stellar mass was coming from old component. For three cases (namely HDFS 0085, 1590 and 0001) which have stellar mass of the old component larger than those from constant SF component, the total stellar mass becomes 3–5 times larger than the results with single component fitting. From this test we confirmed the results by Papovich et al. (pap01 (2001)); the amount of old stellar population laying under the young, UV-bright stars seems to be not so large in the best-fitted models. Barmby et al. (bar04 (2004)) reported the first result of SED fitting for LBGs using mid-infrared observation executed by IRAC on borad the Spitzer Space Telescope, in addition to optical and near-infrared photometry. They argue that the stellar mass and age estimates made with and without mid-infrared (rest-frame near-infrared) do not differ significantly. This result also supports the idea that LBGs at have relatively small amount of old stellar population. Shapley et al. (shap05 (2005)) confirmed the insensitivity of best-fit stellar mass estimates to the inclusion of rest-frame near-infrared photometry for a sample of UV-luminous star-forming galaxies at . However, they argued that, by considering the maximal amount of old stellar components, the upper limit to stellar mass for some of star-forming galaxies can be times larger than the best-fitted values with the constant star formation models. In our SED fitting results we explored the 68% confidence levels of stellar mass constraints in the same way as §4.1. The stellar mass of the old stellar components can be 2–20 times larger than the best-fitted ones, and in five cases old stellar components can dominate % of the total stellar mass. Thus although from best-fitted models the amount of old stellar component is suggested to be small in most cases, our constraints on mass contribution from the old component are not strong.
We should also note that the error in estimating dust attenuation is another possible source of uncertainty in SED fitting. The best way of estimating dust attenuation would be through the flux ratio of far-infrared emission to UV radiation (e.g. Witt & Gordon witt00 (2000); Buat et al. buat05 (2005)) even for UV-selected samples like LBGs. Burgarella et al. (burg05 (2005)) performed a SED analysis of nearby galaxies selected by UV or FIR fluxes in Buat et al. (buat05 (2005)). They show that the amount of dust attenuation evaluated without the far infrared information can be wrong by up to 1 magnitude for UV-selected galaxies and up to 3 magnitudes for FIR-selected galaxies. The uncertainty of 1 magnitude on the UV attenuation leads to the uncertainty of 0.1 magnitude on for the Calzetti’s law. Moreover, it seems that the dust attenuation law varies in the slope and in the strength of the 2175Å bump from a galaxy to a galaxy. It would enlarge the uncertainty of . Such a variation of the attenuation law depending on the galaxy type was examined by Inoue (ino05b (2005)) theoretically. He suggest that the Calzetti’s law is realized in a large density medium which is favorable to starburst galaxies like LBGs. If it is true, the assumption of the Calzetti’s law is valid, although we need more investigations in this topic, especially with the data of the dust infrared emission.
Shapley et al. (shap01 (2001)) examined the correlation between the properties of stellar population and spectroscopic features for LBGs at . They found that galaxies with young age (, best fit age from the onset of the star formation, is shorter than or equal to 35 Myr) preferentially show broad Ly absorption line and strong low-ionization interstellar lines (such as Si ii and C ii), while old ( 1 Gyr) have strong Ly emission lines and weaker interstellar lines. We examined the relationship between spectroscopic features and parameters of best-fitted stellar population models in our 13 spectroscopic sample. We did not find any clear correlation between the Ly emission, Ly equivalent widths and the results of SED fitting. The absence of any clear trend may be attributed to the small number of sample galaxies in our study; the number of galaxies with spectroscopic identifications in Shapley et al. (shap01 (2001)) is 81, which is more than six times larger than ours.
5 Discussion: Comparison with distant red galaxies at
Franx et al. (frx03 (2003)) used deep near-infrared images obtained by FIRES to select galaxies which have photometric redshifts larger than 2 and have larger than 2.3 (Vega) in the HDF-S. They claimed that the red colors of these galaxies might be caused by the 4000 Å break and bright -band color would indicate the existence of massive stellar population. They also roughly estimated the number density of these “distant red galaxies” (hereafter DRGs) and suggested that they might be as abundant as half the number density of LBGs.
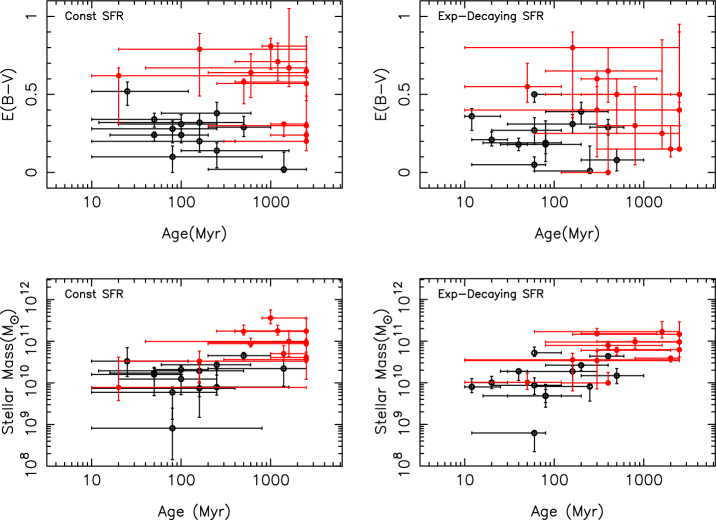
We compared the properties of stellar population of our sample of star-forming galaxies and DRGs. For this purpose we applied a SED fitting procedure for the 13 DRGs with in the HDF-S. The method is exactly same as that we called “one-component fitting” in section 4, except that redshifts we used for DRGs were photometric ones derived by L03. As we noted in section 3.1, there might be systematic offsets in photometric redshift estimates by L03. To examine the effect of this redshift uncertainty in analyses of stellar contents, we executed a test in which we adopted redshifts smaller than phot-z estimates. The estimated amount of dust attenuation did not change significantly and for stellar masses, SFRs and ages differences were less than 50%, mostly smaller than 30%. We also tested fitting with “two-components”, i.e., a maximally old stellar population plus that with constant SFRs, and resulting parameters such as stellar masses and dust attenuation in young component were not so different from those by one-component fitting. Both constant and exponentially-decaying SFHs with various timescales were tested. We show estimated ages (from the onset of star formation), dust attenuation and stellar mass in figure 8. As we did for LBG sample, we tested models with solar initial gas metallicity as well as those formed from metal-free gas, and found that differences in obtained parameters were smaller than 68% confidence ranges. As seen in the figure, the ages of DRGs are hardly constrained. The 68% confidence range of estimated ages for some objects even span over an order of magnitude. Such less accurate age estimates for DRGs as compared with those for LBGs would be attributed to DRGs’ optical faintness. Also DRGs are relatively abundant in low-mass stellar population, which is less sensible for ages. Given the large uncertainty of age estimation, the best-fitted ages of DRGs are on average larger than those of LBGs. The median age of our DRG sample is 1.6 Gyr, several times longer than that of LBGs. The amount of dust attenuation is also systematically larger for DRGs. Although we mentioned before (section 4.2), the use of single attenuation law may lead the error of 0.1 mag in the estimation of , for LBGs best fitted values of are always not larger than 0.5, while for DRGs often exceeds 0.5. So a systematic difference between for LBGs and DRGs seen in figure 8 would be real.
The errors of estimated stellar mass derived from Monte-Carlo resampling were smaller than 0.3 dex, regardless of large uncertainty of age estimates. It is because stellar mass is largely dependent on the fluxes in the near-infrared (rest-frame optical) wavelengths. The stellar mass of DRGs are – , and the median value is for the constant SFR models. DRGs have systematically larger stellar masses than our sample LBGs. We should beware that, unlike the DRG sample, our LBG sample is not complete in -band magnitude. Thus with current data set we cannot exclude the possible existence of LBGs which are missed in our sample due to the faintness in rest-frame UV and have stellar mass comparable to DRGs. On the other hand, SFRs of DRGs are fairly large and comparable to those of LBGs: in the case of constant SFR models, all best-fit models have a few tens to a few hundreds per year. In the case of exponentially-decaying SFH, 7 among 13 have on-going SFRs larger than 10 per year and three among the remaining six objects have SFR in units of per year.
These results of SED fitting imply that many of DRGs are not passively evolving galaxies. DRGs would be more likely dusty galaxies with relatively large SFRs, and they have already accumulated stellar mass more than . These results of SED fitting for DRGs are consistent with some recent studies by other investigators. Förster Schreiber et al. (fs04 (2004)) used a sample of DRGs from MS 105403 field as well as HDF-S for SED fitting using template spectra generated with a population synthesis code by Bruzual and Charlot (bc03 (2003)). The parameters of stellar populations they obtained agree well with ours.
If the number density of DRGs is as large as a half of LBGs’ number density, the stellar mass density at based on UV-selected galaxies would be significantly underestimated. Indeed, predictions based on cosmological numerical simulations have suggested the stellar mass density at redshifts larger than 2 is larger than observational estimations using UV-selected sample (e.g., Nagamine et al. nag04 (2004)). However, because near-infrared surveys deep enough to detect DRGs are still covers only a tiny area of the sky (smaller than several tens of square arcmin), uncertainty due to the cosmic variance would be large. In addition, they are faint in optical wavelengths and spectroscopic follow-up observations are much difficult than LBGs. Upcoming wide-field near-infrared instruments would much broaden survey area and increase the number of spectroscopically identified DRGs, which would be indispensable to derive reliable number density of DRGs.
6 Summary and Conclusions
We made an optical spectroscopy of star-forming galaxies in the Hubble Deep Field - South with photometric redshift estimated to be at . Five firm redshifts and two probable redshifts have been newly determined in addition to the confirmations of six galaxies with previously known redshifts. Six objects among them lie within 30 Mpc3 comoving volume, suggesting the existence of a galaxy concentration.
We investigated stellar populations of sample galaxies using optical to near-infrared broad-band imaging data. By the comparisons with template spectra we obtained best-fit parameters. Typical ages are 20–200 Myr, and stellar mass is (0.5–5) . These results are consistent with previous studies on stellar populations of LBGs, and we confirmed that stellar content of UV selected star-forming galaxies are dominated by young, massive stars and dust attenuation is smaller than . We found no significant correlation between properties of stellar populations and UV spectral features, in our 11 confirmed and 2 possible sample galaxies.
A comparison of stellar contents in LBGs and DRGs in the HDF-S were also made. We found that DRGs tend to have larger values than our UV-luminous LBGs for stellar masses and dust attenuation, and that SFRs in many of DRGs and LBGs are comparable. Majority of DRGs would be one of the most massive, actively star-forming populations at . If the number density of DRGs is comparable with that of LBGs, current estimates of cosmic star formation rates and stellar mass density at based on UV-selected sample would be largely underestimated. To reach a rigid conclusion of the comparison between LBGs and DRGs and to draw a complete picture of the galaxy evolution in a high-redshift, we need deep and wide surveys in near-infrared wavelengths.
Acknowledgements.
We thank Veronique Buat, Jean-Michel Deharveng and Tsutomu Takeuchi for valuable discussions and encouragements. II was supported by a Research Fellowship of the Japan Society for the Promotion of Science for Young Scientists. AKI is supported by the JSPS Postdoctral Fellowships for Research Abroad. In the first phase of this work, AKI was invited to the Laboratoire d’Astrophysique de Marseille and was financially supported by the Observatoire Astronomique de Marseille-Provence. Finally, we wish to thank the anonymous referee who gave us valuable comments.References
- (1) Ando, M. et al. 2004, ApJ, 610, 625
- (2) Avni, Y. 1976, ApJ, 210, 642
- (3) Barmby, P. et al. 2004, ApJS, 154, 97
- (4) Bruzual, A.G. and Charlot, S. 2003, MNRAS, 344, 1000
- (5) Buat, V. et al. 2005, ApJ, 619, L51
- (6) Burgarella, D., Buat, V. and Iglesias-Páramo, J. 2005, MNRAS, in press (astro-ph/0504434)
- (7) Calzetti, D., Armus, L., Bohlin, R. C., Kinney, A. L., Koornneef, J., and Storchi-Bergmann, T. 2000, ApJ, 533, 682
- (8) Casertano, S., De Mello, D., Dickinson, M., et al. 2000, AJ, 120, 247
- (9) Chen, H.-W. and Marzke, R.O. 2004, ApJ, 615, 603
- (10) Coleman, G.D., Wu C-C., Weedman D.W. 1980, ApJS, 43, 393
- (11) Cristiani, S., Appenzeller, I., Arnouts, S. et al. 2000, A&A, 359, 489
- (12) Daddi, E. et al. 2003, ApJ, 588, 50
- (13) Daddi, E. et al. 2004, ApJ, 600, L127
- (14) Fernández-Soto, A., Lanzetta, K.M., and Yahil, A. 1999, ApJ, 513, 34
- (15) Fioc, M., and Rocca-Volmerange, B. 1997, A&A, 326, 950
- (16) Förster Schreiber, N.M., van Dokkum P.G., Franx, M., et al. 2004, ApJ, 616, 40
- (17) Foucaud, S. et al. 2003, A&A, 409, 835
- (18) Franx, M., et al. 2003, ApJ, 587, L79
- (19) Inoue, A.K., 2005, MNRAS, 359, 171
- (20) Inoue, A.K., Iwata, I., Deharveng, J.-M. et al. 2005, A&A, 435, 471
- (21) Iwata, I., et al. 2003, PASJ, 55, 415
- (22) Labbé, I., Franx, M., Rudnick, G., et al. 2003, AJ, 125, 1407 (L03)
- (23) Lehnert M.D. and Bremer M. 2003, ApJ, 593, 630
- (24) Madau, P. 1995 ApJ, 441, 18
- (25) Madau, P., et al. 1996, MNRAS, 283, 1388
- (26) Meuer, G.R., Heckman, T.M., and Calzetti D. 2001, ApJ, 521, 64
- (27) Nagamine, K. et al. 2004 ApJ, 610, 45
- (28) Ouchi, M. et al. 2004 ApJ, 611, 660
- (29) Papovich C., et al. 2001 ApJ, 559, 620
- (30) Pettini M., et al. 2001 ApJ, 554, 981
- (31) Rigopoulou D., et al. 2005, A&A, in press (astro-ph/0501219)
- (32) Salpeter, E.E. 1955, ApJ, 121, 161
- (33) Sawicki, M., and Mallén-Ornelas, G. 2003, AJ, 126, 1208
- (34) Sawicki, M., and Yee, H.K.C. 1998, AJ, 115, 1329
- (35) Shapley, A.E. et al. 2001, ApJ, 562, 95
- (36) Shapley, A.E. et al. 2003, ApJ, 588, 65
- (37) Shapley, A.E. et al. 2005, ApJ, in press (astro-ph/0503485)
- (38) Steidel, C.C., et al. 1996, ApJ, 462, L17
- (39) Steidel, C.C., et al. 1999, ApJ, 519, 1
- (40) Steidel, C.C., et al. 2003, ApJ, 592, 728
- (41) Teplitz H.I., et al. 2000, ApJ, 542, 18
- (42) Vanzella, E., et al. 2002, A&A, 396, 847
- (43) Vanzella, E., Cristiani, S., Fontana, A. et al. 2004, A&A, 423, 761
- (44) Williams, R.E., et al. 1996, AJ, 112, 1335
- (45) Witt A.N., Gordon K.D. 2000, ApJ, 528, 799
- (46) Yahata N., Lanzetta K.M., Chen H.-W., et al. 2000, ApJ, 538, 493
| Ly | |||||||
|---|---|---|---|---|---|---|---|
| ID | Designation | FWHM | EW | ||||
| 00565 | HDFS J223249.40603226.3 | 22.928 | 22.679 | 3.00 | 2.789 | 4.3 | 10.5 |
| 00526 | HDFS J223249.18603226.0 | 23.293 | 22.706 | 3.00 | 2.789 | 4.3 | 10.5 |
| 01655 | HDFS J223255.75603333.8 | 23.488 | 23.590 | 3.40 | – | – | – |
| 00059 | HDFS J223256.38603144.3 | 23.953 | 23.450 | 3.62 | 2.945 | abs | abs |
| 00085 | HDFS J223246.91603146.9 | 24.064 | 23.192 | 3.30 | 3.170 | 6.0 | 29.9 |
| 01590 | HDFS J223304.90603330.7 | 24.156 | 23.340 | 2.82 | 2.364 | abs | abs |
| 00153 | HDFS J223248.86603154.3 | 24.349 | 22.538 | 3.00 | 2.794 | abs | abs |
| 01295 | HDFS J223253.43603312.2 | 24.542 | 23.464 | 3.14 | (2.798) | abs | abs |
| 02376 | HDFS J223254.17603409.1 | 24.594 | 23.749 | 2.70 | 2.408 | 4.8 | 10.0 |
| 00066 | HDFS J223249.26603145.0 | 24.607 | 23.076 | 3.14 | 2.801 | abs | abs |
| 01983 | HDFS J223254.25603350.6 | 24.616 | 23.862 | 3.62 | – | – | – |
| 01825 | HDFS J223252.03603342.6 | 24.643 | 23.800 | 3.42 | 3.275 | 3.3 | 5.9 |
| 00704 | HDFS J223248.37603237.9 | 24.737 | 22.780 | 3.00 | – | – | – |
| 00001 | HDFS J223305.01603427.8 | 24.760 | 21.916 | 4.34 | (2.472) | 5.7 | 43.2 |
| 00515 | HDFS J223252.02603224.1 | 24.895 | 23.318 | 3.24 | – | – | – |
| 01298 | HDFS J223251.44603314.9 | 25.001 | 24.004 | 2.90 | – | – | – |
| 00708 | HDFS J223252.22603237.2 | 25.167 | 23.771 | 2.54 | – | – | – |
| 01512 | HDFS J223253.12603320.3 | 25.228 | 22.999 | 3.00 | 2.670 | abs | abs |
| 00591 | HDFS J223254.13603230.0 | 25.255 | 24.479 | 3.08 | – | – | – |
| 01411 | HDFS J223245.41603320.3 | 25.270 | 24.614 | 3.58 | – | – | – |
| 02649 | HDFS J223303.59603426.5 | 25.348 | 23.835 | 3.00 | – | – | – |
| 00271 | HDFS J223249.47603202.1 | 25.449 | 25.432 | 2.92 | 2.806 | 3.9 | 26.2 |
| 00326 | HDFS J223250.11603206.6 | 25.530 | 24.731 | 2.74 | – | – | – |
| 02032 | HDFS J223303.01603353.7 | 25.559 | 22.927 | 2.50 | – | – | – |
| 10570 | HDFS J223305.43603342.7 | 26.017 | 24.225 | 3.26 | – | – | – |
| ID | |||||||||
|---|---|---|---|---|---|---|---|---|---|
| 00565 | 22.928 | 22.679 | 3.677 | 0.467 | 0.196 | 0.155 | 2.789 | ||
| 00526 | 23.293 | 22.706 | 3.657 | 0.523 | 0.185 | 0.121 | 0.524 | 0.007 | 2.789 |
| 00059 | 23.953 | 23.450 | 2.765 | 0.937 | 0.464 | 0.012 | 0.527 | 0.263 | 2.945 |
| 00085 | 24.064 | 23.192 | 1.541 | 0.658 | 0.168 | 0.478 | 1.134 | 0.939 | 3.170 |
| 01590 | 24.156 | 23.340 | 3.211 | 0.200 | 0.112 | 0.176 | 0.516 | 0.039 | 2.364 |
| 00153 | 24.349 | 22.538 | 4.150 | 0.565 | 0.192 | 0.725 | 1.089 | 0.181 | 2.794 |
| 01295 | 24.542 | 23.464 | 2.733 | 0.783 | 0.272 | 0.449 | 0.813 | 0.247 | (2.798) |
| 02376 | 24.594 | 23.749 | 2.273 | 0.403 | 0.163 | 0.345 | 0.556 | 0.077 | 2.408 |
| 00066 | 24.607 | 23.076 | 2.353 | 0.656 | 0.299 | 0.696 | 0.912 | 0.238 | 2.801 |
| 01825 | 24.643 | 23.800 | 2.431 | 0.830 | 0.207 | 0.250 | 0.764 | 0.525 | 3.275 |
| 00001 | 24.760 | 21.916 | 1.608 | 0.444 | 0.662 | 1.722 | 1.071 | 0.435 | (2.472) |
| 01512 | 25.228 | 22.999 | 3.402 | 0.828 | 0.360 | 1.161 | 1.046 | 0.147 | 2.670 |
| 00271 | 25.449 | 25.432 | 1.994 | 0.253 | 0.171 | 0.248 | 0.415 | 2.806 |
| age (Myr) | Stellar Mass () | SFR (/year) | ||||||||||
|---|---|---|---|---|---|---|---|---|---|---|---|---|
| ID | best | min | max | best | min | max | best | min | max | best | min | max |
| 0565 | 50 | 16 | 100 | 0.24 | 0.20 | 0.26 | 1.73e+10 | 7.55e+09 | 2.24e+10 | 3.79e+02 | 2.34e+02 | 5.13e+02 |
| 0526 | 100 | 50 | 200 | 0.24 | 0.19 | 0.28 | 2.09e+10 | 1.62e+10 | 2.56e+10 | 2.40e+02 | 1.41e+02 | 3.72e+02 |
| 0059 | 50 | 10 | 100 | 0.34 | 0.29 | 0.38 | 1.59e+10 | 4.94e+09 | 2.38e+10 | 3.50e+02 | 1.96e+02 | 6.24e+02 |
| 0085 | 1400 | 200 | 2500 | 0.02 | 0.00 | 0.13 | 2.21e+10 | 8.34e+09 | 4.41e+10 | 2.10e+01 | 1.70e+01 | 5.50e+01 |
| 1590 | 160 | 10 | 400 | 0.20 | 0.13 | 0.28 | 7.45e+09 | 1.48e+09 | 1.06e+10 | 5.50e+01 | 2.80e+01 | 1.99e+02 |
| 0153 | 500 | 200 | 1000 | 0.29 | 0.23 | 0.36 | 4.52e+10 | 3.62e+10 | 5.38e+10 | 1.15e+02 | 6.58e+01 | 2.33e+02 |
| 1295 | 100 | 20 | 250 | 0.31 | 0.24 | 0.37 | 1.24e+10 | 5.25e+09 | 1.55e+10 | 1.42e+02 | 6.90e+01 | 2.98e+02 |
| 2376 | 80 | 10 | 250 | 0.28 | 0.19 | 0.33 | 5.95e+09 | 1.34e+09 | 8.02e+09 | 8.40e+01 | 3.35e+01 | 1.93e+02 |
| 0066 | 160 | 12 | 500 | 0.32 | 0.24 | 0.38 | 1.95e+10 | 4.65e+09 | 2.86e+10 | 1.44e+02 | 6.20e+01 | 3.78e+02 |
| 1825 | 250 | 100 | 1600 | 0.14 | 0.03 | 0.19 | 7.93e+09 | 5.12e+09 | 2.10e+10 | 3.85e+01 | 1.50e+01 | 6.70e+01 |
| 0001 | 25 | 10 | 120 | 0.52 | 0.43 | 0.58 | 3.33e+10 | 1.42e+10 | 7.03e+10 | 1.39e+03 | 5.21e+02 | 1.77e+03 |
| 1512 | 250 | 60 | 600 | 0.38 | 0.30 | 0.45 | 2.72e+10 | 1.54e+10 | 3.37e+10 | 1.32e+02 | 6.15e+01 | 3.09e+02 |
| 0271 | 80 | 10 | 800 | 0.10 | 0.00 | 0.17 | 8.14e+08 | 1.44e+08 | 2.47e+09 | 1.15e+01 | 4.00e+00 | 3.15e+01 |