The photometric evolution of FU Orionis objects: disc instability and wind-envelope interaction
Abstract
We present the results of a photometric monitoring campaign of three well studied FU Orionis systems (FU Orionis, V1057 Cygni and V1515 Cygni) undertaken at Maidanak Observatory between 1981 and 2003. When combined with photometric data in the literature, this database provides a valuable resource for searching for short timescale variability - both periodic and aperiodic - as well as for studying the secular evolution of these systems. In the case of V1057 Cyg (which is the system exhibiting the largest changes in brightness since it went into outburst) we compare the photometric data with time dependent models. We show that prior to the end of the ‘plateau’ stage in 1996, the evolution of V1057 Cyg in the colour-magnitude diagram is well represented by disc instability models in which the outburst is triggered by some agent - such as an orbiting planet - in the inner disc. Following the end of the plateau phase in 1996, the dimming and irregular variations are consistent with occultation of the source by a variable dust screen, which has previously been interpreted in terms of dust condensation events in the observed disc wind. Here we instead suggest that this effect results from the interaction between the wind and an infalling dusty envelope, the existence of this envelope having been previously invoked in order to explain the mid infrared emission of FU Orionis systems. We discuss how this model may explain some of the photometric and spectroscopic characteristics of FU Orionis systems in general.
keywords:
stars: pre-main-sequence – stars: circumstellar matter – stars: individual: FU Ori, V1057 Cyg, V1515 Cyg – stars: winds – accretion, accretion discs1 Introduction
Despite being a rather small class of young stellar objects, the outbursting FU Orionis systems have been studied extensively over the last 20 years, since they represent an interesting “laboratory” to study the accretion process on newly born stars and the interaction between the protostar and its environment. In fact, according to the most popular interpretation (Hartmann & Kenyon, 1996), their outbursts are associated with episodes of enhanced accretion through an otherwise “normal”, T Tauri like, protostellar disc (see, however, Herbig et al. 2003 for a dissenting view). Support to this interpretation comes mainly from the modeling of the broad band Spectral Energy Distribution (SED) in terms of accretion disc SEDs, from their apparent spectral type, which is characterized by high effective temperatures at smaller wavelength and by lower effective temperatures at larger wavelengths, and from the shape of some optical and near-infrared absorption lines, which show the typical double peak expected from a rotating disc (Hartmann & Kenyon, 1985, 1987; Kenyon et al., 1988).
The time evolution of the outbursts may vary considerably from object to object. If we refer to the three best studied objects (FU Ori itself, V1057 Cyg and V1515 Cyg, the only ones for which a detailed light curve has been recorded since the beginning of the outbursts), it can be seen that while for some of them (FU Ori and V1057 Cyg) the transition to the outburst phase is rather abrupt (with rise timescale of the order of 1 yr), for V1515 Cyg it is considerably more gentle (rise timescale yrs). The post-outburst light curve is also quite different for different objects: while FU Ori has remained almost steadily in the high luminosity state for at least 70 yrs, V1057 Cyg has faded rapidly (with a timescale of roughly 10 yrs) and then showed a “plateau” in the light curve, until eventually undergoing an abrupt luminosity drop in the mid 90s, followed by a rather erratic photometric variability. V1515 Cyg, on the other hand (which is characterized by a smaller peak luminosity with respect to the other two), while remaining overall in the high luminosity state, has often shown strong photometric variability. It would then appear to be difficult to reconcile this wide variety of behaviours within a single model.
However, the differences in rise timescales can be understood when one considers the detailed outburst mechanism. This is generally considered to be due to the onset of a thermal instability in a protostellar disc fed at a high enough rate (Bell & Lin, 1994), a mechanism analogous to the one considered in dwarf novae outbursts. In this picture, partial ionization of hydrogen in the inner disc gives rise to a thermal instability and to a limit cycle behaviour, that can be able to reproduce repetitive outbursts. It can be shown (Lin et al., 1985) that outbursts initiated at the inner edge of the disc propagate inside-out, resulting in a long rise timescale, while outbursts triggered somehow far from the inner edge are characterized by short rise timescales. It is then possible to associate the long rise timescale of V1515 Cyg to a non-triggered outbursts, and the fast rise in V1057 and FU Ori to a triggered one. Models of triggered outbursts have been constructed, both in the case where the outburst is artificially triggered (Clarke et al., 1990; Bell et al., 1995), and where the trigger is provided by the interaction between the disc and an embedded massive planet (Clarke & Syer, 1996; Lodato & Clarke, 2004).
The environment of FU Orionis objects shows further complexities: there is, in fact, substantial evidence for the presence of an infalling envelope, a bipolar jet and strong mass loss in the form of a disc wind.
The best evidence for the presence of an envelope is represented by the mid and far infrared SED, that shows a significant excess with respect to the predictions of standard accretion disc models (Kenyon & Hartmann 1991, henceforth KH91). In many cases, even the inclusion of reprocessing of the inner disc luminosity by an outer, flared disc is not sufficient, because it would require too large degree of flaring. Even though different possible explanations for this long-wavelength excess have been discussed (Lodato & Bertin, 2001; Ábrahám et al., 2004), it is commonly attributed to reprocessing from a dusty infalling envelope, whose inner radius should be located at au from the central source (KH91). This model however, requires the presence of a cavity in the envelope through which the central optical source is seen. This cavity can be produced by a bipolar jet (typically observed also in many T Tauri stars). The presence of spatially separated knots in the jets of many Herbig-Haro objects has been indeed interpreted as due to recurrent FU Orionis activity in young stellar objects (Reipurth & Aspin, 1997).
Strong winds have been observed in FU Orionis objects using a variety of different tracers: optical and near-infrared lines (Croswell et al., 1987), that show the characteristic P Cygni profile, lower excitation lines of neutral metals and TiO bands (Hartmann & Kenyon, 1996) and even continuum radio observations (Rodriguez & Hartmann, 1992). Typical wind velocities are observed to be in the range km/sec and mass loss rates are observed to vary between different objects, being very large for FU Ori () and roughly one order of magnitude smaller for V1057 Cyg during the plateau phase and V1515 Cyg.
In addition, in some cases there is also evidence for the presence of companions: the FU Orionis object Z CMa is a binary system (Koresko et al., 1991), and recently a companion to FU Ori has been found (Wang et al., 2004; Reipurth & Aspin, 2004). Note, however, that this companion is unlikely to be the cause of the outburst, as suggested by Bonnell & Bastien (1992), since its separation ( au) is too large to reproduce the fast rise of the outburst.
In this paper we present the result of a photometric monitoring campaign of three well studied FU Orionis systems (FU Orionis, V1057 Cygni and V1515 Cygni) undertaken at Maidanak Observatory between 1981 and 2003. These new data, combined with historical photometric data, are then used to provide a quantitative test to theoretical models.
In particular, we use a thermal instability model to describe the onset of the outburst and compare the colour evolution predicted by this model to the observations of V1057 Cyg and V1515 Cyg. We obtain a good match to the observations, better than what can be obtained using a series of steady state accretion disc models, as done in the past (KH91). As mentioned above, the long rise time and the colour evolution of V1515 Cyg are well described by non-triggered thermal instability models, whereas the data for V1057 Cyg require a triggered model, where the triggering mechanism is here taken to be the interaction with a small mass companion in the disc (Lodato & Clarke, 2004).
Furthermore, we present a new model of the interaction between the disc wind and the infalling dusty envelope. The main assumption of this model is that the wind strength scales with the luminosity of the disc. We find that sufficiently strong winds (like that of FU Ori) are able to blow the envelope out to large distances, while weaker winds (like the one of V1515 Cyg) do not. For V1057 Cyg, the wind initially is able to blow the envelope away to large distance, but as the luminosity of the disc decreases the envelope falls back to small radii over a timescale of 20 yrs. The dusty envelope provides occultation of the central source. In this way, we are then able to explain the diverse post-outburst photometric variability of the three objects within a single simple model.
The paper is organised as follows. In section 2 we describe our new observations. In section 3 we show the comparison between the observed colour evolution of V1057 Cyg and V1515 Cyg and the one predicted by disc thermal instability models. In section 4 we describe our model for the wind-envelope interaction and in section 5 we draw our conclusions.
2 Observations
2.1 New photometry
The new photometric data for FU Ori, V1057 Cyg and V1515 Cyg presented here were taken at Maidanak Observatory during a long monitoring campaign from 1981 (for FU Ori, from 1984) to 2003, using two 60-cm Zeiss reflectors and the 48-cm AZT-14 reflector equipped with identical photon-counting photometers, which reproduced the Morgan-Johnson system. The observations were carried out by differential method using comparison stars. The rms error of a single measurement was , . Only for FU Ori itself the rms error in was about , whereas for V1057 Cyg and for V1515 Cyg this one was much higher because of their brightness in and we used measurements at only for approximate estimates.
2.2 Long-term light curves
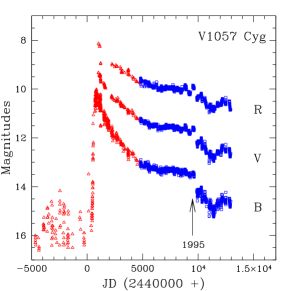
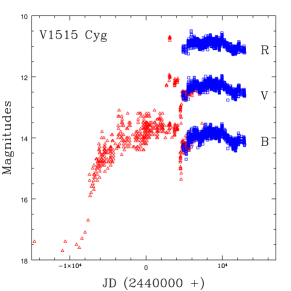
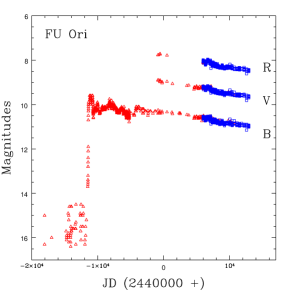
Fig. 1 shows the long-term photometry of the three objects considered combining historical data (red triangles, see caption for references) and our new data (blue squares).
Among the three objects considered, the most interesting long-term behaviour is the one of V1057 Cyg. This star, in fact, is the one which shows the fastest time evolution: from the peak of the outburst in the early ’70s to 2003 its luminosity has decreased by almost 5 magnitudes in and by 4 magnitudes in . Its photometric behaviour after the outburst can be divided in three phases: a period of rather steep decrease of brightness, a “plateau” phase, and a period of smooth variability after a sharp drop in luminosity in 1995. Maidanak photometry provides a good coverage of these two last parts of the light curve. The long-term strong evolution of the system makes it an ideal candidate to test evolutionary outburst models. We have performed this test by comparing theoretical models to the colour-magnitude diagrams (Fig. 7), discussed below in Section 3.
After the luminosity drop in 1995, slow year-to-year variability was observed in V1057 (see Fig. 1). Apart from this variability, V1057 also shows smooth variations within one year, but while during the “plateau” phase the maximum amplitude of this variability was about , it increased to after the luminosity drop in 1995. We subtracted long-term variability from the lightcurve between 1995 and 2003 and analysed the residual time series using the Starlink CLEAN algorithm (originally developed by Roberts et al. 1987) to look for periodicity in the short-term variations. Although we detected a period of 150 days during 1995-1999, this period was not present in each of the individual seasons and is, in fact, uncomfortably close to the total duration of each of the seasonal light curves.
V1057 Cyg shows also short-term variability and we analysed the time series to look for short-term periodicity (of order several days) and to test for flickering behaviour. We discuss in more detail this variability in Section 2.3 below.
V1515 Cyg did not show any sharp decrease in luminosity during the last years, but we can see a gradual decrease in brightness during 1996-1999 (see Fig. 1). Short-term luminosity drops have been observed in 1980 and 1987 (see also Kenyon et al. 1991).
During 2000-2003 FU Ori continued a slow decreasing of its brightness (Fig. 1). FU Ori also did not show any sharp luminosity drops in recent years.
For these last two objects, given their small luminosity evolution, a time-dependent theoretical model would be less meaningful than for V1057 Cyg. However, as an example, we have constructed a disc thermal instability model and compared it with observations also for V1515 Cyg and we describe it below in Section 3.
2.3 Short-term variability and flickering
Kenyon et al. (2000) have obtained some evidence for flickering – a non periodic brightness variability with an amplitude of roughly , on timescales of the order of a few days – in FU Ori. We have analysed our data for V1057 Cyg and for V1515 Cyg to look for a similar flickering behaviour.
2.3.1 V1057 Cyg
We have subtracted any long-term variation from each seasonal data set from 1986 to 1990 (i.e. during the photometric “plateau”) by fitting a polynomial to the observed light-curve. We have then analysed all datasets with CLEAN. Only in 1989 (Fig. 2) our analysis indicated the presence of a periodic component with high probability in residual light-curve for data (false alarm probability smaller than 1%). Periodograms suggest a period of days in all three bands, where the error represents the half width half maximum of the periodogram peak.
For all other years, although we observe a variability with amplitude in , no periodicity was detected, as expected for a flickering variability. To verify that these changes in brightness and colours are real, we follow Kenyon et al. (2000) and plot and colours against for 1988 (for which year no periodicity was detected). The variations on short timescales clearly exceed photometric errors and colour changes of clearly correlate with brightness changes (Fig. 3). Although the scatter in the diagram is bigger than in , we can also see some correlation between and (note a similar result also in Kenyon et al. 2000 for FU Ori). Note also that the amplitude of variation in V1057 Cyg is roughly a half of that detected by Kenyon et al. (2000) for FU Ori.


2.3.2 V1515 Cyg
We performed a similar analysis also for V1515 Cyg. After subtracting any long-term evolution we observe a short-term variability with an amplitude in . Analysis with CLEAN only revealed some periodicity on short time-scales from the 1987 season (although with a slightly higher false alarm probability of 1.5 %). As for V1057 Cyg, non-periodic colour variations in correlate well with brightness variations (Fig. 4). Also in this case the scatter in is much larger, but we can still see some correlation in the diagram.
As mentioned above, our analysis indicates a periodic component with high enough probability in residual light curves for data only for the 1987 season. Periodograms suggest a period of days in all three bands (see phased light curves, Fig. 5).


2.4 Correlation between spectral and photometric variability
FU Orionis objects show also a wealth of spectral variations on short timescales (of the order of days). These are reviewed and discussed extensively in Herbig et al. (2003). They include spectral variations of the equivalent width of the H profiles. For example, for FU Ori itself, during 1997-1999 Herbig et al. (2003) detected a variability with a period of roughly 14 days. This kind of variability has also been observed earlier in FU Ori by Errico et al. (2003), but they detected a smaller period of 6 days.
Most noticeably, Herbig et al. (2003) detect a periodic modulation of the double-peaked line profiles in the cross-correlation functions of optical photospheric absorption lines. The periods detected in 1997 are days for FU Ori and days for V1057 Cyg (even if the latter period is more uncertain). Clarke & Armitage (2003) have shown how a periodic modulation of these lines can be due to the presence of a massive planet embedded in the FU Orionis discs. The observed periods in V1057 Cyg and FU Ori would then correspond to an orbit with a semi-major axis of roughly , assuming that the planet is in Keplerian rotation around the host star. This is indeed the distance at which we expect to find a massive planet if it is responsible for triggering the thermal instability in the disc (see Lodato & Clarke 2004 and Section 3 below). Note that the two objects for which this modulation has been observed are fast-rise FU Orionis objects, for which a triggered outburst is needed.
In the model of Clarke & Armitage (2003), however, the spectral variability should not be correlated with any photometric variability. This is because the emission pattern is in this case constant in a frame co-rotating with the putative planet and the modulation in the line profiles arises only from the changing location of the planet’s orbital velocity vector to the line of sight. We have then tested whether there is any correlation between our observed photometric variability and the modulation of the line profiles observed by Herbig et al. (2003) for those periods where our observations overlap with theirs. Fig. 6 shows the results of this analysis for V1057 Cyg, where our luminosity is plotted against coeval radial velocity measurements by Herbig et al. (2003). No clear correlation is indeed found. A similar result holds also for the band.

Our observations of FU Ori do not overlap with those of Herbig et al. (2003), but we used our photometry obtained from 1997 to 1999 to search for periods in the range of a few days on the light curves (i.e. with the same periods as the observed spectroscopic period). The analysis did not reveal any reliable photometric period in this epoch.
3 Photometric evolution: disc thermal instability models
In this section we describe the disc thermal instability models that we have constructed in order to describe the colour evolution of the FU Orionis objects considered. We have considered a triggered outburst for the fast-rise object V1057 Cyg and an untriggered one for V1515 Cyg. We have not considered the case of FU Ori itself for two reasons: firstly its luminosity has changed very little after the outburst (total variation in is approximately one magnitude), secondly, as discussed in more detail in Lodato & Clarke (2004), thermal instability models are generally not able to reproduce such a long lived (more than 70 yrs) outburst.
3.1 The colour evolution of V1057 Cyg
V1057 Cyg is, among all the FU Orionis objects, the one that displays the fastest decay from the outburst phase. In fact, it has faded from the peak bolometric luminosity of to over a timescale of about 20 yrs.
The time evolution of the Spectral Energy Distribution (SED) of V1057 Cyg has been modeled in terms of an accretion disc SED by Kenyon & Hartmann (1991). They compared the observed SED of V1057 Cyg at different epochs with synthetic disc models including reprocessing from an infalling envelope, in order to account for the observed far infrared excess. For each epoch, they assumed the disc to be in a steady state, characterized by a constant mass accretion rate , whose value was chosen so as to match the instantaneous luminosity of the system. They assumed a reddening correction of and found an overall good agreement with the data, except that the models tended to be significantly redder than the observations at early epochs, i.e. close to the luminosity maximum. However, these models are clearly limited by the assumption that at any given epoch the disc is assumed to be in a steady state, whereas it is in fact evolving quite rapidly. In the following we will describe how a better agreement with observations of the colour evolution of V1057 Cyg can be achieved when properly using time-dependent accretion disc models.
We have constructed time dependent 1D accretion disc models to account for the onset and evolution of the outburst, in the framework of the thermal instability model (Clarke et al., 1989, 1990; Bell & Lin, 1994). Full details on the thermal instability model and on our numerical modeling of the outburst can be found in Lodato & Clarke (2004).
V1057 Cyg is one of the fast rise FU Orionis objects. In fact, it shows a rise timescale of the order of one year, comparable to the one of FU Ori, but much shorter than the one of V1515 Cyg ( yrs). We have shown (Lodato & Clarke, 2004) that a fast rising light curve can be obtained if the thermal instability, rather than being initiated at the inner disc radius (as in Bell & Lin 1994 models), is triggered within the disc, at a radius of . Triggered thermal instabilities also result in a much larger amplitude of the outburst, with peak luminosity reaching (to be compared with peak luminosities of obtained in non-triggered outbursts, see Lodato & Clarke 2004). This compares well with the observations, since the fast rise FU Orionis objects (FU Ori and V1057 Cyg) have indeed a larger peak luminosity with respect to V1515 Cyg. It then appears reasonable to describe FU Ori and V1057 Cyg in terms of triggered thermal instability models, and V1515 Cyg in terms of non-triggered models.
Rather than assuming an ad hoc triggering mechanism, as previously done (Clarke et al., 1989; Bell et al., 1995), here we will considered the case where the instability is triggered by the presence of a small mass companion (a massive planet, for example) embedded in the disc.
The details of the planet-disc interaction assumed here, and its inclusion in thermal instability models can be found in Lodato & Clarke (2004). Here we briefly summarize the basic physical mechanism responsible for the triggering. During quiescence, a massive planet (of the order of ) is able to open up a deep gap in the disc and will undergo Type II migration. However, in the case in which the mass of the planet is large compared to the local disc mass,
| (1) |
(where is the position of the planet and is the local disc density), the actual migration timescale is longer than in normal Type II migration, and as a consequence disc material will bank up upstream of the planet, increasing the surface density of the disc and eventually leading to a thermal instability. We have already shown (Lodato & Clarke, 2004) the effectiveness of this model in producing fast rising light curves in FU Orionis objects.
The basic physical parameters that determine the behaviour of the outburst are the mass of the planet and the input mass accretion rate at which the disc is fed by the envelope at large radii, . Additional parameters entering the models are the value of the viscosity parameter , the mass of the central star , and the inner radius of the disc . In the following we will take , and (as customary in thermal instability models) we will assume two different values for on the lower and upper branch of the thermally stable equilibrium curves: we have taken and . We have then varied the value of and of in order to match the observed colour evolution of V1057 Cyg. The best fit models have and . For this choice of parameters the outburst is triggered at , and we obtain a fast-rise outburst with rise timescale of the order of yrs, with a peak luminosity and a peak mass accretion rate of .
At any given time during the outburst, the model provides us with the full surface temperature profile of the disc, from which we can compute the broad band fluxes by simply assuming a blackbody emission from every annulus of the disc. Our models also include the contribution of the central star. This contribution is, however, negligible when compared to the high luminosity arising from the disc. The disc is assumed to be viewed face-on and the distance to V1057 Cyg is assumed to be pc (Kenyon & Hartmann, 1991). Note that (here as in the case of V1515 Cyg, discussed below) a small inclination of , required to fit the broadening of optical absorption lines, can be easily accomodated by changing the assumed distance within the uncertainties (Kenyon et al., 1988). The fluxes have then been reddened assuming a reddening correction of (consistent with the estimate of Bell et al. 1995). The resulting colour evolution in the plane is shown in Fig. 7 with a solid line. The red triangles show the historical data, while the blue squares show our new observations, described above. The dashed line shows the colours of a series of steady state models, with different mass accretion rates. These latter models are similar to those described by Kenyon & Hartmann (1991).
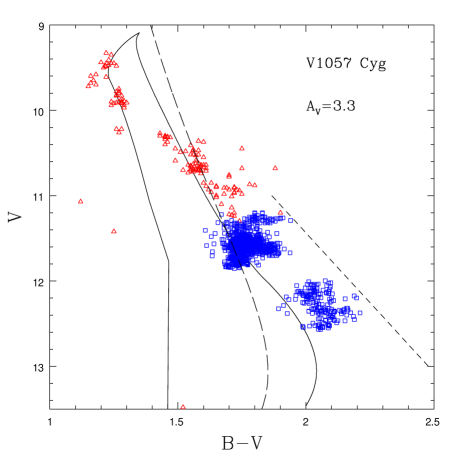
Note that, for a given magnitude, close to the peak of the outburst the time dependent models are bluer than the corresponding steady state model. This is because in the time-dependent case, at the beginning of the outburst, while the unstable front propagates outwards, only the innermost part of the disc are in the high state, while the outer parts, which contribute to longer wavelengths, are still in the low state and therefore have a much lower luminosity with respect to steady state model, that assumes that all the disc is in outburst. In this way, our time dependent model is able to obtain a much better fit to the observations at all epochs during the outburst, while the series of steady states is redder than observed close to the peak of the outburst, as already noted by Kenyon & Hartmann (1991).
Another thing to notice is that the simple viscous disc evolution is not able to account for the recent drop in luminosity occurred in 1995. This is for two reasons: (i) the drop is too abrupt to be due to viscous evolution (see light curve in Fig. 1), (ii) the colour change during the drop cannot be reproduced by the time-dependent models. In fact, all the data points after the drop occupy a different region in the plane with respect to earlier observations (see Fig. 7). The colour variation observed during the luminosity drop is much redder than the one predicted by the viscous evolution model. On the other hand the direction of the colour variation is consistent with a standard interstellar extinction law, adopting (the direction of the extinction vector is indicated with a short-dashed line in Fig. 7). We are therefore led to the conclusion that the recent drop in luminosity is due to a sudden enhancement of the extinction along our line of sight to V1057 Cyg, rather than to the evolution of the outburst (see also Kolotilov & Kenyon 1997). We discuss below in section 4 our wind-envelope interaction model to explain this recent luminosity drop.
3.2 The colour evolution of V1515 Cyg
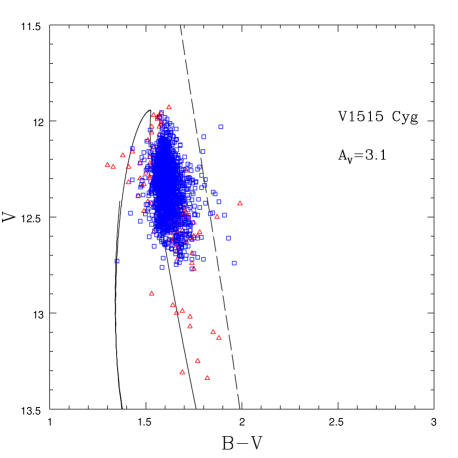
As described above, the long rise time of light curve of V1515 Cyg suggests that in this case the thermal instability is not triggered, but proceeds inside-out, as described by Bell & Lin (1994). We have constructed time dependent models also in this case and compared them to the colour evolution observed in this system. In this case, we have adopted and . We have also assumed . With these, parameters, we obtained a slow-rise outburst, with a peak luminosity of 250 and a peak mass accretion rate . Fig. 8 shows the colour evolution in the plane in this case. V1515 Cyg is assumed to be at a distance of pc, with a face-on disc. The models have been reddened assuming and . The assumed value of is slightly smaller than the one used for V1057 Cyg, consistent with previous estimates (Bell et al., 1995). As before, the solid line shows the result from our time dependent model, while the dashed line show the results from a series of steady state models. The agreement is quite good, also given the little evolution observed in V1515 Cyg.
4 Interaction between disc wind and infalling envelope
4.1 Evidence for wind and envelope components in FU Orionis systems
As mentioned above, it has long been recognised that additional luminosity components are required in order to explain a range of spectral diagnostics. Here we focus on an infalling dusty envelope (invoked by Kenyon & Hartmann 1991 in order to explain the magnitude of the m excess, particularly in V1057 Cyg and V1515 Cyg) and the strong winds in FU Orionis systems (as evidenced by P Cygni profiles and ‘shell’ features in optical spectra). Before proceeding to consider the dynamical interaction between these components, we briefly describe the observational evidence for (and the inferred properties of) each.
KH91 introduced the notion of an infalling envelope in order to explain the magnitude of the far infrared flux (i.e. at m) in FU Orionis systems, which is underpredicted by steady state, flat accretion disc models. Although several other suggestions have been made regarding the origin of the far infrared emission in FU Orionis objects (see, for example, Lodato & Bertin 2001; Ábrahám et al. 2004), the similar fading rates of the optical emission and that in the range m suggests that the latter is derived from reprocessing of optical light (although the near constancy of emission longward of suggests an additional component must supply the longest wavelength emission, see discussion in Ábrahám et al. 2004). The dusty envelope however remains the most likely site of emission in the m range, since alternative scenarios (involving reprocessing in a flared accretion disc) are hard to construct, given the expected curvature of the disc surface in realistic disc models (Bell et al., 1997).
The spectral modeling of KH91 implied that the envelope must subtend a reasonably large solid angle at the source (covering factor ) but that the observer views the source at rather low inclination and thus sees a low optical extinction to the source. This therefore implies that the envelope is somewhat flattened (but not disc like) consistent with the expected morphology for a rotating infalling envelope. KH91 assumed a density profile appropriate to free fall onto a point mass
| (2) |
and adjusted the normalisation (and hence infall rate in the envelope) in order that the flux reprocessed in the optically thin dust envelope matched the spectral energy distribution longward of m. An attractive feature of this modeling was that the inferred infall rate ( yr-1) is of the correct magnitude to trigger thermal instability in the inner disc (see Section 3.1). However, since the disc models can themselves provide the observed flux shortward of m (and are consistent with the temporal behaviour of these wavebands; Ábrahám et al. 2004), the envelope must not make a significant contribution shortward of m. This requirement constrains the inner edge of the envelope to lie at around au from the central source. Since this radius is considerably outside the dust sublimation radius (which, for a central source luminosity of a few hundreds , lies at a distance of au) this begs the question of what prevents the envelope extending to smaller radii.
The presence of the wind is unambiguously indicated by P Cygni profiles in Ca II , Na I and the Balmer lines of hydrogen (Croswell et al., 1987; Hartmann & Calvet, 1995), indicating outflow velocities of up to km s-1. Likewise, lower excitation lines of neutral metals and TiO bands exhibit ‘shell features’, i.e. absorption features displaced by about km s-1 to blueward, which are interpreted as arising from localised condensations in the wind (Herbig et al., 2003; Hartmann et al., 2004). Detailed modeling of these features yield wind mass loss rates which correlate positively with the inferred accretion rate onto the star, as is observed in other classes of young stars (Hartmann & Calvet, 1995).
4.2 Wind-envelope interaction
The evolution of a wind expanding into a quasi-spherical density distribution is initially approximately adiabatic (e.g., Weaver et al. 1977), i.e. the combined thermal energy of the wind blown cavity and the kinetic energy of the swept up shell of shocked medium together increase at a rate set by the rate of kinetic energy input in the wind (, where is the terminal velocity of the wind). In a flattened density distribution, however, the wind ‘breaks out’ in the polar direction. We simplify the problem by considering a wind that expands into a free-falling envelope, whose density (in spherical polar coordinates) is given by equation (2) for , where measures the angular extent of the circumpolar cavity (see Fig. 9 for a schematic view of the assumed geometry). In this case, the envelope absorbs a fraction of the momentum of the wind. If the rate of momentum input in the wind is , then the total momentum provided to the flow at time is given by
| (3) |
The wind drives a strong shock into the envelope, of radius and the gas swept up by the shock is mainly concentrated in a thin shell at . For the density distribution described in Eq. (2) and assuming that the envelope is initially in free fall (i.e with inward velocity for central object of mass ), the mass contained within is given by:
| (4) |

In the limit that the gravitational acceleration of the flow is small compared with that resulting from interaction with the wind, the evolution of a momentum conserving thin shell is given by the condition:
| (5) |
In the simple case that is a simple power law
| (6) |
we can readily obtain power law solutions for , i.e.
| (7) |
where
| (8) |
and .
Therefore any declining rate of momentum input implies an evolution intermediate between the constant momentum () and the constant () case.
The neglect of the thermal and ram pressure of the material over-run by the shock implies that this solution is valid only if is greater than both the sound speed, and the local free fall velocity of the unshocked envelope, . Since the envelope is initially flowing in supersonically, the latter criterion is more restrictive. The similarity solution derived above implies , whereas . Thus declines with increasing provided . Therefore whereas for a steady wind (), gravity becomes of decreasing importance as the shock propagates outwards, in the case of a one-off application of momentum (), the shell will be increasingly subject to gravitational retardation and may be expected to re-collapse. We shall be applying a rate of momentum input from the wind that tracks the luminosity evolution of the system. In the case of FU Orionis, we adopt , appropriate to the nearly constant system luminosity, whereas in V1057 Cygni, the exponential decline in system luminosity means that at late times, we expect the behaviour to approach that of a one-off impulse. We therefore expect the dust shell to expand monotonically in the case of FU Orionis and for it to re-collapse in the case of V1057 Cygni. In the latter case we may estimate the impulse applied by the wind (), where is a measure of the effective timescale over which the bulk of the momentum is applied ( a year for this rapidly fading system). Equating this to , we can therefore obtain a rough estimate of the radius to which the shell should be swept out (equations (4)-(5)). We get:
| (9) |
If we adopt the parameters we use for the simulations of V1057 Cygni below (i.e. and 300 km/sec), we estimate that the shell should be swept out to radii au before re-collapsing.
4.3 Simulations


We explore the interaction between the time dependent momentum input from the wind and the infalling dusty envelope using a simple one dimensional Lagrangian code which employs a standard artificial viscosity (Richtmyer & Morton, 1967) in order to model the shock at the interface between the wind and envelope. For modeling the evolution of V1057 Cygni, we adopt the parameters listed at the end of 4.2, and assume a stellar mass of . In the absence of a proper calculation of the gas temperature in such an envelope, we simply model the flow as isothermal gas with temperature K. A temperature of hundreds of Kelvin is a reasonable order of magnitude etsimate based on the expected temperature of large grains at distances of au from a source with luminosity of hundreds of and is similar to the temperature employed by Muzerolle et al. (2005) in modeling the SED of the recently erupted FU Orionis system V1647 Ori. We note that the temperature does not appear in the equations above for the evolution of a thin shell, since the only requirement here is that the shock is strong, a condition that is readily met (with this choice of temperature) provided the shock remains within au. We will show below that doubling the temperature changes the outermost propagation radius and associated timescale by less than , so our conclusions about the applicability of this model to FU Orionis systems are not unduly sensitive to our crude treatment of the thermal structure of the flow.
The impulse is initially applied to fluid elements outward of radius , smoothed over a half Gaussian with standard deviation . Since we expect the envelope to intercept the disc at small radius, is a measure of the radius at which the envelope starts to subtend a significant solid angle as seen from the source, and therefore corresponds to the region where the initial wind-envelope interaction occurs. In what follows, we adopt, somewhat arbitrarily, au. We note that the actual value of is not critical in determining the late time evolution of the system, unless it is so small that the ram pressure of the envelope exceeds the initial momentum input rate from the wind. In practice, for typical parameters for the winds in these systems, a quasi-spherical envelope would have to extend to radii au in order to be able to crush the wind in this way.
Fluid elements inwards of are rapidly accreted, so that the density distribution develops an inner cavity that propagates outwards behind the shock. Provided that fluid elements initially at radii remain in this region, the wind momentum continues to be applied to them according to the initial (Gaussian) distribution of relative weightings. If an element initially at radius subsequently falls within , it is no longer subject to momentum input from the wind, and the set of relative weightings are passed upstream by one fluid element. In this way, momentum input is always distributed in the same way over the fluid elements that are currently at radius .
For the overall normalisation of the wind momentum input rate we assume that this varies in proportion to the total luminosity of the source, motivated by the general correspondence between the two discussed by Hartmann & Calvet (1995). Note that although we here assume that this also roughly applies to the evolution of individual sources, this has not been demonstrated to be the case: although V1057 Cygni, with its dramatic fading over its first decade in outburst, would have been a good source with which to test this hypothesis, detailed wind modeling was only performed in the late 1980s, when the system had already faded by a large factor. Here we model the wind of FU Orionis as a constant mass input rate of and that of V1057 Cygni as having a peak mass input rate of , in both cases assuming a wind terminal velocity of kms. We parameterise the decline of the wind in V1057 Cygni as an exponential decline (timescale years) for the first years followed by a slower exponential decline (timescale years), thereafter.
In order for the results to be independent of resolution, we find that it is necessary for no more than of the total wind momentum to be applied to a single grid cell. In practice, this implies at the inner edge; in our calculations, the shell is driven out to radii au and we need to model the flow out to au in order that the front propagation is unaffected by the outer boundary of the flow. We ran convergence test on our simulations, employing up to equal mass elements.


4.4 Results
Figure 10 illustrates snapshots of the density profile of the envelope for the V1057 Cygni models whose parameters are listed above. As expected, the flow develops an internal cavity bounded by a thin layer of shocked material, whose density exceeds that of the unshocked infalling envelope by the large factor ( the square of the Mach number) expected for strong isothermal shocks. As expected, given the steep decline in the momentum input from the wind, the shock weakens as it propagates outwards and the density contrast at the shock consequently decreases. Gravitational deceleration causes material in the shell to - more or less coherently - reverse direction about a decade after outburst, when it has reached a radius of au. The shell-like structure is initially preserved during the fallback stage (see the density peak at au in the right hand panel of Figure 10, at years after outburst); the shell is initially infalling at less than the free fall velocity and is therefore overtaken by faster material flowing in from the envelope. As the shell picks up speed, due to gravitational acceleration, the velocity differential with respect to the inflowing envelope successively decreases. Once this differential becomes subsonic, the shock disappears and the shell-like structure is eroded, as material at its inner edge is acclerated ahead of the rest of the flow (the remnant shell at au is visible in the snapshot at years in the right hand panel of Figure 10). By the stage that the flow has fallen back to small radii, the density profile has relaxed to a smooth for free fall onto a point mass.
We also ran a simulation identical to that above, except with a temperature of twice the above value (i.e. K compared with K). As one would expect, the evolution was qualitatively very similar during the outward propagation of the shell (Figure 11), but differences appeared close to turn-round, where the shell motion is temporarily subsonic. As expected, the shell is considerably thicker in the case of the hotter simulation, and by the time the velocity of the entire shell is reversed, the shell thickness is already of its radius (see right hand snapshot in the right panel of Figure 11). The re-collapse never proceeds by way of a thin shell (as in the colder simulation); instead, the flow passes through a shock that remains more or less stationary in the frame of the star on a timescale of a decade or so: the inward flowing material is decelerated in the shock and then gravitationally accelerated, finally free-falling onto the star. In contrast to the colder simulation, a pronounced shock structure remains at round au, even years after the onset of outburst.

In Figure 12, by contrast, we show how the shock radius evolves for our (steady wind) model for FU Orionis. Here, (as shown by the dashed line in Figure 12), the radius of the shock evolves according to the similarity solution derived in equation (7) above. As we noted above, increases with time, so that the role of gravity becomes less significant as the front propagates outwards. At the current epoch, we would expect the shock to have propagated to au; if FU Orionis remained in outburst indefinitely, then the shock would reach the outer boundary of the star’s putative natal core (at au) after about years, and would still be strongly supersonic at this point.
4.5 Discussion
We have modeled the interaction between the wind and infalling envelope of FU Orionis systems using parameters for these components that have previously been derived in the literature. This modeling has demonstrated that there are several consequences of this interaction that can explain a number of characteristics of FU Orionis systems. In particular, we are tempted to make the following connections:
i) that the inner radius of the dust envelope (invoked in order to generate the m flux of certain FU Orionis systems via reprocessing of the radiation from the central source) is set by the dynamical interaction between the wind and the inflowing envelope
and ii) that the erratic photometric variability (observed in V1057 Cygni post 1996 and also in V1515 Cygni) is associated with the fall back of dusty material to small radii and the consequent passage of dust condensations across the line of sight to the inner accretion disc.
Below we examine each of these hypotheses in turn:
4.5.1 Effect on the mid infrared SED
Figure 10 shows that in our model for V1057 Cygni, the wind sweeps out a cavity that attains a size of au about five years after the onset of the outburst, and which remains in the range au for the next fifteen years or so. A cavity of this dimension is precisely what was invoked by KH91 in their modeling of the mid infrared excess of V1057 Cygni, based on observations made years after the outburst. Our model is therefore perfectly compatible with these results. Thereafter, in our model, material falls back to small radii, although, depending on the temperature of the gas, the density discontinuity at the furthest extent of the windblown bubble (at about au) may persist for decades after that. In the absence of two dimensional modeling, both of the hydrodynamic interaction and of transfer of radiation through the resulting structure, it is unclear to what extent we would expect this relic structure to leave an imprint on the spectral energy distribution. We therefore do not attempt to predict how the SED would evolve during this fallback phase, pending more detailed calculations. In our models for FU Orionis, by contrast, the wind has swept the envelope to radii au and we would not expect to observe a spectral signature of a reprocessing cavity in the mid infrared. Again, this is compatible with observations of FU Orionis, where the evidence for extra spectral components in the mid infrared (over and above what is supplied by a flat accretion disc) is considerably weaker than in V1057 Cyg (KH91).
Although we have not modeled V1515 Cyg in any detail, we note that the weaker wind of this system (Hartmann and Calvet 1995) leads one to expect that the envelope is not expelled to very large radii. In this respect one would expect the system to more resemble V1057 Cyg than FU Orionis. In fact, V1515 Cyg is indeed similar to V1057 Cyg to the extent that it exhibits a significant mid infrared excess. Finally, we note that in the recently erupted rapid rise system V1647 Ori (McNeil’s nebula), modeling of the SED derived from Spitzer and ground based data again required an infalling envelope with infall rate of yr-1 (Muzerolle et al., 2005). In this modeling, the inner edge of this envelope was placed at au; this compact inner edge is expected in this model a the early stage of the outburst at which this system was modeled; depending on the subsequent luminosity evolution during the outburst, we might expect this radius to propagate outwards over the next few years.
4.5.2 Effect on photometric variability
Figure 10 shows that after around 20 years the dusty envelope in our model for V1057 Cygni has collapsed back to small radii and it is obviously tempting to associate this event with the sudden dimming of the system in 1996 and its subsequent erratic variability. (Note that, following Whitworth & Clarke 1997, we can readily demonstrate that, given the densities encountered in these simulations, the dust should not be destroyed in the shock and should instead melt only when it falls back within the dust sublimation radius at less than an A.U.). As has been noted (KH91; see also Figure 7, Section 3) the colour variations of these fluctuations are consistent with screening of the source with a variable dust screen following the standard interstellar extinction law (Mathis 1990). It is however necessary to postulate that in the realistic flow morphology for a recollapsing, rotating envelope, most of the envelope joins the disc at radii a fews tenths of an au, so that only a small fraction of its mass can intercept the line of sight to the innermost disc which produces the bulk of the optical emission. If this were not the case (i.e. if - as in our simplified one dimensional model - the flow just collapsed back, re-filling a wedge of constant opening angle), the extinction through the envelope would be immense () and under these circumstances the dimming of the source would be much more dramatic than that observed ( magnitude). In fact, it is a quite realistic expectation that only a small fraction of the envelope material should be on such low angular momentum trajectories that it falls in to such small radii, but without a two dimensional model we cannot quantify this further.
Such a picture in some ways resembles that proposed by Kenyon et al. (1991) for the similar photometric variations of V1515 Cygni and also for the more recent behaviour of V1057 Cygni itself (Kolotilov & Kenyon, 1997). In both cases, the variations derive from variable extinction local to the source. However, Kenyon et al and Kolotilov and Kenyon postulate that this dust is formed afresh in the wind, in a manner analogous to that observed in the winds of classical novae (Gehrz, 1988), rather than belonging to the re-collapse of a dusty accretion flow. If the dust is co-moving with the wind, then the timescale for the observed variability (of order a year, see section 2.2) requires that, in their model, the dust be situated at large radii ( au, see Kenyon et al. 1991), whereas in our model the dust is roughly in a state of free fall and therefore must be located at around au distance scales.
There are several points in favour of this interpretation. Firstly, the fallback of the envelope provides an explanation of the change in the photometric properties of V1057 Cygni after 1995. It is also consistent with the photometric variability patterns of other FU Orionis systems. V1515 Cygni has demonstrated similar photometric variability patterns to those recently observed in V1057 Cygni throughout its outburst. The wind in V1515 Cyg is relatively weak, comparable to that measured in V1057 Cygni after its had undergone significant fading from the peak of the outburst (Hartmann & Calvet, 1995). We therefore postulate that whereas V1057 Cygni was able to temporarily clear its circumstellar environment in response to the strong burst of wind activity at the onset of its outburst, the wind in V1515 Cygni has never succeeded in completely clearing the line of sight to the observer of dusty material and hence the system has been subject to erratic variations throughout the outburst. In FU Orionis, by contrast, the stronger, more sustained, wind has succeeded in clearing a large cavity and there is no trace in its light curve of the sort of variability exhibited in the other two systems. If, on the other hand, the variations result from dust formed in the wind, there is no particularly obvious reason why the wind in FU Orionis has apparently never undergone dust condensation events, that in V1515 Cygni has been subject to dust condensation events throughout and the wind in V1057 Cygni has made an abrupt transition between FU Orionis like and V1515 Cygni like behaviour.
The other advantage of our interpretation is that it does not predict any straightforward relationship between photometric variations and the appearance of prominent shell structures in the optical and infrared spectra. These shell structures correspond to blue shifted absorption features at around km/s (Herbig et al., 2003; Hartmann et al., 2004) and are interpreted as arising from shell-like regions of enhanced density in the outflowing wind. There has been some discussion of the hypothesis that the shell could be the formation site of the dust associated with the photometric variations (Kenyon et al., 1991; Herbig et al., 2003; Hartmann et al., 2004), an idea given additional credence by the fact that the shell features in V1057 Cygni became very strong when the system faded dramatically at the end of its plateau phase. (We note in passing that the dust formation would have to be very inefficient in this case to account for the amplitude of such variations: the inferred column density in the shell - cm-2; Hartmann et al. 2004 - would correspond to magnitudes of optical extinction if the dust formed with a standard dust-gas ratio). More importantly, however, the shell feature would be expected to be at its strongest at minimum light of the system (in 1999) whereas, in fact, the shell features had essentially disappeared at this date, to re-appear a couple of years later as the system recovered in photometric brightness. This led Herbig et al. (2003) to suggest that the photometric variations instead result from ‘inhomogeneities … passing across the line of sight’, a situation that would result from the sort of clumpy fall back that we envisage here. In our model, although the enhanced shell features in 1996 may or may not have anything to do with the fall back of the envelope, the dust is not generated in, nor is necessarily cospatial with, the shells and one would not expect to be able to trace the effect of individual shell ejection events in the light curve of the object.
The largest uncertainties in what we have sketched above concern how the returning flow would behave in two dimensions and what is the degree of clumping that would be expected in reality. Two dimensional modeling would remedy the first shortcoming: one might readily anticipate that Rayleigh-Taylor instabilities in the interface between the infalling envelope and wind would produce a wealth of time dependent behaviour that could be checked against the light curves of V1515 Cygni and V1057 Cygni. However, one would also expect that much of the fine grained structure in the light curves of these objects would result from small scale clumping that would not be resolved in such simulations. Certainly, HST imaging of V1057 Cygni reveals a wealth of features (loops and arcs) in the dust distribution on a larger scale (hundreds of au), and it does not seem unreasonable to suggest that the material falling in to small radii would be far from homogeneous. In the absence of a more quantitative argument, the best observational test of our hypothesis remains the continued spectroscopic and photometric monitoring of V1057 Cygni and V1515 Cygni in order that our prediction (of no correlation between individual shell ejections and the photometric variability) can be properly assessed.
5 Conclusions
Understanding the FU Orionis phenomenon is an important issue in the general context of star formation, especially if, as is commonly thought, most protostars undergo an FU Orionis phase during their early evolution. In particular, given their complexity and the different components involved in the phenomenon (protostar, accretion disc, outflows, envelope, possible small mass companions) their represent a valuable tool to study the interaction of the protostar with its environment.
Here, we present new photometric data of the three best studied FU Orionis objects (FU Ori, V1057 Cyg and V1515 Cyg), taken at Maidanak Observatory between 1981 and 2003. We have analysed our photometric data for variability on long and short timescales. We have therefore been able to monitor the recent evolution of these systems. Whereas V1515 Cyg and FU Ori did not show any significant change in their long-term evolution, V1057 Cyg has undergone an abrupt drop in luminosity in 1995 (see also Kolotilov & Kenyon 1997). Apart from monitoring the secular evolution of these systems, we have also checked for the presence of variability on shorter timescales and have detected non periodic, flickering, behaviour on a timescale of a few days both in V1515 Cyg and in V1057 Cyg, analogous to that observed in FU Ori (Kenyon et al., 2000). Both these objects also displayed periodic variations (period days) during one observing season in each case.
We have then interpreted the secular evolution of these systems within the framework of two complementary theoretical models, both of which involving the interaction of different components of the system.
(i) The overall outburst and subsequent luminosity decline (especially for V1057 Cyg, that displays the fastest evolution) has been described in terms of a standard disc instability model (the instability being possibly triggered by the interaction between the circumstellar disc and a massive planet or a small mass companion). For the first time, we have compared photometric data at different epochs with time-dependent disc models, rather than with a series of steady state models (as done by KH91), finding a better agreement, with respect to the latter, of the colour evolution of the systems, particularly in the colour-magnitude diagram. In particular, we have shown that we can reproduce the large change in system colour between 1970 and 1995 which cannot be produced by a sequence of steady state disc models (see Figure 7).
(ii) On the other hand, we have interpreted the strong luminosity drops observed early during the outburst in V1515 Cyg and more recently also in V1057 Cyg as occultation effects due to intervening dust along our line of sight. A similar interpretation has already been proposed (Kenyon et al., 1991; Kolotilov & Kenyon, 1997), but whereas these authors assume that the dust is formed within an expanding shell in the wind, here we consider the occultation events as the result of the interaction between the wind and the surrounding infalling envelope. We have constructed a simple quasi-spherical model of the evolution of a dusty envelope subject to the momentum input from the outflowing wind. For sufficiently strong winds, the envelope is blown out to large radii ( au, consistent with the required location of the reprocessing dust, in order to produce the mid-infrared excess observed in some systems, see KH91). However, at later stages during the outburst, as the momentum carried by the wind decreases (as is expected if the wind strength scales with the luminosity of the disc), the dusty envelope falls back and occults our line of sight. In this way, our model naturally explains the different photometric variability of the three FU Orionis objects studied here in terms of the different strength and time dependence of the disc wind. Objects with strongest winds (FU Ori) are able to clear away the envelope and do not show any significant luminosity drop, those with weaker winds (V1515 Cyg) show erratic photometric variability throughout , whereas V1057 Cyg, which has faded substantially in the last 20 years, has started to show variability only after the (disc) luminosity has decreased substantially. The main limitation of our model is its 1D nature, which makes it difficult to quantify in greater detail the amount of occulting material that will intercept our line of sight after the envelope has fallen back to small radii. We leave this issue to further investigations.
Acknowledgments
We warmly thank Jerome Bouvier for independently verifying the photometric periods reported in this paper. We thank the Referee, George Herbig, for a prompt and helpful review. SYM acknowledges support from the IOA Visitors Program and CJC gratefully acknowledges support from the Leverhulme Trust in the form of a Philip Leverhulme Prize.
References
- Ábrahám et al. (2004) Ábrahám P., Kóspál A., Csizmadia S., Kun M., Moór A., Prusti T., 2004, A&A, 428, 89
- Bell et al. (1997) Bell K. R., Cassen P. M., Klahr H. H., Henning T., 1997, ApJ, 486, 372
- Bell & Lin (1994) Bell K. R., Lin D. N. C., 1994, ApJ, 427, 987
- Bell et al. (1995) Bell K. R., Lin D. N. C., Hartmann L. W., Kenyon S. J., 1995, ApJ, 444, 376
- Bonnell & Bastien (1992) Bonnell I., Bastien P., 1992, ApJ, 401, 31
- Bossen (1972) Bossen H., 1972, Informational Bulletin on Variable Stars, 722, 1
- Clarke & Armitage (2003) Clarke C. J., Armitage P. J., 2003, MNRAS, 345, 691
- Clarke et al. (1989) Clarke C. J., Lin D. N. C., Papaloizou J. C. B., 1989, MNRAS, 236, 495
- Clarke et al. (1990) Clarke C. J., Lin D. N. C., Pringle J. E., 1990, MNRAS, 242, 439
- Clarke & Syer (1996) Clarke C. J., Syer D., 1996, MNRAS, 278, L23
- Croswell et al. (1987) Croswell K., Hartmann L., Avrett E. H., 1987, ApJ, 312, 227
- Errico et al. (2003) Errico L., Vittone A., Lamzin S. A., 2003, Astronomy Letters, 29, 105
- Gehrz (1988) Gehrz R. D., 1988, ARA&A, 26, 377
- Hartmann & Calvet (1995) Hartmann L., Calvet N., 1995, AJ, 109, 184
- Hartmann et al. (2004) Hartmann L., Hinkle K., Calvet N., 2004, ApJ, 609, 906
- Hartmann & Kenyon (1985) Hartmann L., Kenyon S. J., 1985, ApJ, 299, 462
- Hartmann & Kenyon (1987) Hartmann L., Kenyon S. J., 1987, ApJ, 312, 243
- Hartmann & Kenyon (1996) Hartmann L., Kenyon S. J., 1996, ARA&A, 34, 207
- Herbig et al. (2003) Herbig G. H., Petrov P. P., Duemmler R., 2003, ApJ, 595, 384
- Ibragimov & Shevchenko (1988) Ibragimov M. A., Shevchenko V. S., 1988, Astrophysics, 27, 337
- Ibrahimov (1996) Ibrahimov M. A., 1996, Informational Bulletin on Variable Stars, 4285, 1
- Ibrahimov (1999) Ibrahimov M. A., 1999, Informational Bulletin on Variable Stars, 4691, 1
- Kenyon & Hartmann (1991) Kenyon S. J., Hartmann L., 1991, ApJ, 383, 664
- Kenyon et al. (1988) Kenyon S. J., Hartmann L., Hewett R., 1988, ApJ, 325, 231
- Kenyon et al. (1991) Kenyon S. J., Hartmann L., Kolotilov E. A., 1991, PASP, 103, 1096
- Kenyon et al. (2000) Kenyon S. J., Kolotilov E. A., Ibragimov M. A., Mattei J. A., 2000, ApJ, 531, 1028
- Kolotilov (1977) Kolotilov E. A., 1977, Astronomicheskij Tsirkulyar, 955, 1
- Kolotilov & Kenyon (1997) Kolotilov E. A., Kenyon S. J., 1997, Information Bullettin on Variable Stars, 4494, 1
- Kopatskaya (1984) Kopatskaya E. N., 1984, Astrophysics, 20, 138
- Koresko et al. (1991) Koresko C. D., Beckwith S. V. W., Ghez A. M., Matthews K., Neugebauer G., 1991, AJ, 102, 2073
- Landolt (1975) Landolt A. U., 1975, PASP, 87, 379
- Landolt (1977) Landolt A. U., 1977, PASP, 89, 704
- Lin et al. (1985) Lin D., Papaloizou J., Faulkner J., 1985, MNRAS, 212, 105
- Lodato & Bertin (2001) Lodato G., Bertin G., 2001, A&A, 375, 455
- Lodato & Clarke (2004) Lodato G., Clarke C., 2004, MNRAS, 353, 841
- Mendoza (1971) Mendoza E. E., 1971, ApJ, 169, L117
- Muzerolle et al. (2005) Muzerolle J., Megeath S. T., Flaherty K. M., Gordon K. D., Rieke G. H., Young E. T., Lada C. J., 2005, ApJ, 620, L107
- Reipurth & Aspin (1997) Reipurth B., Aspin C., 1997, AJ, 114, 2700
- Reipurth & Aspin (2004) Reipurth B., Aspin C., 2004, ApJ, 608, L65
- Richtmyer & Morton (1967) Richtmyer R. D., Morton K. W., 1967, Difference methods for initial-value problems. Interscience, London
- Rieke et al. (1972) Rieke G., Lee T., Coyne G., 1972, PASP, 84, 37
- Roberts et al. (1987) Roberts D. H., Lehar J., Dreher J. W., 1987, AJ, 93, 968
- Rodriguez & Hartmann (1992) Rodriguez L. F., Hartmann L. W., 1992, Revista Mexicana de Astronomia y Astrofisica, 24, 135
- Schwartz & Snow (1972) Schwartz R. D., Snow T. P., 1972, ApJ, 177, L85
- Wang et al. (2004) Wang H., Apai D., Henning T., Pascucci I., 2004, ApJ, 601, L83
- Weaver et al. (1977) Weaver R., McCray R., Casor J., Shapiro P., Moore R., 1977, ApJ, 218, 377
- Welin (1975) Welin G., 1975, Informational Bulletin on Variable Stars, 1057, 1
- Welin (1976) Welin G., 1976, Informational Bulletin on Variable Stars, 1195, 1
- Whitworth & Clarke (1997) Whitworth A. P., Clarke C. J., 1997, MNRAS, 291, 578