Dating the stellar population in massive early-type galaxies at 1.5
Abstract
We present the analysis of 10 massive early-type galaxies at . They have been identified by means of a near-IR low resolution spectroscopic follow-up of a complete sample of 36 bright (K’ 18.5) Extremely Red Objects (EROs, R-K’ 5) selected from the Munich Near-IR Cluster Survey (MUNICS; Drory et al. 2001). The low resolution near-IR spectra constrain their redshift at , implying absolute magnitudes M and stellar masses well in excess of 1011 M⊙. Under the hypothesis of pure passive evolution from to , in the local universe they would have luminosities LL∗. Thus, they are the high-z counterparts of the local old massive (10 M⊙) early-type galaxies populating the bright end of the local luminosity function of galaxies. The comparison of their spectro-photometric properties with a grid of synthetic models suggests that the stellar populations in more than half of the sample are about 3-5 Gyr old and 1-2 Gyr old in the remaining part. These ages imply formation redshift for all the galaxies and for the oldest ones. The comparison of the 4000Å break and of the overall spectral shape of the average spectrum of the 10 galaxies at with those of their local counterparts confirms that field massive early-type galaxies formed the bulk of their stellar mass at , most likely over a short ( 1 Gyr) star formation time scale, consistently with the results derived from the analysis of their individual spectro-photometric properties.
keywords:
Galaxies: evolution; Galaxies: elliptical and lenticular, cD; Galaxies: formation.1 Introduction
The epoch of formation of high mass ( M⊙) early-type galaxies represents a key issue to understand the whole picture of galaxy formation.
The formation and the evolution of galaxies are mainly the result of two physical processes: the mass assembly and the conversion of gas into stars. By now, the mass assembly on large scale is well described by the hierarchical models of galaxy formation in which structures are formed by means of subsequent merging of dark matter haloes. Observational confirmation of this theoretical framework and precise constraints on its relevant cosmological parameters came recently from the analysis of the WMAP (Wilkinson Microwave Anisotropy Probe, Bennett et al. 2003) data (e.g., Spergel et al. 2003). On the other hand, the link between the dark matter distribution at any epoch and the properties of the corresponding baryonic luminous matter is not straightforward, and the semianalytic models aimed at building this link are still not exhaustive. One of the difficulties of the hierarchical models of galaxy formation is related to the properties and the evolution of the population of massive galaxies. This class of objects is locally composed mainly of early-type galaxies, i.e. ellipticals and spheroids. Indeed, in the hierarchical models spheroids are assembled by means of subsequent mergers of smaller disk galaxies occurring at (Kauffmann & Charlot 1998; Baugh et al. 2003). This implies evolution with of the co-moving space density of massive spheroids: the higher the redshift, the lower the mass they can have already assembled. In particular, the most massive spheroids (), populating the bright end of the local luminosity function, reach their final mass at depending on the chosen values of some parameters in the models. On the other hand, there is evidence that fully assembled massive galaxies exist at (Saracco et al. 2005; Cimatti et al. 2004; McCarthy et al. 2004; van Dokkum et al. 2004; van Dokkum & Stanford 2001) and the properties of their stellar content suggest they are evolved structures, i.e. they are early-type galaxies with old stars which can only passively evolve in the local population of massive spheroids. The observations of massive galaxies at can be more easily taken into account in the monolithic scenario of galaxy formation, that forms even the most massive ellipticals at high redshift () in a single episode of mass collapse. In this framework, at the origin of massive spheroids all the gas is burned into stars during the mass collapse, and the luminosity evolution of the galaxies follows a pure passive aging (e.g. Tinsley 1977; Bruzual & Kron 1980). Both the hierarchical and the monolithic scenarios are in agreement with the observational evidence that the bulk of the stellar populations in local ellipticals and spheroids is relatively old (i.e., consistent with a formation redshift : e.g., Thomas et al. 2005, Renzini & Cimatti 1999) while differences in some foreseen properties come out at redshift . Therefore, the age and the properties of the stellar populations in field massive early-types at can be a key test for the galaxy formation models. Indeed, by determining the mean age of the stellar content of massive field early-types it is possible to constrain their star formation history (SFH) and the epoch of their formation by tracing forward their evolution (over an interval of about 7-8 Gyr) to match the properties of the local massive early-type galaxies.
It is worth to note that M⊙ early-types populate the very bright end (LL∗) of the local luminosity function of galaxies. Thus, early-type galaxies with these high stellar masses have necessarily already completed the accretion of their stellar mass at that redshift and, therefore, are the high-z counterpart of the local old ones.
In this paper we report the analysis of a sample of 10 high-mass ( M⊙) field galaxies spectroscopically classified as early-type galaxies at . They result from an on-going near-IR spectroscopic follow-up (Saracco et al. 2003, 2005) of a complete sample of 36 bright (K’ 18.5) Extremely Red Objects (EROs, R-K’ 5) selected over two fields (320 arcmin2) of the Munich Near-IR Cluster Survey (MUNICS; Drory et al. 2001). Optical (B, V, R, I) and near IR (J and K’) photometry is also available for the sample. Furthermore, the two fields have been targets of two XMM-Newton pointings. One of them has been already analyzed and it has allowed the detection of 6 X-ray emitting EROs, five of which have properties matching those expected for X-ray obscured type-2 QSO (Severgnini et al. 2005).
We present the analysis of the spectro-photometric data of the 10 early-type galaxies identified so far in §2, where we derive their redshift and luminosities. In §3 we derive a robust estimate of their stellar mass content and of the age of the bulk of their stars through the comparison with synthetic models. Finally, we discuss the derived properties in terms of galaxy formation and evolution scenarios in §4 and we summarize the results in §5. The comoving density of high-mass early-type galaxies is presented and discussed in another paper (Saracco et al. 2005). The morphological analysis of the 10 galaxies, based on H band NICMOS-HST data (Cycle 14) will be presented in a further paper. Throughout this paper we assume H0=70 km s-1 Mpc-1, and . All magnitudes are given in the Vega system.
2 The near-IR spectra
Near-IR spectroscopic data have been collected in October 2002 and November 2003 at the Italian 3.6 m telescope TNG (Telescopio Nazionale Galileo, LaPalma, Canary Islands) using the AMICI prism mounted at the NICS spectrometer, with typical exposure of 3-4 hours on source. The prism provides the spectrum from 0.85 m to 2.4 m in a single shot with a nearly constant resolution of (1.5” width slit). The resulting spectral dispersion is 30Å (100Å) per pixel, while the Full-Width at Half-Maximum (FWHM) is Å (Å) at 10000Å (20000Å). This extremely low resolution is well suited to describe the spectral shape of the sources and to detect strong continuum features such as the 4000Å break in old stellar systems at . On the other hand, it makes unfeasible the detection of emission/absorption lines in sources as faint as the EROs presented here.
Object B V R I J K’ S2F5_109 24.20.3 23.50.2 21.80.1 20.10.1 18.20.1 16.60.1 S7F5_254 25.0 24.5 24.0 23.10.7 19.80.1 17.80.1 S2F1_357 25.0 24.5 23.80.2 21.50.2 19.50.1 17.80.1 S2F1_527 25.0 24.5 24.0 22.60.4 20.40.2 18.30.1 S2F1_389 24.30.5 23.70.5 23.70.5 23.00.5 20.30.2 18.20.1 S2F1_511 25.0 24.5 24.0 21.60.6 19.80.1 18.10.1 S2F1_142 25.0 24.5 23.80.3 21.50.2 19.60.1 17.80.1 S7F5_45 - 24.20.4 23.50.3 22.20.3 19.60.1 17.60.1 S2F1_633 25.0 24.5 24.0 22.50.5 20.00.1 18.20.1 S2F1_443 25.0 24.5 24.0 23.20.6 20.50.1 18.40.1
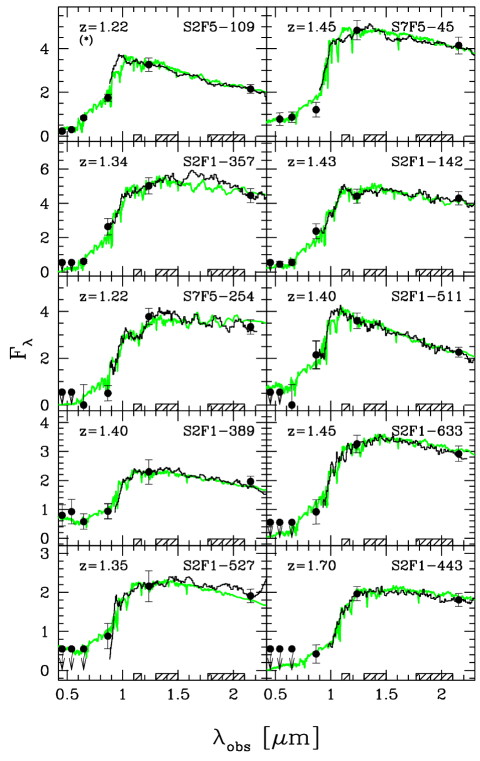
In Figure 1 we show the smoothed spectra of the 10 early-type galaxies, two of which (S7F5_45 and S7F5_254) previously analyzed by Saracco et al. (2003), while their broad band photometry is summarized in Table 1. All the spectra drop very rapidly at wavelength m concurrent with the 4000Å break. The identification of the 4000Å break in all the galaxies places them at , while its steepness confirms their early-type spectral nature111In this context we refer to early-type galaxies as galaxies whose stellar content has been mainly formed in a past star formation (SF) event and whose spectro-photometric properties can be accounted for only by stellar populations older than 1.0 Gyr with small or absent dust contribution. In Saracco et al. (2005), the possibility that these EROs are dusty starburst galaxies has been already ruled out and details on the adopted procedure are discussed. Briefly, we searched for acceptable fits to the spectro-photometric data of the EROs among a set of templates of starburst galaxies. The selected template library was made up by the six empirical starburst templates (SB1-SB6) of Kinney et al. (1996) and by one starburst model described by a constant star formation rate. Extinction has been made varying in the range 0E(B-V). For none of these 10 EROs we obtained an acceptable fit.
Considering the spectral width of the 4000Å feature and the very low resolution of our spectra, we measure the redshift of the 10 galaxies with an uncertainty of 0.05. The resulting measured redshift are reported in Figure 1 and summarized in Table 3. We like to note that the highest redshift galaxy S2F1_443 is one of the X-ray emitting EROs detected on the S2F1 field (Severgnini et al. 2005).
The bright K’-band magnitudes (K’ 18.4) of our early-type galaxies together with their redshift imply that their stellar mass content is well in excess of M⊙. Indeed, considering as reference the faintest magnitude (K’=18.4) at the minimum redshift , the corresponding rest-frame (k-corrected) luminosity would be L⊙ (M, Allen 1973). Assuming M24.3 mag for the the local luminosity function (Kochanek et al. 2001), it would be equivalent to L. Thus, even conservatively assuming M/L M⊙/L⊙ (i.e., half of the local value, Drory et al. 2004) the resulting lowest stellar mass content of the present sample of early-type galaxies would be M⊙, which is almost independent of any model assumption.
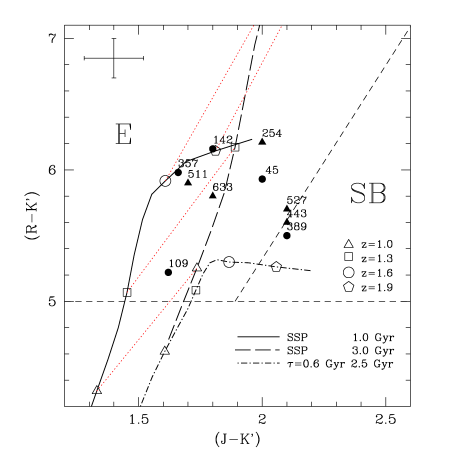
The simple analysis based on the near-IR spectra and the broad-band photometry of the 10 galaxies has allowed us to constrain their redshift, to identify their early-type nature and to derive their stellar mass in a model independent way. Colours alone cannot provide the same strong constraints on their nature and, most of all, on their redshift. Indeed, in Figure 2 the R-K’ colour of the 10 early-type galaxies is shown as a function of their J-K’ colour. The selection criterion proposed by Pozzetti & Mannucci (2000, thin dashed lines) to discriminate early-type galaxies from starburst ones among the EROs is confirmed to be roughly predictive on their nature (see also Cimatti et al. 2003). At the same time, at least three out of the ten galaxies of our sample (namely, S2F1_527, S2F1_443 and S2F1_389) could not be correctly classified on the basis of the Pozzetti & Mannucci criterion, since their colours place them on the border of the classification line. Actually, S2F1_527 and S2F1_443 are represented by lower limits in their (R-K’) colour and are therefore located in a lower region with respect to their real position in the diagram. This is not the case of S2F1_389 that falls in the SB region of the same diagram, even if quite close to the border line, and whose early-type nature has been demonstrated by Saracco et al. (2005). Indeed, its Spectral Energy Distribution (SED) from 0.4m to 2.2m cannot be fitted by any starburst SED, both observed and synthetic one, while it is very well reproduced by spectra of evolved stellar populations without any dust.
Furthermore, in the diagram we also show the colour-colour tracks expected for early-type galaxies. Namely, we report the expected colours of two Simple Stellar Populations (SSPs) and one exponentially declining SFH with time scale Gyr, based on Bruzual & Charlot models (2003; BC03) assuming the Salpeter Initial Mass Function (IMF) and solar metallicity. It is evident the degeneracy of the expected colours with respect to the mean age of the stellar populations, the redshift and the SFH, and consequently the low effectiveness of broad band colours in constraining the properties of the stellar populations of galaxies. On the contrary, the continuum shape over the rest-frame range 3800-11000Å provided by the near-IR spectra, even if at the very low resolution of our observations, makes it possible to fix their redshift with reasonable accuracy. Furthermore, as it will be discussed in the next section, when coupled with rest-frame UV data ( Å) provided by the B and the V bands, the near-IR spectrum provides severe constraints on the age of the stellar population of our galaxies.
3 Comparison with models
In the following we make use of stellar population synthesis models to constrain age, K’-band luminosity and stellar mass content of the 10 early-type galaxies. To this end, each observed SED (described by the broad band photometry and by the near-IR spectra) has been compared with two sets of spectro-photometric models. One set has been derived from the latest version of the BC03 code, assuming 4 different Initial Mass Functions (IMFs, 0.1MM⊙): Salpeter (Sal; Salpeter 1955), Miller-Scalo (MS; Miller & Scalo 1979), Scalo (Sca; Scalo 1986) and Kroupa (Kro; Kroupa 2001); 6 different star formation histories (SFHs): a Simple Stellar Population (SSP) and 5 SFHs described by exponentially declining star formation rates (SFRs) with e-folding time in the range 0.1-2 Gyr; 3 different metallicity values. A second set of templates is based on the SSP derived by Maraston (2005: Ma05), assuming Salpeter IMF and solar metallicity. The basic models parameters are summarized in Table 2.
SFH [Gyr] SSP, 0.1, 0.3, 0.6, 1, 2 Metallicity (a) 0.2 , 0.4 , Extinction law Seaton (1979); Calzetti et al. (2000) IMFs (b) Sal, Sca, MS, Kro
Note: (a) for Ma05 models only
(b) for Ma05 models only Sal
Ma05 code differs from the BC03 one according to the integration method, and it takes into account in a more reliable way the late phases of stellar evolution such as the Thermally-Pulsating Asymptotic Giant Branch (TP-AGB), the blue Horizontal Branch and the very hot old stars. The inclusion of the TP-AGB produces spectra redder than those derived by the BC03 code when ages younger than 1 Gyr are considered. However, the differences in the resulting spectral shape between SSPs with and without TP-AGB become appreciable at m (see figure 14 of Ma05). Since the present analysis is based on spectral data sampling the rest frame at m, we do not expect different results from the two different codes except when we extrapolate at longer wavelength (see below for further discussion). Moreover, also the peculiar spectral features at m resulting from the inclusion of the TP-AGB phase could not be revealed from the very low resolution of the present near-IR spectra.
For each set of models and for each possible combination of models parameters, the -minimization procedure of hyperz (Bolzonella et al. 2000) has been used to find the spectral templates which best fit the whole SED of the galaxies. In practice, for each single combination of SFH, IMF and metallicity value defining a model, we find the best fitting template, i.e. the corresponding age of the model for the given redshift of the galaxy. In the best fitting procedure the extinction has been allowed to vary within 3 ranges (AV = 00, 00.5, 0.51.0) and at each galaxies have been forced to have ages lower than the Hubble time at that . We repeated this procedure for the selected IMFs, SFHs, metallicity and dust values considered, thus associating at each galaxy a wide set of synthetic templates. Among all these collected best fitting templates, we further select the acceptable ones defined as those which provide fluxes within 1 sigma (observational error) from the observed ones. When more than one range of dust extinction values gave acceptable fit, we selected only the one with the lowest value of AV. This choice is due to the early-type nature of these galaxies, and to the fact that dust is almost absent in the local sample of early-type galaxies. In most of the cases we could accept A, while only for three galaxies (S2F1_443, S7F5_254, S7F5_45) . In these latter cases, we verified that the final results do not depend at all from the choice of the extinction law adopted to describe the dust reddening. This was expected since the different extinction curves have about the same shape over the range 0.2 m - 1.0m corresponding to the rest-frame spectral range used in the present fitting procedure.
On the basis of the selected set of acceptable templates, for each galaxy we have defined the range of variability of the parameters which can be derived from the corresponding accepted models: K’-band luminosity, stellar mass content and mean age of their stellar population. The resulting values are summarized in Table 3, where the spanned ranges are reported, together with the spectroscopic measured redshift. The limited range reported for each quantity corresponds to all the models providing acceptable fits to the spectrophotometric properties of the galaxies, being the acceptance criterion based on the accordance within 1 between the observed and the fitted spectral fluxes. In this sense, the wide set of model parameters which have been adopted to perform the fit of the galaxies SED assures that the derived ranges of each measured quantity are robust estimates of their uncertainty. Apart from this uncertainty, each value of M and within the acceptable range has its own statistical error, due to the errors in the apparent K’-band magnitude (), in the redshift measure (, that can be transformed in mag on the absolute magnitude estimate), in the adopted k-correction and dust extinction factor (mag), in the assumed /L value (15% within a single IMF, 40% if all the IMFs are considered). The corresponding average statistical error on the absolute magnitude M is 0.2 mag, while the uncertainty on the estimate is % for fixed single IMF and % when all the IMFs are considered. No statistical error is affecting the age parameter since it has been estimated only by means of models comparison without involving any measured quantity.
The absolute K’-band magnitudes have been calculated assuming the k-corrections derived by redshifting each of the accepted best-fitting templates. In the case of S2F1_443, S7F5_254, S7F5_45, for which the accepted fits of their SEDs assume A, we have taken into account also the extinction applied to the templates to fit the data. We like to note that the small differences with some of the K’-band absolute magnitudes reported in Table 1 of Saracco et al. (2005) are due to the choice of a unique IMF (Salpeter) in that analysis. Moreover, the errors reported by Saracco et al. (2005) are those due to the apparent K’ band magnitude and redshift uncertainties.
Stellar masses have been derived by the K’-band absolute magnitudes by means of the mass-to-light ratio /L relevant to the accepted best-fitting models. The largest uncertainty in the stellar mass computation comes from the variation of /L according to the age of the stellar population and to the adopted IMF. In Table 3, we report the range of values of obtained with the whole set of IMFs listed in Table2, with the Salpeter IMF alone and with the Kroupa IMF alone, in columns 5, 6 and 7 respectively. It appears that on average the stellar masses derived assuming Salpeter IMF are larger than those obtained with Kroupa IMF of about a factor 1.3. For comparison, with the Chabrier (2003) IMF, that has been recently widely accepted as a good universal parametrization of this function (see BC03), we would have derived stellar masses about a factor 1.5 smaller than those derived with Kroupa IMF and a factor 2 smaller than those derived with Salpeter IMF (e.g., Bundy et al. 2005). It can be seen that, in spite of the large grid of models considered, the stellar mass varies within a narrow range and typically within a factor 3 even when some dust extinction is present.
As to the age of the stellar population of our galaxies, the age of the best fitting models cannot be considered its reliable estimator. Indeed, the spectro-photometric properties of a stellar population are basically defined by the ratio t, i.e. the ratio between the age and the SF time scale. This implies that the best-fitting age t exhibits an obvious degeneracy with respect to : similar stellar populations can be equivalently described by young ages t in models with short SF time scale (small value of ) or by older ages t in models with longer SF time scales. Thus, in order to derive a robust estimate of the age of the bulk of stars in galaxies, we derived the mass weighted age for each best-fitting template defined as:
| (1) |
where is the age of the template. Any template defined by a fixed value of and SFR(t’) can be seen as the sum of SSPs with different ages. Each SSP provides a fraction of the total mass which depends on its own age ( -t’) and on the SFH describing the template itself. The mass weighted age is obtained by summing the ages of the SSPs, each of them weighted on its mass fraction. Nevertheless, even the mass weighted age exhibits a degeneracy, the one with metallicity: young stellar populations at high metallicity have spectro-photometric properties similar to those of older stellar populations at lower metallicity. In Table 3, we report the range of values of obtained from the best-fitting templates at solar metallicity (i.e., expected lower limits with respect to the age-metallicity degeneracy) and at ZZ⊙. We like to note that the upper limit of the accepted range of this parameter is partly due to the imposed constraint on the fitting procedure, for which models age cannot be higher than the Hubble time at each redshift. In some cases, if this constraint is relaxed, older ages are obtained. We verified that ages older than the universe, when selected by the fitting procedure, only marginally improve the goodness of the fit obtained with younger ages. Moreover, similar results can be obtained assuming small amount of dust reddening and/or metallicity slightly higher than the solar value. The available data are not detailed enough to reliable constrain the metallicity and the dust content of the galaxies. Thus, since these older ages would only strengthen our conclusions on the existence of old stellar populations in massive galaxies at which will be discussed in the next section, we prefer to obtain meaningful ages of the galaxies by imposing the limit of the Hubble time at each redshift in the fitting procedure.
(1) (2) (3) (4) (5) (6) (7) (8) (9) Object M M BC03 Ma05 [1011 M⊙] Sal [1011 M⊙] Krou [1011 M⊙] Z⊙ [Gyr] ZZ⊙ [Gyr] S2F5_109 1.220.05 -27.4-27.2 -27.4-27.2 4.714.6 9.312.8 7.014.6 1.42.0 2.23.2 S7F5_254 1.220.05 -26.4-26.2 -26.4-26.2 4.5 9.0 8.4 9.0 6.5 7.2 4.95.1 4.95.1 S2F1_357 1.340.05 -26.5-26.3 -26.4-26.2 4.2 9.4 7.9 9.4 6.3 7.2 3.94.1 3.94.1 S2F1_527 1.350.05 -26.3-25.7 -26.3-25.7 2.4 5.9 4.8 5.9 3.7 4.6 4.44.6 3.44.6 S2F1_389 1.400.05 -26.5-25.9 -26.5-25.9 1.7 5.6 2.4 5.6 1.9 4.4 2.53.5 1.53.5 S2F1_511 1.400.05 -26.2-26.0 -26.5-26.3 1.1 5.5 2.2 5.5 1.7 4.3 1.01.6 1.54.5 S2F1_142 1.430.05 -26.6-26.4 -26.6-26.4 3.1 9.3 5.8 9.3 4.4 7.2 2.02.4 2.53.5 S7F5_45 1.450.05 -27.0-26.6 -27.2-27.0 2.3 8.7 4.6 8.7 3.4 7.0 1.42.0 1.43.0 S2F1_633 1.450.05 -26.3-26.1 -26.3-26.1 3.1 7.5 5.6 7.5 4.2 5.9 3.54.5 3.54.5 S2F1_443 1.700.05 -26.8-26.5 -26.5-26.3 2.0 9.4 3.8 9.4 3.1 7.6 3.23.8 1.53.5
As expected, the two sets of models (BC03 and Ma05) lead to similar results in the and estimate of all the galaxies. Differences can be appreciated only when the absolute magnitude M is derived, since its value is calculated from the ratio between the flux at m (i.e., the apparent K’ flux at ) and the flux at m. As already noted, models Ma05 differs from BC03 at m and as a consequence the k-corrections in the K’ band are different in the two models. Differences in the K’ band k-corrections depend from the age of the stellar populations and at can be 0.3-0.4 mag for SSP 1 Gyr old. As can be noted from Table 3 (where the M range is reported separately for the two sets of models), the resulting differences in the derived acceptable range of M are smaller. This is due to ages higher than 1 Gyr for most of the galaxies and to slightly different ages of the Ma05 models selected by the best-fitting procedure (to fit the whole SED) with respect to those selected among the BC03 models. We like to emphasis that even when the derived absolute magnitudes between the two models are different, the related stellar mass estimates do not exhibit the same difference, since the /L ratio is consequently different.
Finally, we like to recall that in the models selection for each galaxy, we kept the lowest value of dust reddening needed to obtain acceptable fits. For some galaxies for which we have excluded A from the accepted models, fits with some dust reddening were in principle good enough to be selected. If we would have included also these fits, the acceptable ranges of their luminosities and stellar mass content would have been enlarged on the side of their upper limit. Furthermore, possible younger ages could have been included. This would have strengthened our conclusions on the existence of very massive galaxies at 1.5, even if admitting a larger range of age values. Since the data we have at hand do not allow us to reliable estimate the possible dust reddening affecting our galaxies, we prefer to be conservative in accepting the minimum value of the extinction requested to fit their SEDs, considering their early-type nature.
4 Results and discussion
In the following sections, we analyze the main properties of the 10 early type galaxies summarized in Table 3. In particular, we discuss the possibility of a common origin and/or evolution (§4.1) and we compare their properties with those of local galaxies (§4.2).
4.1 Early-type galaxies at : evidences for different SF histories?
The bulk of stars in 6 out of the 10 galaxies is 3-5 Gyr old while the other 4 show mean stellar ages of about 1-2 Gyr, even assuming the highest value of metallicity adopted in our fitting procedure. Figure 3 shows this evidence taking also into account the different redshift of the galaxies (i.e., different age of the Universe at their redshift). For each galaxy we computed the quantity
| (2) |
defined as the difference between the age of the Universe at the redshift of the galaxy and the age of the stellar population of the galaxy itself as derived in §3, and the corresponding formation redshift :
| (3) |
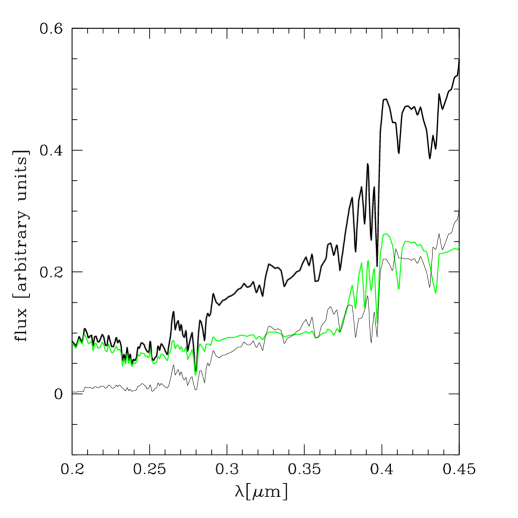
In the left panel of Figure 3, the quantities defined above are plotted against the redshift of the galaxies. Values of Age close to 0 indicate that stars are as old as the Universe at the galaxy redshift, i.e., their formation redshift is high. Larger values of Age means that the stellar populations are, on average, younger than the Universe at the galaxy redshift and that at least a fraction of them formed recently. As to our galaxies, the figure clearly shows a quite large spread in their age and formation redshift. Indeed, the stellar content of 3 of them (S2F5_109, S2F1_511, S7F5_45) appears to be formed when the Universe was about 2.5 - 3.0 Gyr old (i.e., 2), 2 galaxies (S2F1_142 and S2F1_389) show the bulk of their stellar content as formed when the Universe was about 2 Gyr old (i.e., 3) while the remaining 5 (S7F5_254, S2F1_633, S2F1_357, S2F1_443 and S2F1_527) present a stellar content not younger than 1 Gyr with respect to the Universe (i.e., as formed at 5). The right panel of the Figure 3 represents these results by showing the age of the Universe at (squares) and at (triangles) for each of the galaxies. The length of the line connecting the two points corresponds to the age of their stellar population, while the upper scale helps in relating the age of the Universe at and itself. Again it can be noticed that all the galaxies have , and that for the oldest ones (i.e., those represented by the longest lines, namely S7F5_254, S2F1_633, S2F1_357, S2F1_443 and S2F1_527) the formation redshift is . These different formation redshift derived for the galaxies of the sample suggests that either i) the bulk of stars in the various galaxies formed at different epochs, i.e. different early-type galaxies experienced their main burst at different redshift, or ii) some of them have experienced later bursts of star formation after the main event, i.e., they are characterized by longer SF time scale, and the derived age parameter is not corresponding to the true value. In the first hypothesis, the main star formation event from which the stellar content of massive early-type galaxies originated took place at different epochs for different galaxies at . The second hypothesis is based on the fact that most of the spectro-photometric data we used to constrain the stellar ages of our galaxies sample the rest frame UV and optical range, which are very sensitive to the presence of even small amounts of young ( 1 Gyr) stars. In other words, even a small fraction of stars younger than 1 Gyr may contribute for more than 90% to the luminosity at and up to 50% at , mimicking a young age for the whole population. This can be seen in Figure 4 where we show the synthetic spectrum of a composite stellar population (thick black line) resulting from the sum of a 3 Gyr old SSP providing 90% of the stellar mass (thin black line) and of a 0.5 Gyr SSP accounting for 10% of the stellar mass (green/grey line).
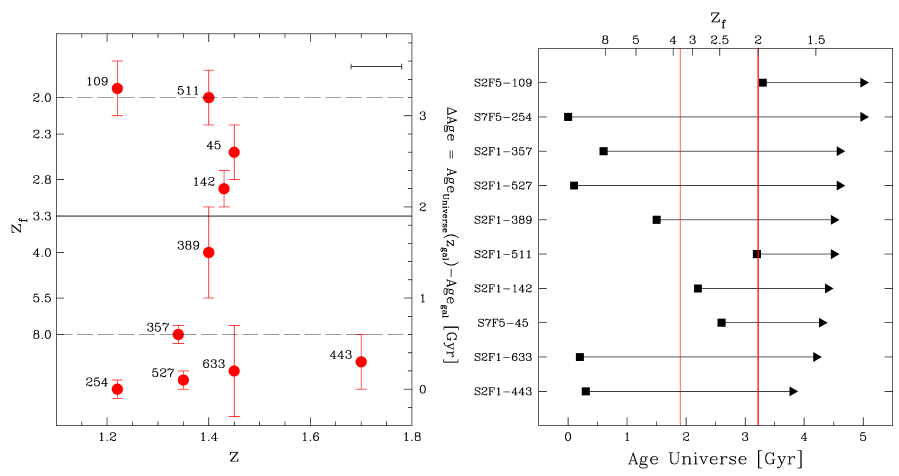
It is clear from the figure that the young population dominates or becomes comparable to the old component contribution in the emission at m in spite of the negligible mass fraction. This shows that while we can be confident that old age estimates (i.e., 3 Gyr, ) most probably approaches the real age of the stellar bulk of the galaxies, young values could be those characterizing only a small fraction of their stellar content. Thus, some of the early-types can have experienced secondary weak star formation events during their evolution. In particular, S2F5_109, S2F5_45, S2F1_511 for which we derived Gyr and could just suffered minor star forming events at that redshift while the bulk of their stellar content could be formed at higher redshift. The data we have in hand do not allow us to discriminate between true young ages of the stellar content of galaxies and recent minor burst superimposed on a much more massive content of old stars, i.e. we are not able to distinguish between different epochs of formation and/or different star formation histories. However, these results indicate that the evolution of the population of field massive early-type galaxies is not unique but characterized by different SFHs, and that the formation could be distributed in a range of redshift at .
4.2 (4000Å): comparison with local early-type galaxies
Given the rest-frame absolute magnitudes of the 10 galaxies (M) and assuming that they evolve passively from (the minimum redshift of our sample) to ( mag), the resulting K’-band luminosity of these early-type galaxies at would be LL∗. Thus, these galaxies are the high-z counterpart of the most massive early-types populating the bright end of the local luminosity function of galaxies. A comparison between the properties of this class of galaxies at and at provides constraints on their evolution.
Stellar Age - Since the local Universe is Gyr older than the Universe at , we expect to observe differences between the properties of our early-type galaxies and those at consistent with this difference in their age. Actually, the stellar population of local high mass early-type galaxies seems to have ages of about 10 Gyr or more (e.g. Caldwell et al. 2003). These values, derived by means of detailed and accurate analysis of the galaxies spectral narrow-band indices, can be directly compared with those of derived for our sample of galaxies. Indeed, at ages greater than 10 Gyr differences between the model parameter age and the quantity defined above are less than 1 Gyr, even for long SF time scale (e.g., Gyr). Our galaxies at are Gyr old, in agreement with the younger age of the Universe at that redshift. Thus, the SF history followed on average by these massive galaxies has to be consistent with the observed nearly passive aging.
(4000Å) - The available spectral data of the 10 galaxies can be used to construct the average (rest-frame) optical spectrum of early-type galaxies at the mean redshift , that can be compared with the SED of their local counterparts. In the previous section (§4.1) we have discussed the spread in age of the stellar content of the galaxies in the sample. Since different stellar ages mean different spectro-photometric properties, we have averaged the spectra of the 10 galaxies after dividing them according to their ages: i) (old) composed by galaxies with agew Gyr (namely S7F5_254, S2F1_527, S2F1_389, S2F1_633, S2F1_443, S2F1_357) and ii) (young) composed by galaxies with agew Gyr (namely S2F5_109, S2F1_511, S2F1_142, S7F5_45). Since among the six old galaxies only two (S2F1_633 and S2F1_443) are at , the average spectrum derived by this group of galaxies starts at m, while that of the young one at m. In Figure 5 we show the two average spectra reported at normalized around m rest-frame: thick black line stands for the old spectrum while thin black line for the young one. For comparison we also report (thick green/grey line) the mean observed spectrum of local elliptical/S0 galaxies by Mannucci et al. (2001, Man01). In the top right corner, besides the Man01 spectrum (thick green/grey line), we show the synthetic spectra of SSPs 2 Gyr old (thin black line) and 4 Gyr old (thick black line), derived from the BC03 models, adopting solar metallicity and Salpeter IMF.
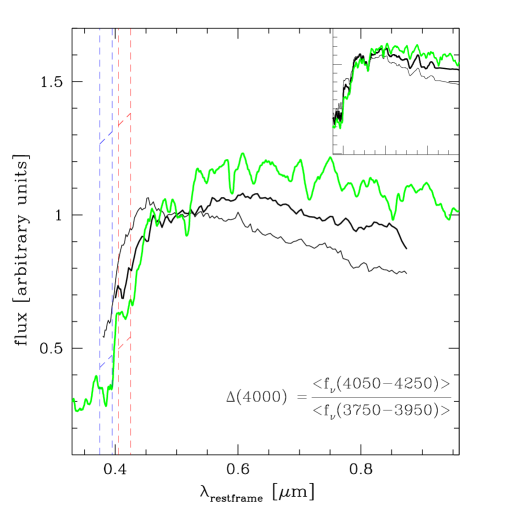
The most striking feature, apart from the overall similarity, is the steeper J-K’ slope shown by both the two composite spectra of early-type galaxies at with respect to that at . For the young spectrum it is also evident a smaller 4000Å break with respect to the Man01 spectrum. Indeed, the flux of the spectrum at below 4000Å (rest-frame) is about twice that of the local one, while above 4000Å the ratio between the flux of the two spectra is less than 1.5. Both these two features are clear signs of younger ages at with respect to , as can be deduced looking at the synthetic spectra in the top right corner of the figure where the 2 Gyr SSP and 4 Gyr SSP well reproduce the overall continua of the young and old spectra respectively. In order to better quantify this evidence, we have estimated the (4000Å) index of the average spectra at and at (from the young spectrum only, since the old one does not cover the needed blue part of the spectral range due to its slightly lower mean redshift) adopting the definition of Bruzual (1983). While massive early-type galaxies at are characterized by (4000Å)z∼1.5=1.7, their local counterparts have an index (4000Å)z=0=2.2. Thus, the SFH followed by massive field early-type galaxies has to be able to produce during an interval of about 8-9 Gyr (i.e., from to ) the observed variation in the (4000Å) index.
Figure 6 shows the expected values of the (4000Å) index as a function of the mass weighted age of the stellar populations (scale and label on the bottom). For useful comparison, scale and labels on the top give the correspondence between and assuming . Our sample of early-type galaxies is at with a typical mean age of . In the upper panel, we show the index value as a function of for models with different IMFs while the SFH is described by an exponentially declining SFR with time scale Gyr (solar metallicity). It is clear that the (4000Å) index is in fact independent of the IMF. For this reason, the models shown in the other two panels have been obtained considering the Salpeter IMF only. In the middle panel the dependence of the index on the metallicity for fixed SFH ( Gyr) is shown, while the lower panel presents the dependence on different SFHs for fixed metallicity (Z=Z⊙).
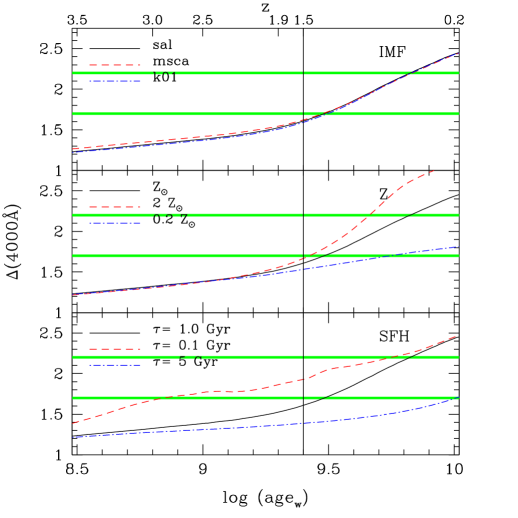
It can be seen that metallicity ZZ⊙ produces a (4000Å) index much smaller than those observed both at high and at low redshift and fails to produce the observed variation (about a factor ) from to . Analogous arguments apply also to metallicity ZZ⊙, while ZZ⊙ better matches the observations. As to the SFH, for the same value of an almost coeval stellar population (=0.1Gyr) is always characterized by a (4000Å) much higher than that of populations with larger age spread (1.0 Gyr). In particular, SFHs described by times scales Gyr fail to reproduce the observed local value ((4000Å)=2.2) even for ages as old as the Universe (i.e., 13 Gyr). On the other hand, extremely short SF time scales ( 0.1 Gyr) would need more than 8-9 Gyr (i.e., 10 Gyr) to reproduce the observed variation of (4000Å) from to . Thus, the more reliable SFHs able to produce the (4000Å) index observed in massive early-types at and at are those characterized by time scales Gyr and metallicity ZZ⊙. It is worth noting that these models lead to date the stellar content of the mean early-type galaxy as 2.5 Gyr old, that is consistent with the mean age of the single galaxies as derived through the comparison between their individual spectro-photometric properties and synthetic models of Sec. 3.
On the basis of the mean age of the stellar populations derived from our analysis (§4.1) and on the likely SFHs they could follow (§4.2), we can constrain the formation of our massive early-type galaxies in the redshift range . This result agrees with the findings of Thomas et al. (2005) that is based on what they call “archaeology approach”. Using the models of absorption line indices based on the Ma05 models, they performed a detailed analysis of spectral properties of 124 local early-type galaxies in different environments, and they concluded that massive field early-types should have formed their stellar content around with short SF timescales. Furthermore, analysis of the Fundamental Plane properties of early-type galaxies at in the field (van der Wel et al. 2004; van Dokkum et al. 2003) and in clusters (e.g. Bender et al. 1996) show strong evidences of the formation of their stars at . Our results confirm the prediction of the previous works extending the analysis of the age and star formation history of field early-type galaxies to higher redshift (). Indeed, previous studies of field early-type galaxies were focused on either lower redshift regimes (i.e., : Mignoli et al. 2005; Treu et al. 2005; van der Wel et al. 2004; van der Wel et al. 2005) or on less massive objects (i.e., LL∗: Daddi et al. 2005; McCarthy et al. 2004). We like to note that the above results imply that old (1 Gyr) massive ( M⊙) early-type galaxies should be observed fully assembled at redshift as well as the progenitors characterized by very high star formation rates. In fact, some observational evidences seem to confirm these expectations. Early-type galaxies with stellar masses of the order of M⊙ and ages of about 1 Gyr are being found at from deep near-IR selected samples (Longhetti et al. 2004; Saracco et al. 2004; van Dokkum et al. 2004; Cimatti et al. 2004) and some of the SCUBA sources at turned out to be massive galaxies with star formation rates of many hundreds M⊙ yr-1 (Genzel et al. 2003; Smail et al. 2002).
5 Summary and conclusions
We presented the analysis of 10 massive early-type galaxies revealed in a complete sample of 36 bright (K’ 18.5) EROs (R-K’ 5) selected from the MUNICS survey. The low resolution near-IR spectra obtained as part of the on-going spectroscopic follow-up of the whole sample identify them as early-type galaxies at redshift . Given their extremely bright K’-band absolute magnitudes, their resulting stellar masses are well in excess of M⊙ leaving aside any model assumption.
We compared the broad-band photometry and the near-IR spectra with a grid of spectrophotometric models. By means of a -minimization procedure, we defined a limited set of all the synthetic templates which well reproduce the spectro-photometric properties of the galaxies. This set provided us with the acceptable range of possible values of their main physical parameters, i.e. K’-band luminosity, stellar mass and age of the bulk of their stellar content. This part of the analysis led to the following results:
field massive early-type galaxies at exhibit an apparent spread in the age of their stellar populations. In particular, the bulk of stars in 6 out of the 10 galaxies is 3-5 Gyr old while the remaining 4 ones show mean stellar ages of about 1.5 Gyr.
the observed spread in age can be explained either assuming a corresponding spread in the formation redshift or as due to the underestimate of the real stellar age for the apparent young galaxies. In the former hypothesis, the formation redshift of the oldest 6 galaxies is while for the youngest ones is . In the second hypothesis, even the apparent young galaxies have a stellar content as old as the other galaxies, but it is hidden by a negligible fraction of young stars formed in a recent ( Gyr) star forming episode. If this is the case, it would be difficult to disentangle the two populations. Anyway, these results indicate that the star formation history of the population of field massive early-type galaxies at is not unique, being not quiescent for some of them.
Furthermore, we averaged the near-IR spectra of the 10 early-type galaxies after dividing them into two groups: i) the (old) one composed of galaxies with agew Gyr and ii) the (young) one composed of galaxies with agew Gyr. Their comparison with the mean observed spectrum of the local early-type galaxies allowed us to derive the following results:
both the two composite spectra of early-type galaxies at show a m steeper slope with respect to their local counterpart. The young spectrum allows also the measure of the 4000Å break, and its value ((4000Å)z∼1.5=1.7) is lower with respect to that measured on the local template ((4000Å)z=0=2.2). Both these two features are clear signs of younger ages at with respect to , independently of any model assumption used to describe the index behavior.
among the SFHs adopted to model the spectral properties of the galaxies, the more reliable one, capable to reproduce the values of the (4000Å) index both at and at , is characterized by a SF time scale shorter than 1 Gyr with metallicity not higher than the solar value.
on the basis of the average spectral shape and of the (4000Å) index value, the stellar content of the early-type galaxies is dated as 3 Gyr old and their formation is well described assuming . This result is consistent with the stellar ages derived in the first part of our analysis based on the study of the individual spectral continua.
Our results confirm the predictions of previous works based on samples of local field and cluster galaxies, extending the analysis of the age and star formation history of field massive early-type galaxies to higher redshift (). All these findings imply that old (1 Gyr) massive ( M⊙) early-types galaxies are expected at redshift , together with their progenitors characterized by high star formation rates. Recent observational evidences seem to confirm these expectations suggesting that massive early-type galaxies formed their stars at over a time scale of about 1 Gyr or less, and implying the nearly passive evolution observed from to (i.e., favouring the monolithic scenario). These results should then be considered as strong constraints for the models of galaxy formation, and in particular for the semianalytic codes which attempt the link between the baryonic mass assembly and the resulting luminous properties of the formed galaxies.
Acknowledgments
We thank the anonymous referee for useful comments which helped to improve the paper. We thank the staff of the TNG for their support during the observations. PS acknowledges a research fellowship from the Istituto Nazionale di Astrofisica (INAF). This work has received partial financial support from the Italian Ministry of University and the Scientific and Technological Research (MIUR) through grant Cofin-03-02-23. The MUNICS project is supported by the Deutsche Forschungsgemeinschaft, Sonderforschungsbereich 375, Astroteilchenphysik
References
- (1) Allen C. W., 1973, Astrophysical Quantities, Athlon Press, London
- (2) Baugh C.M., Benson A.J., Cole S., Frenk C.S., Lacey, C. 2003, proc of ‘The Mass of Galaxies at Low and High Redshift’, Venice 2001, eds. R. Bender, A. Renzini [astro-ph/0203051]
- (3) Bender R., Ziegler B., Bruzual G., 1996, ApJ 463, L51
- (4) Bennet C.L., Halpern M., Hinshaw G. et al. 2003, ApJS 148, 1
- (5) Bolzonella M., Miralles J.-M., Pellò R. 2000, A&A 363, 476
- (6) Bruzual A.,G. 1983, ApJ 273, 105
- (7) Bruzual A.,G. & Kron R.G. 1980, ApJ 241, 25
- (8) Bruzual A.,G. & Charlot S. 2003 (BC03), MNRAS 344, 1000
- (9) Bundy K., Ellis R. S. & Conselice C. J. 2005, ApJ in press, [astro-ph/0502204]
- (10) Caldwell N., Rose J. A., Concannon K. D., 2003, AJ 125, 2891
- (11) Calzetti D., Armus L., Bohlin R. C., Kinney A. L., Koorneef J., Storchi-Bergmann R. 2000, ApJ 533, 68
- (12) Chabrier G. 2003, PASP 115, 763
- (13) Cimatti A., Daddi E., Renzini A., et al. 2004, Nature 430, 184
- (14) Cimatti A., Daddi E., Cassata P. et al. 2003, A&A 412, L1
- (15) Daddi E., Renzini A., Pirzkal N. et al. 2005, ApJ in press, [astro-ph/0503102]
- (16) Drory N., Feulner G., Bender R., et al. 2001, MNRAS 325, 550
- (17) Drory N., Bender R., Feulner G., Hopp U., Maraston C., Snigula J., Hill G. J., 2004, ApJ 608, 742
- (18) Genzel R., Baker A. J., Tacconi L. J., Lutz D., Cox P., Guilloteau S., Omont A., 2003, ApJ 584, 633
- (19) Kauffmann G. & Charlot S. 1998, MNRAS 297, L23
- (20) Kinney A. L., Calzetti D., Bohlin R. C., McQuade K., Storchi-Bergmann T., Schmitt H. R., 1996, ApJ, 467, 38
- (21) Kochanek C.S., Pahre M.A., Falco E.E., et al. 2001, ApJ 560, 566
- (22) Kroupa P., 2001, MNRAS, 322, 231
- (23) Longhetti M., Saracco P., Giallongo E. et al. 2003, proc. of ‘Multiwavelength Mapping of Galaxy Formation and Evolution’, [astro-ph/0312293]
- (24) Mannucci F., Basile F., Poggianti B. M., et al., 2001 (Man01), MNRAS 326 745
- (25) Maraston C. 2005 (Ma05), MNRAS submitted [astro-ph/0410207]
- (26) McCarthy P.J., Le Borgne D., Crampton D., et al. 2003, ApJ 614, L9
- (27) Mignoli M., Cimatti A., Zamorani G., et al. 2005, A&A in press, [astro-ph/0504248]
- (28) Miller G. E., Scalo J. M. 1979, ApJS 41, 513
- (29) Pozzetti L., Mannucci F. 2000, MNRAS 317, L17
- (30) Renzini A. & Cimatti A. 1999, ASP Conf. Ser. 193, 312
- (31) Salpeter E. E. 1955, ApJ 121, 161
- (32) Saracco P., Longhetti M., Severgnini P., et al. 2003, A&A 398, 127
- (33) Saracco P., Longhetti M., Giallongo E., et al. 2004, A&A 420, 125
- (34) Saracco P., Longhetti M., Severgnini P., et al. 2005, MNRASLet 357, 40
- (35) Scalo J. M. 1986, Fundamentals of Cosmic Physics 11, 1
- (36) Seaton M.J. 1979, MNRAS 187, 73
- (37) Severgnini P., Della Ceca R., Braito V., et al. 2005, A&A 431, 87
- (38) Smail I., Ivison R. J., Blain A. W., Kneib J.-P., 2002, MNRAS 331, 495
- (39) Spergel D.N., Verde L., Peiris H.V. et al. 2003, ApJS 148, 175
- (40) Thomas D., Maraston C., Bender R., Mendes de Oliveira C. 2005, ApJ 621, 673
- (41) Tinsley B.M. 1977, ApJ 211, 621
- (42) Treu T., Ellis R.S.,Liao T.X. et al. 2005, ApJ submitted, [astro-ph/0503164]
- (43) van der Wel A., Franx M., van Dokkum P. G., Rix H.-W., 2004, ApJ 601, L5
- (44) van der Wel A., Franx M., van Dokkum P. G. et al. 2005, ApJ 601, L5
- (45) van Dokkum P. G., Ellis R. S., 2003, ApJ 592, L53
- (46) van Dokkum P. G., Franx M., Forster Schreiber M.N. et al. 2004, ApJ 611, 703
- (47) van Dokkum P.G. & Stanford S.A. 2001, ApJ 562, L35