Secular Evolution Via Bar-Driven Gas Inflow: Results from BIMA SONG
Abstract
We present an analysis of the molecular gas distributions in the 29 barred and 15 unbarred spirals in the BIMA CO (J=1–0) Survey of Nearby Galaxies (SONG). For galaxies that are bright in CO, we confirm the conclusion by Sakamoto et al. (1999b) that barred spirals have higher molecular gas concentrations in the central kiloparsec. The SONG sample also includes 27 galaxies below the CO brightness limit used by Sakamoto et al. Even in these less CO-bright galaxies we show that high central gas concentrations are more common in barred galaxies, consistent with radial inflow driven by the bar. However, there is a significant population of early-type (Sa–Sbc) barred spirals (6 of 19) that have no molecular gas detected in the nuclear region, and have very little out to the bar co-rotation radius. This suggests that in barred galaxies with gas-deficient nuclear regions the bar has already driven most of the gas within the bar co-rotation radius to the nuclear region, where it has been consumed by star formation. The median mass of nuclear molecular gas is over four times higher in early type bars than in late type (Sc–Sdm) bars. Since previous work has shown that the gas consumption rate is an order of magnitude higher in early type bars, this implies that the early types have significantly higher bar-driven inflows. The lower accretion rates in late type bars can probably be attributed to the known differences in bar structure between early and late types. Despite the evidence for bar-driven inflows in both early and late Hubble type spirals, the data indicate that it is highly unlikely for a late type galaxy to evolve into an early type via bar-induced gas inflow. Nonetheless, secular evolutionary processes are undoubtedly present, and pseudo-bulges are inevitable; evidence for pseudo-bulges is likely to be clearest in early-type galaxies because of their high gas inflow rates and higher star formation activity.
1 Introduction
Nearly three-quarters of all nearby disk galaxies have a bar (Eskridge et al., 2000; Meneńdez-Delmestre et al., 2004); recent studies suggest that the bar fraction remains high at z 0.7 (Sheth et al., 2003), and is perhaps constant to a redshift of one (Elmegreen & Elmegreen, 2004; Jogee et al., 2004a). Models show that the non-axisymmetric bar potential induces large scale streaming motions in the stars and gas (Sellwood & Wilkinson 1993 and references therein, Athanassoula 1992a, b). This mixing is responsible for the shallower chemical abundance gradients observed in barred spirals compared to unbarred spirals (Vila-Costas & Edmunds, 1992; Zaritsky, Kennicutt, & Huchra, 1994; Martin & Roy, 1994; Martinet & Friedli, 1997). Studies of gas kinematics in the bar indicate that molecular gas is flowing inwards down the bar dust lanes (Downes et al., 1996; Regan, Sheth & Vogel, 1999; Sheth et al., 2000, 2002). Enhancement of the star formation activity in the nuclei of barred spirals (e.g., Sérsic & Pastoriza 1967; Hawarden et al. 1986; Ho, Filippenko, & Sargent 1997) suggests that either the conditions at the centers of barred spirals are more favorable for star formation or these regions have a higher gas content. We note that the enhancement in star formation activity is primarily found in early Hubble type barred spirals (Ho, Filippenko, & Sargent, 1997). Ho et al. divide the galaxies with the Hubble types Sa-Sbc as early types, and galaxies with type Sc–Sdm as late types; we use this division throughout the remainder of this paper (see also §2). The observational results noted above provide indirect observational evidence that bars transport gas towards their centers.
Models also suggest that further inflow of gas by a “bars-within-bars” scenario may fuel active galactic nuclei (Shlosman, Frank, & Begelman, 1989), although the evidence for such fueling is weak (Regan & Mulchaey, 1999; Knapen, Shlosman, & Peletier, 2000; Laine et al., 2002; Laurikainen, Salo & Buta, 2004). Other studies have suggested that bar-induced gas inflows may lead to the formation of new (pseudo-) bulges (e.g., Kormendy 1993, see also recent review by Kormendy & Kennicutt 2004), and evolve late Hubble type spirals into early Hubble types (e.g., Friedli & Benz 1995; Kenney 1996; Zhang 1999). The most dramatic prediction is that bars may destroy themselves if they accumulate sufficient mass at their centers (Pfenniger & Norman 1990; Friedli & Benz 1993; Norman, Sellwood, & Hasan 1996; Bournaud & Combes 2002; Athanassoula 2003; Shen & Sellwood 2004; see also review by Kormendy & Kennicutt 2004 and references therein).
Starburst activity, the formation of a pseudo-bulge, secular evolution of a galaxy along the Hubble sequence, and the destruction of the bar are all expected to occur when gas accretes in the nuclear region of a galaxy. Is there any direct evidence for excess gas at the center of barred spirals? While studies of individual galaxies have shown that at least some bars have a substantial amount of molecular gas near their centers (e.g., Kenney 1996; Turner 1996), only one study has addressed the issue of whether the central regions of barred spirals are systematically more gas rich than those in unbarred spirals. With a sample of twenty (ten barred and ten unbarred) galaxies, the Owens Valley - Nobeyama Radio Observatory (NRO-OVRO) survey (Sakamoto et al., 1999a) found that the central concentration (fcon), defined as the ratio of the nuclear molecular gas surface density () to the total (disk-averaged) molecular gas surface density (), is significantly higher in barred spirals than unbarred spirals (Sakamoto et al., 1999b). While fcon increases when gas is transported to the center, it decreases when gas is consumed by circumnuclear star formation. Since barred spirals have elevated circumnuclear star formation activity (e.g., Sérsic & Pastoriza 1967; Hawarden et al. 1986; Ho, Filippenko, & Sargent 1997), a priori, one expects lower fcon values in barred spirals, unless there is a fresh influx of molecular gas. Thus a higher fcon value in barred spirals than unbarred spirals is strong evidence for bar-induced gas inflow and accumulation. Moreover, fcon is robust against biases in galaxy size, mass, and distance. In addition, given the shallower metallicity gradients typically found in barred spirals, variations in CO brightness with metallicity would cause fcon to be smaller in barred than unbarred spirals, the opposite of what is observed (Ho, Filippenko, & Sargent, 1997).
Although the NRO-OVRO result is statistically significant, the sample size is modest (20 galaxies) and consists of CO-bright galaxies111 The NRO-OVRO survey chose galaxies with integrated intensities of I 10 K km s-1 in any one of the 50 FCRAO pointings (typically the central pointing). We use the 10 K km s-1 selection as the division between CO-bright and CO-faint galaxies for the remainder of this paper.. The NRO-OVRO sample has only four galaxies of Hubble type Sc or later. Hence it is unclear whether the observed difference in fcon between barred and unbarred spirals is representative of all spiral galaxies. Does this result extend to CO-faint spirals? How does it vary with Hubble type? Is there any evidence for secular evolution from late to early Hubble type?
With the larger and more diverse sample of spiral galaxies in SONG we can address these outstanding questions. SONG contains three times as many bars as the NRO-OVRO study, and 50% more unbarred spirals. There are 27 galaxies in SONG with lower CO-brightness than the NRO-OVRO sample because SONG galaxies were chosen based on an apparent optical magnitude instead of CO-brightness. Moreover, SONG has 15 spirals of Hubble type Sc through Sd; thus we can directly evaluate the influence of bars on late Hubble type spirals. One other advantage of SONG is that it imaged the CO emission over the entire bar region in all but one of the barred spirals; hence we can compare the gas distribution in the central region to the available gas in the bar and place the observations in the context of secular evolution.
2 OBSERVATIONS, DATA REDUCTION & ANALYSIS
In SONG, the molecular gas distributions (using the CO J=1–0 line) in 44 nearby spirals (Sa-Sd) were mapped with the BIMA interferometer (Welch et al., 1996) and the NRAO222The National Radio Astronomy Observatory is a facility of the National Science Foundation, operated under cooperative agreement by Associated Universities, Inc. 12m single dish telescope at Kitt Peak. The SONG sample galaxies are listed in Table 1. The details of the survey and properties of the sample are described in greater detail in Helfer et al. (2003), in particular see §2.2). In some cases the distances and position angles used by us are different than those noted by Helfer et al. (2003); we used the most recent measurements from the literature. We note that we checked the results of our study with the Helfer et al. distances and position angles and found no systematic differences and the results from this study remain unchanged. The selection criteria for the SONG sample were: heliocentric velocity VHEL 2000 km s-1, declination -20∘, inclination 70∘, and apparent magnitude B 11. This lead to a sample that is representative of disk galaxies in the local Universe.
The typical data cube has a synthesized beam of 6 and a field of view of 3. In a 10 km s-1 channel the typical noise is 58 mJy beam-1. The measured fluxes are accurate to 15%; uncertainties are due to the absolute amplitude calibration. The galaxy centers are obtained from the 2MASS Large Galaxy Survey (Jarrett et al., 2003).
With the BIMA SONG data, we measure the molecular gas mass (Mnuc) and surface density () in the central kiloparsec using standard routines in MIRIAD (Sault, Teuben & Wright, 1995); we discuss why we chose the central kiloparsec at the end of this section. We use the FCRAO or the NRAO 12m SONG data for the total molecular gas mass (Mtot) and surface density (). The mass is calculated using,
| (1) |
The factor of 1.36 is the usual correction for elements other than hydrogen. This equation uses a CO-to-H2 conversion factor of 2.8 1020 cm-2 (K km s-1)-1 (Bloemen et al. 1986). The exact value for the conversion factor is controversial and may vary by factors of 2–4 – see discussion in Young & Scoville (1991). is then calculated by dividing this gas mass by the area. Twelve of the 44 galaxies have relatively faint emission in the central kiloparsec; we list a 2 upper limit for these galaxies. The results are shown in Tables 2 and 3 for the barred and unbarred spirals respectively. Throughout this paper, we use the RC3 classification (SB and SAB) for barred spirals.
As noted earlier, we classify galaxies of type Sa–Sbc as early types, and galaxies with types Sc–Sd as late types. Since a significant number of galaxies in SONG are type Sbc (14 of 44), we discuss briefly the motivation for the adopted division. It is based on the significant differences in the star formation properties between galaxies of type Sbc and earlier, and those of later types (Ho, Filippenko, & Sargent, 1997). Since star formation depends on gas content, it is reasonable to use the same boundaries as Ho et al (1997b), otherwise comparison with previous studies becomes difficult. Furthermore the division is also motivated by prior observational and theoretical work on properties of barred galaxies (Elmegreen & Elmegreen, 1985; Combes & Elmegreen, 1993; Huang et al., 1996). These studies have found a fundamental difference in the properties of early and late type bars. Early type bars generally have a ”flat” photometric profile, while late type bars usually have an ”exponential” profile. Of the 14 Sbc galaxies, 11 are barred spirals. We examined the optical/IR data for these 11 galaxies, and find that 7 are clearly flat bars (NGC 2903, NGC 4321, NGC 4303, NGC 3992, NGC 3344, NGC 3953, NGC 4051). The optical/IR data for the other four are not good enough to make a definitive classification, although the CO kinematics in NGC 5005 suggest that it too hosts a strong bar of the type usually found in early type barred spirals. For these reasons, we place the Sbc galaxies in the the early type category.
In column 2 of Tables 2 and 3 we list the CO flux from the central kiloparsec in the combined (BIMA NRAO 12m single dish) maps for the 24 galaxies for which we collected on-the-fly (OTF) data. In column 3 we list the CO flux from the BIMA-only data. In most cases the BIMA-only data recover nearly all the CO flux. There are a few exceptions, where the flux in the combined maps is 40-50% higher than in the BIMA-only maps: IC342, NGC 0628, NGC 3521, and NGC 4414. In these cases, the relative angular sizes of the beam and galaxy, the inclination, or the CO distribution likely have contributed to spatial filtering or beam smearing effects.
We choose to use the BIMA-only maps to measure Mnuc because in most cases the BIMA-only fluxes are consistent with Mnuc from the combined map (see also Figure 53 in Helfer et al. 2003 and discussion in Helfer et al. 2002). There is no evidence that barred or unbarred spirals are preferentially affected by the lack of single-dish data, and we want to use as homogeneous a dataset as possible. We did not correct the BIMA-only data for beam smearing. Our typical 6 beam subtends an area of diameter of 1 kiloparsec for almost all galaxies in our sample, as can be seen in Table 2 in Helfer et al. (2003) where the area subtended is shown in the plane of the sky. In the plane of a galaxy, the beam may subtend a larger region (at most by cos ) along the galaxy minor axis. For the galaxies in our sample this correction is less than a factor of 2 ( 60∘), and therefore our beam typically subtends 1 kpc along the minor axis of the galaxy plane.
In our analysis we also plot the seven additional galaxies from the NRO-OVRO survey that are not in common with SONG; these include five unbarred galaxies, which are rarer in both samples. We confirmed that the SONG data are consistent with the NRO-OVRO data by comparing the measured fluxes for the 13 galaxies in common between the two samples; after accounting for differences in the CO-to-H2 conversion factor and adopted distances, the fluxes are consistent within the errors.
We derive Mtot from the global CO fluxes obtained by the FCRAO survey (Table 3 in Young et al. 1995); these fluxes were derived from fitting an exponential CO profile to several discrete pointings along the major and minor axis of each galaxy. SONG, on the other hand, measured the CO fluxes using OTF maps for 24 galaxies, and discrete pointings for the remaining galaxies. The SONG fluxes are consistent with the FCRAO survey (see Figure 51 in Helfer et al. 2003). In the five cases where we did not have FCRAO fluxes, we used the SONG fluxes for Mtotwhere available. These are also listed in Tables 2 and 3.
We measured Mnuc in the central one kiloparsec because, as discussed in §1, most of the evolutionary effects depend on the accumulation of gas near the nucleus. The choice is also partially influenced by Sakamoto et al. (1999a, b) who showed that over half of the galaxies in their sample have nuclear concentrations that are well-described by an exponential scale length of less than 500 pc. Though galaxies in the SONG dataset are less strongly concentrated (many are not even centrally peaked, see Regan et al. 2001), examining the inner kiloparsec provides consistency with the previous study. A different measure of nuclear gas properties might be a dynamical length scale such as the radius of the largest stable x2 orbit. However, locating the largest stable x2 orbit requires precise measurements of the rotation curve and potential (Regan & Teuben, 2003). This is difficult near the nuclei of galaxies due to the lack of high resolution data and the presence of streaming motions induced by the bar. Another measure might be to choose a bulge radius as determined from near-infrared images but deriving a unique bulge-disk decomposition is difficult. Yet another measure might be to choose a distance which is a standard fraction of the galaxy diameter. This choice is problematic because there is no evidence that nuclear properties of galaxies are connected with the disk properties. In fact, star formation properties of the circumnuclear regions are known to be distinct from those of the disk (Kennicutt, 1998). Hence we choose the central kiloparsec as our fiducial diameter for the nuclear region.
3 RESULTS
3.1 Molecular Gas Masses in the Central Kiloparsec of Barred and Unbarred Galaxies
The mass of the molecular gas in the central kiloparsec (Mnuc) is plotted against the total molecular gas mass in the galaxy (Mtot) in Figure 1333NGC 4699 is not shown in any of the figures because it only has an upper limit for the single-dish flux. However it is one of the galaxies with an upper limit for Mnuc and has no gas in its bar.. Barred spirals are shown with a circle and unbarred spirals with a triangle. SONG galaxies have filled symbols. The data from Sakamoto et al. (1999b) for galaxies not in common with the SONG sample are marked with open symbols. The diagonal lines indicate the fraction of the total gas mass in the central kiloparsec.
Before we discuss the nuclear masses, we note that there is no obvious difference in the distribution of Mtot between barred and unbarred spirals. The range for Mtot spans 108–1010 . For the entire SONG sample, the mean total molecular gas mass, Mtot = 41 109 for the barred spirals, and Mtot = 62 109 for the unbarred spirals. Comparing the red symbols (early type) to the blue symbols (late types) there is also no obvious difference in Mtot values between early and late Hubble type galaxies. This is consistent with large single dish surveys of molecular gas in galaxies (e.g., Sage 1993; Young et al. 1995).
The fraction of the molecular gas that is in the central kiloparsec varies by almost three orders of magnitude, from 0.001 to nearly 0.6. Figure 1 shows that galaxies with the highest values of this fraction and also those with the highest Mnuc are mainly early types, especially bars. Of the eight galaxies with nuclear gas mass fractions above 0.1, six are barred, and five of these six are early Hubble type galaxies.
Another eight barred spirals have only upper limits for their nuclear molecular gas mass. Five of these are early type bars; not only is no gas detected in the central kiloparsec, none is detected within the entire region interior to the bar. The existence of early-type barred spirals without any nuclear gas is consistent with bar-driven gas transport, as we discuss in the next section. In addition, we note that these results contrast with the emphasis of previous studies on large excesses of molecular gas in the central kiloparsec (Sakamoto et al., 1999b; Jogee et al., 2004b). For example, Jogee et al. (2004b) conclude that the central kiloparsec of barred spirals are significantly different from the outer disks with molecular gas masses in excess of 2108 , up to 3 109 . However, for the barred spirals in SONG, we find a range of nuclear masses from 107–109 , with a mean of 2 108 . Indeed, 18 of 29 barred spirals in SONG have Mnuc 2108 . Clearly the high Mnuc values emphasized by previous studies apply only to a subset of barred galaxies.
3.2 Bar-Driven Gas Transport
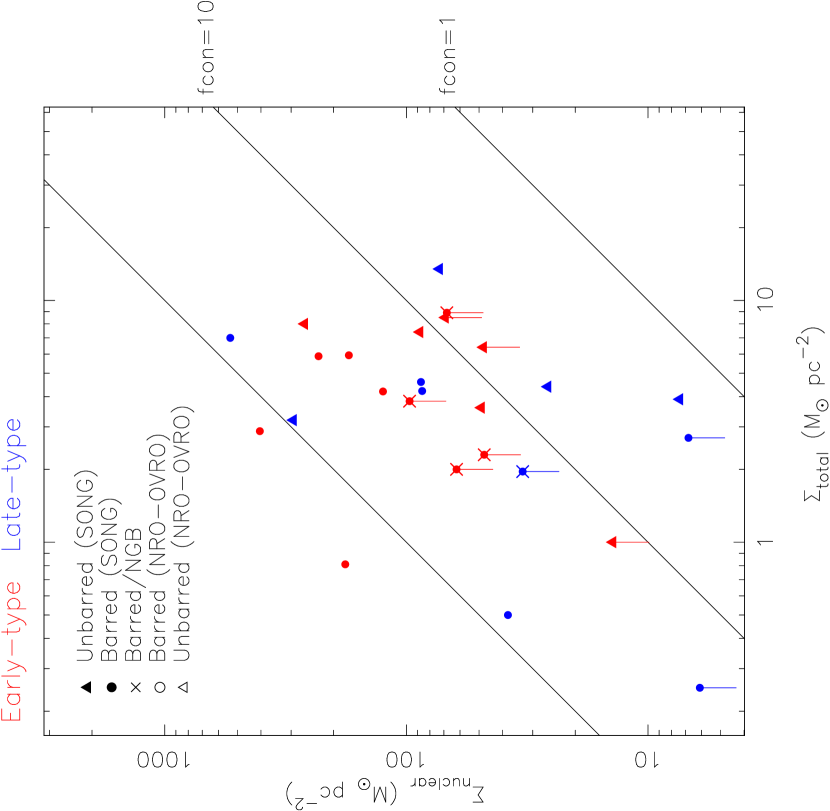
In Figure 2 we plot the molecular gas surface density for the central kiloparsec () versus that averaged over the galaxy disk inside () for all galaxies shown in Figure 1. The diagonal lines now indicate constant values of the central concentration parameter, fcon, which we discussed in §1.
The figure immediately shows a clear difference in central concentration (fcon) between barred and unbarred spirals. All six galaxies with fcon 100 are barred spirals. At the other end, for fcon 10, 7 of the 10 galaxies are unbarred. The higher fconvalues in barred spirals thus provide the strongest and most direct evidence for bar-driven gas transport, consistent with the results of Sakamoto et al. (1999b).
3.2.1 Bar Gas Transport in CO-faint Galaxies
As most of the highest fcon values are in CO-bright galaxies (larger symbols), we specifically address the question of whether bars also enhance fcon in CO-faint galaxies. Figure 3 shows only the twenty-six (16 barred and 10 unbarred) SONG galaxies with FCRAO brightnesses 10 K km s-1. We see that for fcon 10, nine of the 13 galaxies with significant detections in both total and nuclear surface densities are barred. Dividing the 26 CO-faint galaxies into two bins, we see that 11 of the 13 highest fcon galaxies are barred, compared with only five of the lowest 13 fcon galaxies. Thus even in the sample of galaxies that are not CO-bright, we conclude that there is evidence for bar-induced gas transport. This evidence is further strengthened upon noting that most of the low fcon barred galaxies have no gas at all within the bar co-rotation radius. The co-rotation radius is believed to be at 1.2 bar end (e.g., Athanassoula 1992b). Galaxies without gas in the bar region can be understood as those in which bar driven accretion has proceeded to the point where all the gas presently available to the bar has already been driven to the central region and converted into stars.
Jogee et al (2004b), in a paper that focused on the the role of bars in starbursts and secular evolution, proposed an evolutionary sequence for bars and starbursts. In Type I non-starbursts, gas is still distributed through the bar region and is only beginning to accumulate in the central region. Type II non-starbursts have significant central concentrations, but the gas has yet to accumulate to the surface densities required for a starburst. In starbursts, the sufficient gas has accumulated to drive a starburst.
We would therefore add a category, Type III non-starbursts, which are galaxies in the post-starburst phase. All the gas within the radius swept by the bar has already been driven to the nucleus and has been consumed by a starburst (or sufficient gas has been consumed so that the current gas surface density is lower than the critical density needed for a starburst). It would be interesting to look for evidence of this in the stellar populations. Such galaxies will be free of molecular gas within the bar region until some event enables the feeding of gas through the barrier that seems to be present near the bar co-rotation radius. If this happens, then central gas accumulations and starbursts would be episodic.
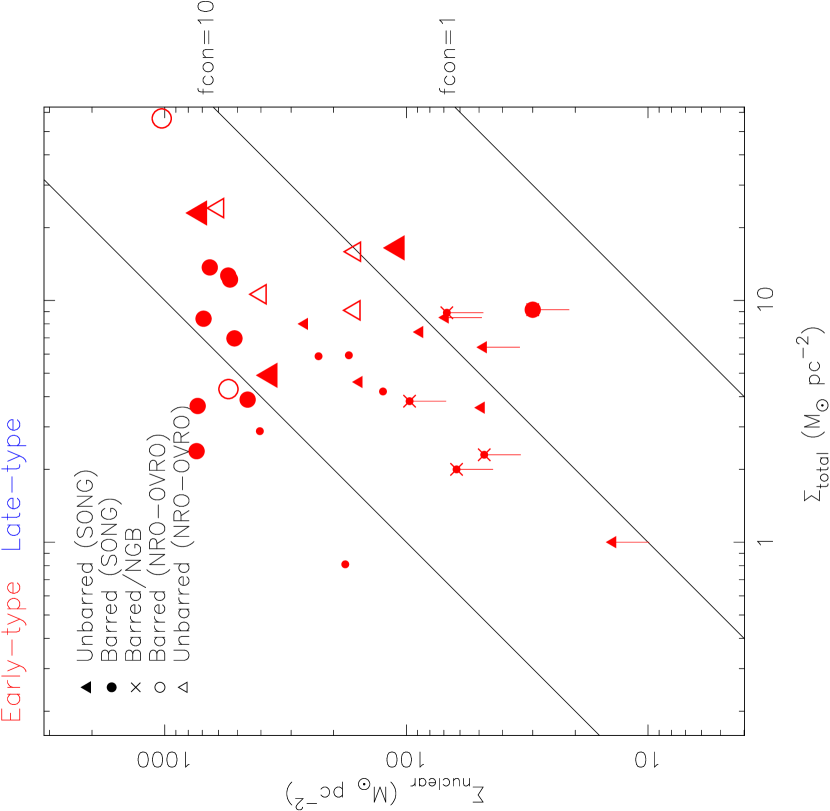
3.2.2 Bar Gas Transport as a Function of Hubble Type
First we consider early Hubble type barred spirals, which we take to be Hubble types Sbc and earlier. There are 26 early type galaxies in SONG, plus six from the Sakamoto sample; these are shown in Figure 4. For galaxies above the median fcon for early type galaxies, 13 of 16 are barred, compared with only seven of 16 below the median. The median fcon for the early type bars is 43, compared with 14 for the unbarred early types. Clearly, the evidence for bar driven inflow in early type galaxies is very strong.
Next we consider the 16 late type spirals, shown in Figure 5. For galaxies above the median fcon, seven of eight are barred spirals, whereas for galaxies below the median, only three of eight are barred. The median fcon for late type bars is 20, three times higher than that for unbarred late type galaxies. Thus there is also good evidence for inflow in late type bars. We conclude that bars transport gas inwards regardless of Hubble type.
Although both early type and late type bars have fcon values about three times higher than their unbarred counterparts, note that the median fcon for early type barred galaxies is about twice that for late type bars. Also, the median (pc-2) for barred early types is 400, compared to 87 for late type bars. In part, the higher fcon and for early types can be understood as a consequence of the higher critical surface density threshold for star formation in early types resulting from their steeper rotation curves. This is probably the reason why even amongst the unbarred spirals in our sample, the early type galaxies have about a three times higher median fcon and compared to that for the late types; however this comparison should be viewed with caution because of the small number of unbarred galaxies.
Ho et al (1997b) attributed the higher star formation rates in early type bars to the higher critical density threshold, and predicted the higher gas surface densities that we indeed find. However, for early type bars to maintain these higher central mass concentrations requires that the early type bars have significantly higher mass inflow rates than late type bars. This is because the gas consumption rate implied by the star formation rates observed by Ho et al are higher in early types — the median values of the star formation rate are 0.08 compared to 0.007 yr-1 in barred early types to barred late types, respectively. That is, not only are the median surface densities and nuclear masses a factor of four higher in early type bars, but the gas is consumed at a typical rate more than ten times higher. Clearly, the mass inflow rates in early types must be much higher than for late type bars.
How can we explain this difference? We believe the reason is related to the different type of bars that are typically found in early and late Hubble type galaxies: “flat” and “exponential” (Elmegreen & Elmegreen, 1985, 1996; Ohta et al., 1986; Combes & Elmegreen, 1993). Flat bars, found primarily in early type galaxies, have a rectangular appearance with flat shoulders in their photometric profile, are usually associated with grand-design spiral structure, and lie in the flat part of the rotation curve. They are also longer relative to their disks and have higher amplitudes. Exponential bars, on the other hand, are located in the rising part of a rotation curve, and are oval, rather than rectangular, in appearance. Their photometric profile is exponential, similar to a galactic disk. They are shorter relative to their disks than flat bars, and have a lower amplitude. Exponential bars are primarily found in late Hubble type spirals.
Bars in early type galaxies, i.e., flat bars, are predicted to be more effective at driving gas inwards because longer bars encounter more gas in the disk, and because the higher non-axisymmetry leads to a higher inflow rate. N-body (Combes & Elmegreen, 1993) and hydrodynamic models (Regan & Teuben, 2004) predict that weaker bars (fatter bars and/or less massive bars) drive significantly less mass inward. The evidence presented here thus supports the predictions of higher inflow rates in early type barred spirals.
Another possibility is that the higher CO fluxes in the nuclei of early type galaxies may reflect a change in the CO emissivity due to higher pressures and velocity dispersions in the bulge region (see discussion in Regan et al. 2001). The increased star formation in the nuclei of early type spirals may also contribute to an increase in the pressure. But if there is indeed less gas at the centers of early types, then the enhanced star formation implies a higher efficiency and decreased gas consumption times. Then the presence of a large fraction of early type bars with high central concentration of CO emission is surprising. A quantitative discussion of this awaits better extinction-corrected star formation rates.
3.3 Secular Evolution From Late to Early Type Galaxies?
Several studies have suggested that galaxies undergo secular evolution via bar-driven inflows. One popular evolutionary scenario is the change of late type galaxies into early types via bar inflows (Friedli & Benz, 1995; Zhang, 1999). We argue that such a transformation is unlikely. In order for a late type galaxy to build an early-type bulge, it would need to add 1010 to 1011 of gas that must then be converted to stars (Binney & Merrifield, 1998). If we take the best case scenario for such a transformation, i.e. a) assume that bars are long-lived (10 Gyr), b) transport gas inwards at sufficiently high rates, c) have an adequate supply of molecular gas, d) convert enough of the accumulated gas to stars, and e) scatter the stars in the vertical dimension to build a bulge, then a late type galaxy can build an early type bulge. Some of these conditions are difficult, if not impossible to reconcile with observational data.
While the high bar fraction at z 0.7 (Sheth et al., 2003) suggests that bars are likely to be long-lived, it is unlikely that the mass inflow rates or the gas reservoir in late Hubble type galaxies are sufficient to build an early type bulge. Based on the differences in fcon values, we noted that the mass inflow rate in late Hubble type galaxies is lower than in early Hubble types. The inflow rate in the NRO-OVRO sample was estimated by Sakamoto et al. (1999b) to be 0.1-1 yr-1. In later type galaxies the rate would be even lower. We note that at the median nuclear star formation rate for late type bars measured by Ho et al. (1997b) data (0.007 yr-1) it would take yr to build even a bulge. At the upper end of gas consumption rates for late type bars (1 yr-1), it would be possible to build a small bulge in yr; however, the data demonstrate that this is certainly not typical.
Moreover, late type bars are small and do not have access to a vast molecular gas reservoir. In SONG, the average length of a late type bars is 3 kpc (the average length of bars in the entire sample is 5 kpc, Sheth 2001). To measure the available gas reservoir, let us assume this length and the average for SONG (8 pc-2). Then the available gas reservoir for a typical late type spiral is only 5 107 . This value may be higher because the average is a measurement over the entire disk. In the bar region, the available gas reservoir may be higher. But even if we assume a that is ten times higher, i.e., 80 pc-2 the gas reservoir would still be too small. It is possible that accretion from mergers or gas transport from outer parts of the galactic disk may increase this number but it is at least two orders of magnitude lower than that required for creating an early-type bulge in a late type galaxy. Thus we believe that it is unlikely that a late type galaxy evolves into an early types, consistent with Kormendy & Kennicutt (2004).
This, however, does not imply that there is no secular evolution in barred spiral galaxies. To the contrary, the evidence presented here for bar-driven gas inflows, combined with the enhanced star formation activity in barred spirals, indicates that the central regions of barred galaxies undergo significant changes. They are probably the most important changes in the evolution of disks since z1 when the merging activity began to decline (Baugh, Cole & Frenk, 1996; Ferguson, Dickinson, & Williams, 2000). Another possible secular evolutionary sequence could be the dissolution of bars by an increasing central concentration of mass. Models have debated the exact impact of increasing central concentration (e.g., Friedli & Benz 1993; Norman, Sellwood, & Hasan 1996; Bournaud & Combes 2002; Athanassoula 2003; Shen & Sellwood 2004). Tentative evidence for such dissolution was presented in Das et al. (2003) who showed a correlation between the bar ellipticity and the central mass concentration.
The data presented here lend credence to the formation of pseudo-bulges in barred spirals; pseudo-bulges and secular evolution via gas inflows has recently been reviewed by Kormendy & Kennicutt (2004). In this context, we particularly point out the significant population of early-type barred spirals (6 of 19) that have no molecular gas detected in nuclear region, and very little detected in the region within the bar co-rotation radius. This suggests that the gas inside the bar co-rotation radius has already been driven into the nuclear region, where it has been consumed by star formation. Amongst the late type spirals, there are three barred galaxies with upper limits to the molecular gas in the central kiloparsec. One of them has no gas within the bar co-rotation radius. As already discussed, the process of gas accretion is slower in late types. The star formation rates in late types are also lower because late type spirals have lower , the critical gas surface densities for star formation (e.g., Toomre 1964; Kennicutt 1989). So it is not unusual to find fewer examples of late type barred spirals with no gas in the center and bar regions. The secular evolutionary sequence of gas inflow and subsequent star formation simply occurs at a slower pace in these galaxies; over time, even the late type spirals will build pseudo-bulges. Signatures of post-starburst populations in barred spirals with low Mnuc and little gas in the bar region would provide further confirmation of this evolutionary sequence.
Another way to interpret the galaxies without gas in the center is that a third of the barred galaxies, whether they are early-type or late-type, are in a quiescent state, i.e. without measurable gas in the center or the bar region. This indicates that if the fueling via bars is periodic, then bars are “actively” fueling the center two-thirds of the time. When better measurements of gas inflow are obtained, this duty cycle will need to be taken into account to measure the impact of the gas inflow over the lifetime of the bar and galaxy.
4 Conclusions
With a larger and more representative sample of nearby galaxies from SONG, we compared the central concentration of molecular gas in both CO-bright and CO-faint spiral galaxies spanning a range of Hubble types. In all cases we found clear evidence of more centrally concentrated molecular gas distributions in barred spirals. This is the strongest and most conclusive evidence for the bar-driven transport of molecular gas to the central kiloparsec of galaxies.
We find that late Hubble types barred spirals are less centrally concentrated than early Hubble types. This, coupled with the enhanced star formation activity observed in early type bars, indicates higher mass accretion rates in early Hubble type spirals. The differences are probably related to the longer and stronger “flat” bars that are found preferentially in early Hubble type galaxies. The observation of a significant subset of early type barred spirals with little or no gas within the bar region is consistent with higher accretion rates; these galaxies have the expected conditions of a post-starburst galaxy, where the large stockpiles of gas driven inward by the bar have already been converted into stars.
Contrary to previous suggestions, the evidence indicates that it is highly unlikely for a late type galaxy to evolve into an early type via bar-induced gas inflow. Nonetheless, secular evolutionary processes are undoubtedly present, and pseudo-bulges are inevitable because of the bar-induced gas inflow. Evidence for pseudo-bulges is likely to be clearest in early type galaxies because of their higher inflow rates and higher star formation activity.


| Galaxy | (J2000)raa2MASS Galaxy Centers from the LGA (Jarett et al. 2003) | (J2000)raa2MASS Galaxy Centers from the LGA (Jarett et al. 2003) | DccOptical diameter (RC3)25 | PAddPosition angle (RC3) | eeInclination (RC3) | VffHeliocentric velocity (NED)Hel | DggAdopted distance, k:Sohn & Davidge (1998); l:Karachentsev & Tikhonov (1993); m:Metcalfe & Shanks (1991); n:Planesas, Colina & Perez-Olea (1997); o:Pompei & Natali (1997); p:Corbelli, Schneider & Salpeter (1989); q:Graham et al. (1997); r:Tanvir, Ferguson & Shanks (1999); s:Thornley (1996); t:Saha et al. (1999); u:van der Kruit (1971); v:RC3, using Ho=75; w:Gottesman & Hunter (1982); x:Liszt & Dickey (1995); y:Herrnstein et al. (1997); z:Molla, Hardy & Beauchamp (1999); aa:Ferrarese et al. (1996); ab:Tully (1988); ac:Macri et al. (1999); ad:Graham et al. (1999); ae:Vogler, Pietsch & Bertoldi (1996); af:Barth et al. (1998); ag:Ho (1999a); ah:Bower et al. (1993); ai:Gibson et al. (1999); aj:Barth et al. (1998); ak:Tully (1988); al:Stetson et al. (1998); am:Sharina, Karachentsev & Tikhonov (1997); an:Sharina, Karachentsev & Tikhonov (1996); ao:lit. values vary from 14-22 Mpc, assumed 18 Mpc as mid-point value; ap:Block et al. (1999); aq:Karachentsev et al. (1991); ar:Paturel et al. (1998); as:Jiminez-Vicente et al. (1999); at:Turner et al. (1998); au:Tully (1988); av:Mulder & Driel (1993); aw:Rubin (1994); ax:Ho et al. (1999b); ay:Tully (1988); az:Feldmeir, Ciardullo & Jacoby (1997); bb:Grosbol & Patsis (1998); bc:Hughes et al. (1998) | Type | OTFiiIndicates whether On-The-Fly data was collected as part of SONG. |
|---|---|---|---|---|---|---|---|---|---|
| (h m s) | (∘ ) | () | () | () | (km s-1) | (Mpc) | (RC3) | Data | |
| Barred | |||||||||
| NGC 0925 | 02 27 16.9 | +33 34 44.0 | 10.5 | 102 | 55.8 | 553 | 9.3k | SAB(s)d | … |
| IC 342j | 03 46 48.5 | +68 05 46.0 | 21.4 | 37zz | 31.0zz | 34 | 2.1l | SAB(rs)cd | Y |
| NGC 2403 | 07 36 51.3 | +65 36 09.2 | 21.9 | 127 | 55.8 | 131 | 2.9m | SAB(s)cd | … |
| NGC 2903j | 07 36 51.3 | +65 36 09.2 | 12.6 | 17 | 61.4 | 556 | 7.3n | SAB(rs)bc | Y |
| NGC 3184 | 10 18 16.9 | +41 25 27.8 | 7.4 | 135 | 21.1 | 592 | 8.7o | SAB(rs)cd | … |
| NGC 3344 | 10 43 31.1 | +24 55 20.0 | 7.1 | 24 | 25.5 | 586 | 12.5p | (R)SAB(r)bc | … |
| NGC 3351 | 10 43 57.7 | +11 42 13.0 | 7.4 | 13 | 47.8 | 778 | 10.1q | SB(r)b | Y |
| NGC 3368j | 10 46 45.7 | +11 49 11.8 | 7.6 | 5 | 46.2 | 897 | 11.2r | SAB(rs)ab | … |
| NGC 3521 | 11 05 48.5 | -00 02 09.2 | 11 | 163 | 62.1 | 805 | 7.2s | SAB(rs)bc | Y |
| NGC 3627 | 11 20 15.0 | +12 59 28.6 | 9.1 | 173 | 62.8 | 727 | 11.1t | SAB(s)b | Y |
| NGC 3726 | 11 33 21.1 | +47 01 44.7 | 6.2 | 10 | 46.2 | 849 | 11.7u | SAB(r)c | … |
| NGC 3953 | 11 53 49.0 | +52 19 35.6 | 6.9 | 13 | 59.9 | 1054 | 14.1v | SB(r)bc | … |
| NGC 3992 | 11 57 35.9 | +53 22 28.3 | 7.6 | 68 | 51.9 | 1048 | 14.2w | SB(rs)bc | … |
| NGC 4051 | 12 03 09.6 | +44 31 52.5 | 5.3 | 135 | 42.2 | 725 | 9.4x | SAB(rs)bc | … |
| NGC 4258 | 12 18 57.6 | +47 18 13.4 | 18.6 | 150 | 67.1 | 448 | 7.3y | SAB(s)bc | Y |
| NGC 4303 | 12 21 54.9 | +04 28 24.9 | 6.5 | 7 | 27 | 1566 | 15.2z | SAB(rs)bc | Y |
| NGC 4321j | 12 22 54.8 | +15 49 20.6 | 7.4 | 30 | 31.7 | 1571 | 16.1aa | SAB(s)bc | Y |
| NGC 4490 | 12 30 36.3 | +41 38 37.1 | 6.3 | 125 | 60.7 | 565 | 7.7ab | SB(s)d-pec | … |
| NGC 4535 | 12 34 20.3 | +08 11 51.9 | 7.1 | 0 | 44.9 | 1961 | 16.0ac | SAB(s)c | … |
| NGC 4548 | 12 35 26.4 | +14 29 46.8 | 5.4 | 150 | 37.4 | 486 | 15.9ad | SB(rs)b | … |
| NGC 4559 | 12 35 57.6 | +27 57 35.1 | 10.7 | 150 | 66 | 815 | 9.7ae | SAB(rs)cd | … |
| NGC 4569j | 12 36 49.8 | +13 09 46.3 | 9.6 | 23 | 62.8 | -235 | 16.8af | SAB(rs)ab | Y |
| NGC 4579 | 12 37 43.5 | +11 49 05.1 | 5.9 | 95 | 37.4 | 1519 | 16.8ag | SAB(rs)b | … |
| NGC 4699 | 12 49 02.18 | -08 39 51.4 | 3.8 | 45 | 46.2 | 1427 | 19.0ah | SAB(rs)b | … |
| NGC 4725 | 12 50 26.6 | +25 30 02.7 | 10.7 | 35 | 44.9 | 1206 | 12.6ai | SAB(r)ab-pec | … |
| NGC 5005j | 12 50 26.6 | +25 30 02.7 | 5.8 | 65 | 61.4 | 946 | 21.3aj | SAB(rs)bc | Y |
| NGC 5248j | 13 37 32.0 | +08 53 06.2 | 6.2 | 110 | 43.6 | 1153 | 22.7ak | SAB(rs)bc | Y |
| NGC 5457 | 14 03 12.5 | +54 20 55.5 | 28.8 | 35 | 21.1 | 241 | 6.5al | SAB(rs)cd | Y |
| NGC 6946j | 20 34 52.3 | +60 09 13.2 | 11.5 | 35 | 31.7 | 48 | 6.4am | SAB(rs)cd | Y |
| Unbarred | |||||||||
| NGC 0628 | 01 36 41.7 | +15 47 00.5 | 10.5 | 25 | 24.2 | 657 | 7.3an | SA(s)c | Y |
| NGC 1068 | 02 42 40.7 | -00 00 47.8 | 7.1 | 70 | 31.7 | 1136 | 18.0ao | (R)SA(rs)b | Y |
| NGC 2841 | 09 22 02.6 | +50 58 35.3 | 8.1 | 147 | 64.1 | 638 | 9.5ap | SA(r)b | … |
| NGC 2976 | 09 47 15.4 | +67 54 59.0 | 5.9 | 143 | 62.8 | 3 | 4.3aq | SAc-pec | … |
| NGC 3031 | 09 55 33.1 | +69 03 54.9 | 26.9 | 157 | 58.4 | -34 | 3.3ar | SA(s)ab | … |
| NGC 3938 | 11 52 49.4 | +44 07 14.6 | 5.4 | 20 | 14 | 809 | 11.3as | SA(s)c | Y |
| NGC 4414j | 12 26 27.08 | +31 13 24.7 | 3.6 | 155 | 55.8 | 716 | 19.1at | SA(rs)c? | Y |
| NGC 4450 | 12 28 29.6 | +17 05 05.8 | 5.3 | 175 | 42.2 | 1954 | 16.0au | SA(s)ab | … |
| NGC 4736j | 12 50 53.1 | +41 07 12.5 | 11.2 | 105 | 35.6 | 308 | 6.6av | (R)SA(r)ab | Y |
| NGC 4826j | 12 56 43.6 | +21 40 57.6 | 10 | 115 | 57.5 | 408 | 5.0aw | (R)SA(rs)ab | Y |
| NGC 5033 | 13 13 27.5 | +36 35 37.1 | 10.7 | 170 | 62.1 | 875 | 21.3ax | SA(s)c | Y |
| NGC 5055j | 13 15 49.3 | +42 01 45.4 | 12.6 | 105 | 54.9 | 504 | 7.2ay | SA(rs)bc | Y |
| NGC 5194j | 13 29 52.6 | +47 11 42.9 | 11.2 | 163 | 51.9 | 463 | 8.4az | SA(s)bc-pec | Y |
| NGC 5247 | 13 38 03.0 | -17 53 02.5 | 5.6 | 20 | 29.4 | 1357 | 15.2bb | SA(s)bc | Y |
| NGC 7331 | 22 37 04.0 | +34 24 57.3 | 10.5 | 171 | 69.2 | 821 | 15.1bc | SA(s)b | Y |
| Galaxy | SaaCO flux in central kiloparsec measured from BIMA SONG | SaaCO flux in central kiloparsec measured from BIMA SONG | Rms | MnucbbTotal gas mass in the central kiloparsec calculated from the SONG flux. All masses are calculated using M = 1.36 M(H2), M(H2)=1.1104 D2 SCO where D is in Mpc and SCO is in Jy km s-1. We use a CO-to-H2 coversion factor of 2.81020 cm-2 (K km s-1))-1, 7% smaller than Sakamoto et al. (1999b). | ccNuclear gas surface density derived by dividing the mass by (500 pc)2. | SddTotal CO flux from galaxy (disk+nucleus) from the FCRAO survey (Young et al., 1995) | MtoteeTotal gas mass in the galaxy (disk + nucleus) calculated from the FCRAO flux | ffTotal gas surface density in the galaxy (disk + nucleus) calculated from the FCRAO flux | ggRatio of the nuclear gas surface density to the disk gas surface density, defined as fcon in §1 |
|---|---|---|---|---|---|---|---|---|---|
| COMB | BIMA | in BIMA | |||||||
| (Jy km s-1) | (Jy km s-1) | (Jy km s-1) | (107) | ( pc-2) | (Jy km s-1) | (108) | ( pc-2) | ||
| Early Types | |||||||||
| NGC 2903 | 462 | 447 | 13 | 35.6 | 454 | 2740 | 22.0 | 3.89 | 117 |
| NGC 3344u | … | 2 | 8 | 3.70u | 47.6u | 520 | 12.0 | 2.30 | 20.7u |
| NGC 3351 | 207 | 208 | 9 | 31.7 | 404 | 700 | 10.7 | 2.88 | 140 |
| NGC 3368 | … | 309 | 11 | 58.0 | 738 | 610 | 11.5 | 2.38 | 310 |
| NGC 3521u | 53 | 4 | 15 | 2.30u | 30.0u | 4920 | 38.2 | 9.15 | 3.28u |
| NGC 3627 | 244 | 233 | 7 | 43.0 | 546 | 4660 | 85.8 | 12.7 | 43.1 |
| NGC 3953u | … | 7 | 9 | 5.40u | 68.0u | 1790 | 53.2 | 8.90 | 8.04u |
| NGC 3992u | … | 6 | 8 | 4.80u | 62.0u | … | 7.00s | 2.00s | 31.0s |
| NGC 4051 | … | 103 | 3 | 13.6 | 173 | 740 | 9.80 | 5.93 | 29.2 |
| NGC 4258 | 180 | 176 | 13 | 14.0 | 179 | 1240 | 9.90 | 0.81 | 221 |
| NGC 4303 | 135 | 122 | 4 | 42.0 | 537 | 2280 | 78.8 | 12.2 | 44.0 |
| NGC 4321 | 140 | 132 | 5 | 51.0 | 651 | 3340 | 129 | 13.7 | 47.5 |
| NGC 4548 | … | 26 | 5 | 9.80 | 125 | 540 | 20.4 | 4.20 | 29.8 |
| NGC 4569 | 141 | 136 | 5 | 57.0 | 731 | 1500 | 63.0 | 3.66 | 200 |
| NGC 4579 | … | 43 | 8 | 18.2 | 231 | 910 | 38.0 | 5.88 | 39.3 |
| NGC 4699u | … | 3 | 6 | 6.50u | 83.0u | … | … | … | … |
| NGC 4725u | … | 15 | 16 | 7.60u | 97.0u | 1950 | 46.0 | 3.83 | 25.3u |
| NGC 5005 | … | 80 | 2 | 54.0 | 691 | 1260 | 85.0 | 8.40 | 82.3 |
| NGC 5248 | 57 | 54 | 2 | 42.0 | 515 | 1190 | 92.0 | 6.97 | 76.0 |
| Late Types | |||||||||
| IC 342 | 2379 | 1713 | 75 | 11.3 | 144 | 29220 | 19.0 | 14.4 | 10.0 |
| NGC 0925u | … | 6 | 10 | 2.60u | 33.0u | 960 | 12.0 | 1.96 | 16.8u |
| NGC 2403u | … | 15 | 19 | 0.50u | 6.10u | 540 | 0.70 | 0.25 | 24.4u |
| NGC 3184 | … | 60 | 7 | 6.80 | 87.0 | 1120 | 13.0 | 4.60 | 18.9 |
| NGC 3726 | … | 33 | 3 | 6.80 | 86.0 | 720 | 14.7 | 4.22 | 20.4 |
| NGC 4490u | … | 0 | 3 | 0.50u | 6.80u | 480 | 4.00 | 2.70 | 2.52u |
| NGC 4535 | … | 110 | 5 | 42.0 | 536 | 1570 | 60.0 | 7.00 | 76.6 |
| NGC 4559 | … | 21 | 9 | 2.96 | 38.0 | … | 4.00s | 0.50s | 76.0s |
| NGC 5457 | 123 | 116 | 7 | 7.30 | 93.0 | … | 14.9s | 4.90s | 19.0 |
| NGC 6946 | 1691 | 1747 | 15 | 107 | 1363 | 12370 | 76.0 | 21.1 | 64.7 |
| Galaxy | SaaCO flux in central kiloparsec measured from BIMA SONG | SaaCO flux in central kiloparsec measured from BIMA SONG | Rms | MnucbbTotal gas mass in the central kiloparsec calculated from the SONG flux. All masses are calculated using M = 1.36 M(H2), M(H2)=1.1104 D2 SCO where D is in Mpc and SCO is in Jy km s-1. We use a CO-to-H2 coversion factor of 2.81020 cm-2 (K km s-1))-1, 7% smaller than Sakamoto et al. (1999b). | ccNuclear gas surface density derived by dividing the mass by (500 pc)2. | SddTotal CO flux from galaxy (disk+nucleus) from the FCRAO survey (Young et al., 1995) | MtoteeTotal gas mass in the galaxy (disk + nucleus) calculated from the FCRAO flux | ffTotal gas surface density in the galaxy (disk + nucleus) calculated from the FCRAO flux | ggRatio of the nuclear gas surface density to the disk gas surface density, defined as fcon in §1 |
|---|---|---|---|---|---|---|---|---|---|
| COMB | BIMA | in BIMA | |||||||
| (Jy km s-1) | (107) | ( pc-2) | (Jy km s-1) | (108) | ( pc-2) | ||||
| Early Types | |||||||||
| NGC 1068 | 120 | 116 | 9 | 56.0 | 716 | 5160 | 250 | 23.0 | 31.1 |
| NGC 2841u | … | -11 | 14 | 3.80u | 48.0u | 1870 | 25.0 | 6.40 | 7.50u |
| NGC 3031 | … | 37 | 34 | 1.10u | 14.0u | … | 10.0s | 1.00s | 14.0s |
| NGC 4450 | … | 12 | 5 | 3.80 | 49.0 | 450 | 17.0 | 3.60 | 13.6 |
| NGC 4736 | 239 | 190 | 15 | 12.4 | 157 | 2560 | 17.0 | 4.60 | 34.1 |
| NGC 4826 | 760 | 769 | 24 | 28.8 | 366 | 2170 | 8.10 | 4.90 | 74.7 |
| NGC 5055 | 302 | 267 | 13 | 20.7 | 264 | 5670 | 44.0 | 8.00 | 33.0 |
| NGC 5194 | 103 | 81 | 11 | 8.55 | 109 | 9210 | 97.0 | 16.5 | 6.61 |
| NGC 5247 | 29 | 20 | 3 | 6.90 | 88.0 | 1030 | 36.0 | 7.40 | 11.9 |
| NGC 7331u | 4 | -3 | 8 | 5.50u | 69.0u | 4160 | 142 | 8.50 | 8.12u |
| Late Types | |||||||||
| NGC 0628 | 41 | 26 | 8 | 2.10 | 26.0 | 2160 | 17.0 | 4.40 | 5.91 |
| NGC 2976 | … | 21 | 5 | 0.58 | 7.40 | 610 | 1.70 | 3.90 | 1.90 |
| NGC 3938 | 38 | 30 | 6 | 5.70 | 73.0 | 1750 | 33.0 | 13.5 | 5.41 |
| NGC 4414 | 10 | 4 | 2 | 2.20 | 28.0 | 2740 | 150 | 47.0 | 0.60 |
| NGC 5033 | 35 | 34 | 6 | 23.0 | 294 | 1640 | 111 | 3.20 | 91.9 |
References
- (1)
- Allen (1973) Allen, C. W. 1973, Astrophysical Quantities (3d ed.; London: Athlone)
- Athanassoula (1992a) Athanassoula, E. 1992a, MNRAS, 259, 328
- Athanassoula (1992b) Athanassoula, E. 1992b, MNRAS, 259, 345
- Athanassoula (2003) Athanassoula, E. 2003, MNRAS, 341, 1179
- Barth et al. (1998) Barth, A. J., Ho, L. C., Filippenko, A. V., Sargent, W. L. W. 1998, ApJ, 496, 133
- Baugh, Cole & Frenk (1996) Baugh, C. M., Cole, S., Frenk, C. S. 1996, MNRAS, 282, L27
- Binney & Merrifield (1998) Binney, J., & Merrifield, M. 1998, Galactic astronomy / James Binney and Michael Merrifield. Princeton, NJ : Princeton University Press, 1998, Chapter 4, specifically §4.1, 4.4
- Block et al. (1999) Block et al. 1999, ApJ522, L25
- Bloemen et al. (1986) Bloemen, J. B. G. M., et al. 1986, A&A, 154, 25
- Bournaud & Combes (2002) Bournaud, F., & Combes, F. 2002, A&A, 392, 83
- Bower et al. (1993) Bower, G. A., Richstone, D. O., Bothun, G. D., Heckman, T. M. 1993, ApJ, 402, 76
- Combes & Elmegreen (1993) Combes, F., & Elmegreen, B.G. 1993, A&A, 271, 391
- Corbelli, Schneider & Salpeter (1989) Corbelli, E., Schneider, S. E., Salpeter, E. E., 1989, AJ, 97, 390
- Crothwaite, Turner & Ho (2000) Crothwaite, L., Turner, J.L. & Ho, P. T. P. 2000, AJ, 119, 1720
- Das et al. (2003) Das, M., Vogel, S. N., Teuben, P. J., Regan, M. W., Sheth, K. , Harris, A. I., Jeffreys, W. H., 2003, ApJ, 582, 190
- de Vaucouleurs et al. (1991) de Vaucouleurs, G., de Vaucouleurs, A., Corwin, H. G., Jr., Buta, R. J., Paturel, G., & Fouque, P. 1991, Third Reference Catalogue of Bright Galaxies, (New York:Springer-Verlag)
- Downes et al. (1996) Downes, D., Reynaud, D., Solomon, P. M., & Radford, S. J. E. 1996, ApJ, 461, 186
- Elmegreen & Elmegreen (2004) Elmegreen, B. G., Elmegreen, D.M. & Hirst, A.C. 2004, ApJ, 612, 191
- Elmegreen & Elmegreen (1985) Elmegreen, B. G., & Elmegreen, D.M. 1985, ApJ, 288, 438
- Elmegreen & Elmegreen (1996) Elmegreen, D.M., & Elmegreen, B.G. 1996, IAU Colloquium 157, Barred Galaxies, (San Francisco:ASP)
- Eskridge et al. (2000) Eskridge, P., et al. 2000, AJ, 119, 536
- Feldmeir, Ciardullo & Jacoby (1997) Feldmeier, J. J., Ciardullo, R., Jacoby, G. H., 1997, ApJ, 479, 231
- Ferguson, Dickinson, & Williams (2000) Ferguson, H. C., Dickinson, M., & Williams, R. 2000, ARA&A, 38, 667
- Ferrarese et al. (1996) Ferrarese, L., et al. 1996,ApJ, 468, L95
- Friedli & Benz (1993) Friedli, D. & Benz, W. 1993, A&A, 268, 65
- Friedli & Benz (1995) Friedli, D. & Benz, W. 1995, A&A, 301, 649
- Gibson et al. (1999) Gibson, B. K. et al. 1999, ApJ, 512, 48
- Graham et al. (1997) Graham et al., 1997, ApJ, 477, 535
- Graham et al. (1999) Graham et. al. 1999, ApJ, 516, 626
- Grosbol & Patsis (1998) Grosbol, P. J., Patsis, P. A., 1998, A&A, 336, 840
- Gottesman & Hunter (1982) Gottesman, S. T., Hunter, J. H., Jr. 1982, ApJ, 260, 65
- Jarrett et al. (2003) Jarrett, T.H., Chester, T., Cutri, R., Schneider, S.E., & Huchra, J.P. 2003, AJ, 125, 525
- Hawarden et al. (1986) Hawarden, T. G., Mountain, C. M., Leggett, S. K., & Puxley, P. J. 1986, MNRAS, 221, 41
- Helfer et al. (2002) Helfer, T. T., Vogel, S. N., Lugten, J. B., & Teuben, P. J. 2002, PASP, 114, 350.
- Helfer et al. (2003) Helfer, T. T., Regan, M. W., Thornley, M. D., Sheth, K., Wong, T., Vogel, S. N., Bock, D. C.-J., & Blitz, L. 2003, ApJS, 145, 259
- Herrnstein et al. (1997) (Herrnstein, J., Moran, J., Greenhill, L., Inoue, M., Nakai, N., Miyoshi, M., & Diamond, P. 1997, BAAS, 191, 2507
- Ho, Filippenko, & Sargent (1997a) Ho, L. C., Filippenko, A. V., & Sargent, W. L. W. 1997a, ApJS, 112, 315
- Ho, Filippenko, & Sargent (1997) Ho, L. C., Filippenko, A. V., & Sargent, W. L. W. 1997b, ApJ, 487, 591
- Ho (1999a) Ho, L. C., 1999a, ApJ, 516, 672
- Ho et al. (1999b) Ho, L. C., Ptak, A., Terashima, Y., Kunieda, H., Serlemitsos, P. J., Yaqoob, T., Koratkar, A. P. 1999b, ApJ, 525, 168
- Huang et al. (1996) Huang, J. H., Gu, Q. S., Su, H. J., Hawarden, T. G., Liao, X. H., Wu, G. X. 1996, A&A, 313, 13
- Hughes et al. (1998) Hughes, S. M. G. et. al., 1998, ApJ, 501, 32
- Jiminez-Vicente et al. (1999) Jiminez-Vicente, J., Battaner, E., Rozas, M., Castaqeda, H., Porcel, C., 1999, A&A, 342,417
- Jogee et al. (2004a) Jogee, S. et al., 2004a, ApJ, 615, L105
- Jogee et al. (2004b) Jogee, S., Scoville, N. Z., & Kenney, J.D.P. 2004b, submitted ApJ, astro-ph/0402341
- Karachentsev et al. (1991) Karachentsev, I. D., Tikhonov, N. A., Sharina, M. E., Georgiev, Ts. B., Bilkina, B. I, 1991 A&AS, 91, 503
- Karachentsev & Tikhonov (1993) Karachentsev, I.D. & Tikhonov, N. A. B. 1993, Ap&SS, 100, 227
- Kenney (1996) Kenney, J. D. P. 1996a, in IAU Colloquium 157, Barred Galaxies, eds. R. Buta, D. A. Crocker, & B. G. Elmegreen, (San Fransisco:ASP), 150
- Kennicutt (1989) Kennicutt, R. C., 1989, ApJ, 344, 685
- Kennicutt (1998) Kennicutt, R. C., 1998, ARA&A, 36
- Knapen, Shlosman, & Peletier (2000) Knapen, J. H., Shlosman, I., & Peletier, R. F. 2000, ApJ, 529, 93
- Kormendy (1993) Kormendy, J. 1993, IAUS, 153, 209
- Kormendy & Kennicutt (2004) Kormendy, J. & Kennicutt, R.C. 2004, ARA&A, 42, 603
- Laine et al. (2002) Laine, S., Shlosman, I., Knapen, J. H., & Peletier, R. F. 2002, ApJ, 567, 97
- Laurikainen, Salo & Buta (2004) Laurikainen, E., Salo, H., & Buta, R. 2004, ApJ, 607, L103
- Liszt & Dickey (1995) Liszt, H. S., Dickey, J. M., 1995, AJ, 110, 998
- Macri et al. (1999) Macri et. al. 1999, ApJ, 521, 155
- Martin & Roy (1994) Martin, P., & Roy, J. 1994, ApJ, 424, 599
- Martinet & Friedli (1997) Martinet, L., & Friedli, D. 1997, A&A, 323, 363
- Meneńdez-Delmestre et al. (2004) Menendez-Delmestre, K., Sheth, K., Scoville, N.Z., Jarrett, T., Schinnerer, E., Regan, M.W., Block, D. 2004, in ”Penetrating Bars through Masks of Cosmic Dust: The Hubble Tuning Fork strikes a New Note”, ed. Block, Freeman, Puerari, Groess, and Block, Dordrecht: Kluwer, in press, astro-ph/0407323
- Metcalfe & Shanks (1991) Metcalfe, N. & Shanks, T. 1991, MNRAS, 250, 438
- Molla, Hardy & Beauchamp (1999) Molla, M., Hardy, E., Beauchamp, D., 1999, ApJ, 513, 695
- Mulder & Driel (1993) Mulder P. S., van Driel W., 1993, A&A, 272, 63
- Norman, Sellwood, & Hasan (1996) Norman, C. A., Sellwood, J. A., & Hasan, H. 1996, ApJ, 462, 114
- Ohta et al. (1986) Ohta, K., Sasaki, M., Saito, M. 1986, PASJ, 38, 677
- Paturel et al. (1998) Paturel, G., Lanoix, P., Teerikorpi, P., Theureau, G., Bottinelli, L., Gouguenheim, L., Renaud, N., Witasse, O., 1998, A&A, 339, 671
- Pfenniger & Norman (1990) Pfenniger, D. & Norman, C. 1990, ApJ, 363, 391
- Planesas, Colina & Perez-Olea (1997) Planesas, P., Colina, L., & Perez-Olea,D. 1997, A&A, 325, 81
- Pompei & Natali (1997) Pompei, E. & Natali, G. 1997, A&A, 124,129
- Regan, Vogel & Teuben (1997) Regan, M. W., Vogel, S.N., Teuben, P. J. 1997, ApJ, 482, L135
- Regan, Sheth & Vogel (1999) Regan, M. W., Sheth, K., & Vogel, S.N. 1999, ApJ, 526, 97
- Regan & Mulchaey (1999) Regan, M. W., & Mulchaey, J. 1999, AJ, 117, 2676
- Regan et al. (2001) Regan, M. W., Helfer, T. T., Thornley, M. D., Sheth, K., Wong, T., Vogel, S. N., Blitz, L., & Bock, D. C.-J. 2001, ApJ, 561, 218
- Regan & Teuben (2003) Regan, M. W. & Teuben, P. J. 2003, ApJ, 582, 723
- Regan & Teuben (2004) Regan, M. W. & Teuben, P. J. 2004, ApJ, 600, 595
- Rubin (1994) Rubin, V. C., 1994, AJ, 107, 173
- Sage (1993) Sage, L. 1993, A&A, 272, 123
- Saha et al. (1999) Saha, A., Sandage, A., Tammann, G. A., Labhardt, L., Macchetto, F. D., Panagia, N. 1999, ApJ, 522,802
- Sakamoto et al. (1999a) Sakamoto, K., Okumura, S. K., Ishizuki, S., Scoville, N. Z. 1999a, ApJS, 124,403
- Sakamoto et al. (1999b) Sakamoto, K., Okumura, S. K., Ishizuki, S., Scoville, N. Z. 1999b, ApJ, 525, 691
- Sault, Teuben & Wright (1995) Sault, R. J., Teuben, P. J., & Wright, M. C. H. 1995, Astronomical Data Analysis Software and Systems IV, ASP Conference Series, Volume #77, eds. R.A. Shaw, H.E. Payne, and J.J.E. Hayes, 4, 433
- Sellwood & Wilkinson (1993) Sellwood, J. A., & Wilkinson, A., 1993, Rep. Prog. Phys, 56, 173
- Sérsic & Pastoriza (1967) Sérsic, J. L. & Pastoriza, M. 1967, PASP, 79, 152
- Sharina, Karachentsev & Tikhonov (1997) Sharina, M. E., Karachentsev, I. D., & Tikhonov, N. A. 1997, Astronomy Letters, 23,373
- Sharina, Karachentsev & Tikhonov (1996) Sharina, M. E., Karachentsev, I. D., Tikhonov, N. A., 1996, A&AS, 119, 499
- Sheth et al. (2000) Sheth, K., Regan, M. W., Vogel, S. N., & Teuben, P. J. 2000 ApJ, 532, 221
-
Sheth (2001)
Sheth, K., 2001, Ph.D. Thesis,
University of Maryland,
http://www.astro.caltech.edu/kartik/thesis.html - Sheth et al. (2002) Sheth, K., Vogel, S. N., Regan, M. W., Teuben, P.J., Harris, A. I., & Thornley, M. D. 2002, AJ, 124, 2581
- Sheth et al. (2003) Sheth, K., Regan, M. W., Scoville, N.Z., & Strubbe, L.E. 2003, ApJ, 592, L13
- Shen & Sellwood (2004) Shen, J., & Sellwood, J.A. 2004, ApJ, 604, 614
- Shlosman, Frank, & Begelman (1989) Shlosman, I., Frank, J., & Begelman, M. C. 1989, Nature, 338, 45
- Sohn & Davidge (1998) Sohn, Y-J., Davidge, T. J. 1998, AJ, 115, 130
- Stetson et al. (1998) Stetson, P. B. et al. 1998, ApJ, 508, 491
- Tanvir, Ferguson & Shanks (1999) Tanvir, N. R., Ferguson, H. C., Shanks, T. 1999, MNRAS, 310, 175
- Thornley (1996) Thornley, M. D. 1996, ApJ, 469, L45
- Toomre (1964) Toomre, A. 1964, ApJ, 139, 1217
- Tully (1988) Tully, R. B. 1988, Nearby Galaxies Catalog (Cambridge: Cambridge Univ. Press)
- Turner (1996) Turner, J.L. 1996, in IAU Colloquium 157, Barred Galaxies, eds. R. Buta, D.A. Crocker, & B.G. Elmegreen, (San Fransisco:ASP), 146
- Turner et al. (1998) Turner et al., 1998, ApJ, 505, 207
- van der Kruit (1971) van der Kruit, P. C. 1971, A&A, 15,110
- Vila-Costas & Edmunds (1992) Vila-Costas, M. B. & Edmunds, M. G. 1992, MNRAS, 259, 121
- Vogler, Pietsch & Bertoldi (1996) Vogler, A., Pietsch, W., Bertoldi, F. 1996, Proc. ’Rvntgenstrahlung from the Universe’, eds. Zimmermann, H. U., Tr—mper, J., and Yorke, H., MPE Report 263, p. 399-400
- Welch et al. (1996) Welch, W. J. 1996, PASP, 108, 93
- Young & Scoville (1991) Young, J.S. & Scoville, N.Z. 1991, ARA&A, 29, 581
- Young et al. (1995) Young, J. et al. 1995, ApJS, 98, 219
- Zaritsky, Kennicutt, & Huchra (1994) Zaritsky, D., Kennicutt, R. C., Huchra, J. P. 1994, ApJ, 420, 87
- Zhang (1999) Zhang, X. 1999, ApJ, 518, 613