11email: rodrigo, gfl@physics.usyd.edu.au,
Interpreting microlensing signal in QSO 22370305:
Stars or planets?
The multiply imaged, gravitationally lensed quasar, QSO 22370305, has been the subject of recent optical monitoring campaigns, with its light curves displaying uncorrelated variability attributed to gravitational microlensing by masses in the foreground galaxy. Based on these light curves, it has been claimed that the dominant microlensing population must be a population of free-floating Jupiter-like objects; such a conclusion is not new, with several similar claims in the literature. Historically, however, it has been shown that such conclusions are flawed, with an incorrect interpretation of the complex caustic network that arises at significant optical depth. This paper examines this more recent claim, illustrating that it too is flawed.
Key Words.:
gravitational lensing – microlensing – dark halo populations1 Introduction
The gravitational lens system QSO 22370305 consists of a distant quasar, at , quadruply imaged by a nearby spiral galaxy, at (Huchra et al. 1985). Soon after its discovery, photometric monitoring of the individual images revealed that they possessed uncorrelated variability; this was interpreted as being due to gravitational microlensing by compact objects in the lensing galaxy (Irwin et al. 1989). This conclusion was confirmed with further monitoring of this system, revealing complex variability consistent with the quasar being swept with the high magnifications associated with caustics (Corrigan et al. 1991, Østensen et al. 1996, Vakulkik et al. 1997, Woźniak et al. 2000, Alcalde et al. 2002, Schmidt et al. 2002). Two recent campaigns have provided exquisite light curves for the four images in this system; OGLE (Woźniak et al. 2000) consists of low temporal sampling over a long time frame, while GLITP (Alcalde et al. 2002) was a short, targeted campaign, undertake at high temporal sampling.
The datasets from OGLE and GLITP have been used extensively to probe the physical properties of both the quasar emission region and the distribution of microlensing masses in the foreground galaxy. Wyithe et al. (2000a) used the OGLE (and other extant datasets) to place a limit on the size of the quasar emission region, finding it to be smaller than (99% confidence level). Here, is the Einstein radius in the source plane, the natural scale length for microlensing (e.g., Schneider et al. 1992); this depends upon the square root of the microlensing masses, and for a Solar mass star in QSO 2237+0305 this corresponds to cm. For a sub-Jupiter mass microlensing (M⊙) acting as a microlenses, this implies a source emission radius of cm. In a subsequent paper, these authors ruled out explicitly and unambiguously a significant contribution of such (sub-)Jupiter-mass microlenses (Wyithe et al 2000b), while Wyithe et al. (2000c) also put limited the transverse velocity of the lensing galaxy with an upper limit km/s in the lens plane (which corresponds approximately to km/s in the source plane), analyzing statistically the properties of the derivatives of the amplitude variations in the light curves of the system. Furthermore, Shalyapin et al. (2002) and Goicoechea et al. (2003) analyzed the light curves obtained during the GLITP observational campaign, utilizing both V and R bands to obtained a physical source size of cm (0.012 pc) at confidence level. Moreover, they fitted a standard Newtonian accretion disk for the source (Shakura & Sunyaev 1973), amongst others, to obtain a mass for the central massive black hole of .
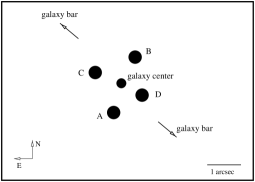
In a recent contribution, Lee et al. (2005) also used the results of the OGLE and GLITP monitoring campaigns to determine the physical properties in QSO 22370305. Their study presents a new method for fitting the variability observed in a microlensing light curve, exactly determining the locations of the microlensing masses and the emission profile of the source, finding that only a source model with a black hole can reproduce the features seen in one of the components (namely A, see Fig. 1). In addition, they found that the masses of the microlenses in the lensing galaxy must be of the order of , and the continuum source size of the quasar should be cm.
Clearly, the physical quantities obtained by Lee et al. (2005) are in evident disagreement with these previous studies of microlensing in QSO 2237+0305. In this contribution, the approach adopted by Lee et al. (2005) is critically examined and it is shown that the modeling technique is based upon flawed assumptions and hence their conclusions cannot be accepted.
2 Discussion
Microlensing at low optical depths, where lensing objects are well separated (except for cases of binary stars, etc.) can be simply analyzed; an example of this is microlensing within the Galactic halo where detailed parameters for lensing masses and separations, as well as source profiles, can be determined from well sampled light curves (Paczynski 1986a). Once the density of stars, and hence the microlensing optical depth, increases, such a simple approach is not possible as the combination of the gravitational lensing by many bodies results in complex magnification patterns and clustered caustics (Paczynski 1986b). A semi-analytical formulation is still possible for point sources (Lewis et al. 1993; Witt 1993), but in the case of extended sources, such a situation rapidly becomes analytically intractable and numerical approaches are required. The workhorse for studying gravitational lensing in the high optical depth regime has been the inverse ray-tracing method (Kayser et al. 1986, Wambsganss et al. 1990). The synthetic light curves derived from these simulations depend upon several parameters: the mass of the microlenses, the distribution of matter in the lens plane (this is modeled by a surface mass density and the shear obtained fitting the observable parameters of the system to a lens model), the adopted emission profile for the source and the resulting effective transverse velocity due to the joint motion of source, lens, microlenses and observer. Even when representing a combination of these parameters, an extraordinary range of potential light curves are possible due to the different random configurations of the microlensing masses. A dominant factor, however, is the relative size of the source emission region compared to the Einstein radius of a typical microlensing mass; as the size of the source region is increased, the more the microlensing magnification map is smoothed out, reducing the degree of variability in a microlensing light curve. An implication of this relation is that a small source with small microlensing masses can induce the same degree of flux variability as a large source with correspondingly large masses.
The caustic network produced at high optical depth is very complex, displaying regions of tight, clustered caustics, interspaced with regions of gently undulating magnification (see fig. 2). Importantly, it has been shown (e.g. Paczynski 1986b) that at such high optical depth individual microlenses cannot accurately reproduce the complicated net of caustics seen in magnification maps. Since the generation of caustics in a magnification map is a highly non-linear process, the addition or elimination of a single microlens can significantly distort significant regions of the magnification pattern, typically on scales larger than the caustic influence of an isolated mass (Wambsganss 1992). This was revealed during the first analysis of the microlensing light curve of QSO 22370305: Irwin et al. (1989) tried to directly estimate the mass of the microlens responsible for a particular event observed in one of the images in this system, using the time scale of the variability and relating to the Einstein radius of an isolated microlensing mass. In a further analysis of this microlensing light curve, the same group (Webster et al. 1991) suggested that this procedure was not the correct approach, due to the non-linear way in which microlenses masses combine to produce the caustic structure, a situation confirmed in the theoretical work of Wambsganss (1992).
It is important to remember this lesson when examining the recent study of microlensing in QSO 22370305 by Lee et al. (2005). Their approach attempts to directly and exactly reconstruct the observed variability in the light curves, by firstly adopting the shear for the two images they analyzed (A and C) from the macromodel of Witt et al. (1995). They then proceed to construct the caustic network by individually adding microlenses; the first mass produces the simple caustic structure of an isolated Chang-Refsdal lens (Chang & Refsdal 1979), but subsequent individual masses distort this caustic structure into a more complex form. Then, convolving this caustic map with a source surface brightness distribution, the synthetic light curve can be directly compared with the observed variability and the location of the microlensing masses and the source profile can be adjusted via a standard minimization to account for the observed variability. From the density of microlensing masses used to finally reconstruct the microlensing light curve, these authors then ”deduce” the microlensing optical depth responsible.
In critically examining the approach by Lee et al. (2005), named LOHCAM (Local High Amplification Event Caustic Model), a number of shortcomings are directly evident. The construction approach assumes that the microlensing masses are somehow isolated, resulting in an isolated caustic network whose precise properties can be determined. While isolated groups of caustics do occur at high optical depths, such groups are not formed by isolated groups of stars, rather they occur due to the non-linear combination of distributed microlensing masses embedded in a population as a whole. This effectively invalidates one of the primary assumptions of the approach by Lee et al. (2005). This is further exacerbated by their treatment of the shear. Firstly, Lee et al. (2005) chose the model of Witt et al. (1995), arguing that the accurate model of Schmidt et al. (1998) does not take account of the dark halo of the lensing galaxy. However, the analysis of Witt et al. (1995) found the shear at a particular image is strongly dependent upon the adopted parameterization of their mass models and hence the selection of a particular value may not reflect the true shear. The second problem with their approach comes in the application of this shear; again, the authors consider the cluster of stars responsible for the microlensing in QSO 22370305 to be somehow isolated, subject only to the global shear for the region. In reality, however, the shear at any point in a high optical depth microlensing star field will differ significantly from the global shear due to coherent shearing effects of other masses in the population. The only way to counter this is to assume that the microlensing situation under consideration is actually at low optical depth [effectively the conclusion reached by Lee et al. (2005)], or that the cluster is somehow truly isolated from the overall microlensing population. The first option contradicts all modeling of the gravitational lensing in this system, whereas the second is extremely contrived.
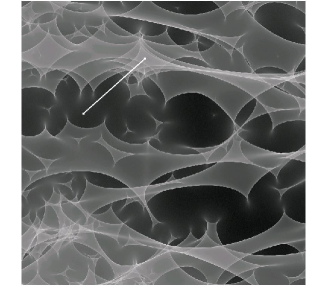

The result of this procedure, therefore, will be a macro model for the images in QSO 22370305 which bares no resemblance to reality. Rather, like a typically underconstrained model, with enough parameters a fit to the data can be made, but this fit will have no physical meaning. This can clearly be seen if we extend the analysis of Lee et al (2005) to images B and D in QSO 22370305. Unlike images A and C, these two images have remained relatively quiescent since the discovery of this lensing system (see Fig. 1 again for the configuration of the four images of the system). The approach of Lee et al. (2005) would conclude that the optical depth to microlensing in these images is essentially zero, with no caustic features required to explain the lack of variability. Clearly this conflicts with the established models of these images which show the optical depth to be substantial and where quiescent periods naturally arise in the clustered caustic maps that result at such optical depths (see fig. 2). It should be noted that such quiescent periods are not due to gaps in the stellar distribution, but are the result of the complex combination of magnfications due to many stars in the lensing galaxy.
Hence, the approach adopted by Lee et al. (2005) results in an unphysical model, but could it be employed to understand the details of microlensing at high optical depth? Such an approach would require no a priori selection of parameters, such as global shear, but would have to have to search parameter space for particular combinations of convergence and shear. Such an approach, however, is extremely computationally expensive, especially given the almost infinite random locations of microlensing masses, as well as the more vexing question of just how many masses are required to properly describe the microlensing as a whole. In summary, the search for a unique answer will be underconstrained and plagued by degeneracies. Therefore, any realistic analysis of the microlensing mass distribution in QSO 22370305 can only be undertaken via statistical techniques.
Lee et al. (2005) seem to be aware of the necessity of a statistical approach, although it is not employed in their current contribution, and note that it is necessary to determine the transverse velocity of the lensing galaxy in QSO 2237+0305. Several statistical approaches have already been conducted to determine this velocity (see Wyithe et al 2000c; Kochanek 2004; Tuntsov et al. 2004). Gil-Merino et al. (2005) studied synthetic light curves drawn from magnification maps for images B and D, examining the distribution of quiescent periods, although all four images were utilized in the overall analysis. Hence, this analysis is compatible with both periods of quietness for these two components and periods of variability in the A and C components. Using a range of physical source sizes from cm to cm, they obtained an upper limit for the effective transverse velocity km/s in the lens plane for (a factor of 10 larger in the source plane and a factor of 3.5 for ). The result in the effective transverse velocity was not dependent on the source size in the explored range. Hence, the source size adopted by Lee et al. (2005) was indirectly tested in this previous work, which adds another argument against the Lee et al. (2005) results; if the conclusions of Lee et al. (2005) are correct, and a population of sub-Jupiter mass objects are responsible for the microlensing in QSO 22370305, then the transverse velocity of the lensing galaxy must be reduced by a factor of 10-100 to be able to produce the quiescent periods observed in light curve of image D. Such a situation is physically implausible as even if the bulk velocity of the galaxy is assumed to be small, the peculiar motions of the stars will be much higher (215 km/s, Foltz et al. 1992) and will be the dominant effect (Kundic & Wambsganss 1993).
3 Conclusions
Lee et al. (2005) have presented a new analysis of the light curves of the gravitationally microlensed quasar QSO 22370305. The conclusions of this result differ significantly from other analyses of the same data set, finding an exact fit to the light curves with only a small number of microlensing stars. This letter has outlined several significant flaws in the approach adopted by Lee et al. (2005), finding their initial assumptions, and hence their conclusions, to be incorrect. Furthermore, given the almost infinite potential range of configurations of microlensing masses, any exact fit to the data will be subject to a huge range of degeneracies and no uniqueness for a particular configuration can be reliably claimed. Hence, such microlensing analysis cannot be represented by a model minimization approach. In summary, this letter suggests that the Lee et al. (2005) claim that their approach will play a key role in the future of the study of high magnification microlensing events is incorrect.
References
- (1) Alcalde D., Mediavilla E., Moreau O. et al. 2002, ApJ, 572, 729
- (2) Chang K., Refsdal S., 1979, Nature, 282, 561
- (3) Corrigan R.T., Irwin M.J., Arnaud J. et al. 1991, AJ, 102, 34
- (4) Foltz C.B., Hewett P.C., Webster R.L., Lewis G.F., 1992, ApJ, 386, 43
- (5) Gil-Merino R., 2003, PhD Thesis, Potsdam Univ., Germany
- (6) Gil-Merino R., Wambsganss J., Goicoechea L.J., Lewis G.F., 2005, A&A, 432, 83
- (7) Goicoechea L.J., Alcalde D., Mediavilla E., Muñoz J.A., A&A, 397, 517
- (8) Haugan S.V.H., IAU, 173, 255
- (9) Irwin M.J., Webster R.L., Hewett P.C. et al. 1989, AJ, 98, 1989
- (10) Kayser R., Refsdal S., Stabell R., 1986, A&A, 166, 36
- (11) Kochanek C.S., 2004, ApJ, 605, 58
- (12) Kundic T., Wambsganss J., 1993, ApJ, 404, 455
- (13) Lee D.-W., Surdej J., Moreau O. et al. 2005, A&A, submitted, astro-ph/0503018
- (14) Lewis G.F., Miralda-Escudé J., Richardson D.C., Wambsganss J., 1993, MNRAS, 261, 647
- (15) Østensen R., Refsdal S., Stabell R. et al. 1996, A&A, 309, 59
- (16) Paczynski B., 1986, ApJ, 304, 1
- (17) Paczynski B., 1986, ApJ, 301, 503
- (18) Shakura N.I., Sunyaev R.A., 1973, A&A, 24, 337
- (19) Schmidt R., Kundić T., Pen U.-L. et al. 2002, A&A, 392, 773
- (20) Schmidt R.W., Webster R.L., Lewis G.F, 1998, MNRAS, 295, 488
- (21) Shalyapin V.N., Goicoechea L.J., Alcalde D. et al., 2002, ApJ, 579, 127
- (22) Schneider P., Ehlers J., Falco E.E., 1992, ”Gravitational Lenses” (Berlin, Springer Verlag)
- (23) Tuntsov A.V., Walker M.A., Lewis G.F., 2004, MNRAS, 352, 125
- (24) Vakulik V.G., Dudinov V.N., Zheleznyak A.P. et al. 1997, Astron. Nachr., 318, no.2, 73
- (25) Wambsganss J., 1992, ApJ, 392, 424
- (26) Wambsganss J., Paczynski B., Katz N., 1990, ApJ, 352, 407
- (27) Webster R.L., Ferguson A.M.N., Corrigan R.T. Irwin M.J., 1991, AJ, 102, 1939
- (28) Witt H.J., 1993, ApJ, 403, 530
- (29) Witt H.J., Mao S., 1994, ApJ, 429, 66
- (30) Wyithe J.S.B., Webster R.L., Turner E.L., 2000a, MNRAS, 318, 762
- (31) Wyithe J.S.B., Webster R.L., Turner E.L., 2000b, MNRAS, 315, 51
- (32) Wyithe J.S.B., Webster R.L., Turner E.L., 2000c, MNRAS, 312, 843
- (33) Witt H., Mao S., Schechter P.L., 1995, ApJ, 443, 18
- (34) Woźniak P.R., Alard C., Udalski A. et al. 2000, ApJ, 529, 88
- (35) Yee H.K.C., 1988, AJ, 95, 1331