Supernova explosions in the early universe: Evolution of radiative remnants and the halo destruction efficiency
Abstract
We study the evolution of supernova (SN) remnants of the first stars, taking proper account of the radiative feedback of the progenitor stars on the surroundings. We carry out a series of one-dimensional hydrodynamic simulations with radiative cooling, starting from initial configurations that are drawn from the results of our earlier radiation hydrodynamic simulations of the first Hii regions. We primarily consider explosion energies erg, appropriate for various types of a single Population III supernova, and also explore cases with greater energy to model multiple explosions. In low-mass () halos, the stellar radiation significantly reduces the ambient gas density prior to the SN explosion. The blastwave quickly propagates over the halo’s virial radius, leading to complete evacuation of the gas even with the input energy of erg. We find that a large fraction of the remnant’s thermal energy is lost in yr by line cooling, whereas, for larger explosion energies, the remnant expands even more rapidly with decreasing interior density, and cools predominantly via inverse Compton process, adding bulk of the energy to cosmic microwave background photons. In higher mass ( halos, the gas density near the explosion site remains high ( cm-3) and the SN shock is heavily confined; the thermal energy of the remnant is quickly radiated away by free-free emission, even if the total input energy exceeds the binding energy of halos by two orders of magnitude. We show that the efficiency of halo destruction is determined not only by the explosion energy but also by the gas density profile, and thus controlled by radiative feedback prior to the explosion. We compute the emissivity of the remnants in various energy ranges and examine the detectability by future observations. Several implications of our results for the formation of first quasars and second-generation stars in the universe are also discussed.
Subject headings:
cosmology:theory — stars:Population III — supernovae1. Introduction
The cosmic Dark Ages ended when the first stars lit up the universe. This ‘dawn’ of the universe may have been accompanied by rather violent events; first supernova (SN) explosions. Various feedback effects on the intergalactic medium (IGM) are caused by SN explosions, and the importance of early SNe can be easily appreciated by noting that only light elements were produced during the nucleosynthesis phase in the early universe. Heavier elements such as carbon and oxygen must have been expelled by means of SN explosions at some early epoch to account for various observations of metal enrichment at high redshifts.
In the standard cold dark matter (CDM) model, the first objects are formed in low-mass halos (Couchman & Rees 1986; Tegmark et al. 1997; Yoshida et al. 2003). Even a single SN explosion can destruct such a ‘mini-halo’ and thus can cause a strong negative feedback effect: if the halo gas is completely blown away by a SN explosion, the subsequent star-formation is likely to be suppressed temporarily in the same region. On the other hand, if the shock-heated gas remains trapped within a deep gravitational potential, gas cooling and condensation may occur even more efficiently thereafter; heavy elements processed in the precursor star is dispersed in the vicinity of the explosion site, and then the overall gas cooling efficiency can be locally enhanced. The strengths of these effects and the halo destruction efficiency are of considerable cosmological interest, because they may largely control the global cosmic star formation rate at very high redshifts.
Recent theoretical studies on the formation of primordial stars consistently suggest that the first stars are rather massive (Abel, Bryan & Norman. 2002; Bromm, Coppi & Larson 2002; Omukai & Palla 2003). If the first stars are indeed as massive as , they end their lives as energetic SNe via the pair-instability mechanism (e.g., Barkat, Rakavy, & Sack 1967; Bond, Arnett, & Carr 1984; Fryer, Woosley, & Heger 2001; Heger & Woosley 2002), releasing a total energy of up to erg. Such energetic explosions in the early universe are thought to be violently destructive: they expel the ambient gas out of the gravitational potential well of small-mass dark matter halos, causing an almost complete evacuation (Bromm, Yoshida, & Hernquist 2003; Wada & Venkatesan 2003). Since the very massive stars process a substantial fraction of their mass into heavy elements, early SN explosions may provide an efficient mechanism to pollute the surrounding IGM (Schneider et al. 2002; Yoshida, Bromm & Hernquist 2004; Qian & Wasserburg 2005).
The physics of astrophysical blastwaves has been extensively studied in various contexts (e.g., Ikeuchi 1981; Bertschinger 1985; Vishniac, Ostriker, Bertschinger 1985; see also a comprehensive review by Ostriker & McKee 1988). On a cosmological background, Ikeuchi (1981) suggested energetic explosions in the early universe as a large-scale star-formation and galaxy formation mechanism. Carr, Bond & Arnett (1984) and Wandel (1985) studied shell fragmentation in a similar scenario involving Population III SN explosions in the early universe. Dekel & Silk (1986) studied the impact of star-bursts and associated SN-driven winds on the formation of dwarf galaxies, whereas Tegmark, Silk & Evrard (1993) suggested a reionization model by SN-driven blastwaves. Pre-galactic outflows driven by multiple SNe are suggested also as an IGM enrichment mechanism at high redshifts (Madau, Ferrara & Rees 2001; Mori, Ferrara & Madau 2002). More recently, Bromm et al. (2003) carried out three-dimensional (3-D) simulations of the first SN explosions in a CDM universe and studied the various feedback effects caused by them. Wada & Venkatesan (2003) performed grid-based Eulerian hydrodynamic simulations of SN explosions in isolated small galaxies and showed that the expelled gas falls back to the potential well after about the system’s free-fall time. While these previous works consistently showed the destructive aspect of early SN explosions, they either simulated a few specific cases or employed somewhat simplified initial conditions. The density profile around the explosion sites can be more complex and critically control the efficiency of cooling of SNRs (e.g. Terlevich et al. 1992). Therefore, it is important to carry out hydrodynamic simulations starting from proper, realistic initial conditions.
In our earlier work (Kitayama, Yoshida, Susa & Umemura 2004; hereafter Paper I), we studied the evolution of cosmological Hii regions around the first stars, by solving self-consistently radiative transfer, non-equilibrium chemistry, and hydrodynamics. We showed that the final gas density profile depends sensitively on the halo mass. In ‘mini-halos’ with mass , the ionization front quickly expands to a radius of over 1 kpc and the halo gas is effectively evacuated with the mean density of the halo decreasing to cm-3 (see also Whalen et al. 2004). In larger mass () halos, the Hii region is confined well inside the virial radius and the central density remains high at cm-3. Since SN explosions are triggered at the death of the central star, the evolved profiles of density, temperature, and velocity of these simulations should serve as appropriate initial conditions for the studies of the SN explosions and subsequent remnant evolution.
In the present paper, we study the evolution of SNRs in the high-redshift universe, using 1-D numerical simulations that start from the final outputs of our earlier simulations of the first Hii regions mentioned above. We primarily consider point explosions caused by Population III SN with a total explosion energy of erg. We calculate the destruction efficiency and the rate of radiative loss from the SNRs to address their cosmological implications. Our study differs from previous works on astrophysical explosions in the following points; 1) our simulations include the gravitational force exerted by the host dark matter halo, and 2) we adopt realistic initial conditions for Population III SN sites that are calculated by self-consistent radiative transfer calculations. The simulations incorporate all the relevant cooling processes at K for a primordial gas, including the inverse-Compton cooling which is important at . We also examine several cases with an enormous explosion energy, erg, on the assumption that multiple massive stars form in a single star-forming region and that they explode almost simultaneously. This situation may indeed be plausible in large mass systems in which gas can cool efficiently via hydrogen atomic cooling. Because the lifetime of massive stars (supernova progenitors) is typically comparable to or shorter than the evolution time scale of SNRs, we approximate such simultaneous multiple explosions by a single explosion with a large total energy.
Throughout the paper, we work with a -dominated cosmology with matter density , cosmological constant , the Hubble constant in units of km s-1Mpc-1, and baryon density .
2. The simulations
2.1. The code
We use the hydrodynamics code of Kitayama & Ikeuchi (2000) and Kitayama et al. (2000, 2001, 2004). It employs the second-order Lagrangian finite-difference scheme in spherically symmetric geometry (Bowers & Wilson 1991), and treats self-consistently gravitational force, hydrodynamics, and radiative cooling. The basic equations are presented in Sec. 2 of Kitayama & Ikeuchi (2000). We adopt an artificial viscosity formulation of Caramana, Shashkov & Whalen (1998), designed to distinguish between shock-wave and uniform compression using an advection limiter.
The gas is assumed to have the primordial composition with hydrogen and helium mass fractions, and , respectively. The atomic cooling rates are taken from the compilation of Fukugita & Kawasaki (1994). Since our primary interests lie in the evolution of SNRs at temperatures K until the formation of cooled dense shells, formation of molecules and cooling by them at lower temperatures are not included in the present paper to avoid computational difficulties. As discussed in Appendix, we can assume that electron-ion equilibration is a reasonable assumption in the present calculation. The results of basic code tests relevant to SNR evolution are presented in Appendix. From the results, we conclude that our Lagrangian code accurately reproduces analytic solutions and that it also captures shock regions remarkably well.
2.2. Initial conditions
Supernova explosions are triggered after the progenitor stars have shined for their lifetime. Consequently the ambient gas density and temperature profiles are significantly modified by their radiation. As shown in Paper I, the resulting density and temperature profiles are indeed quite complex, being dependent on the central source luminosity, density profile, and the host halo mass. We thus take the final output of our previous simulations for the ionization front (I-front) propagation as initial configurations for the present explosion simulations.
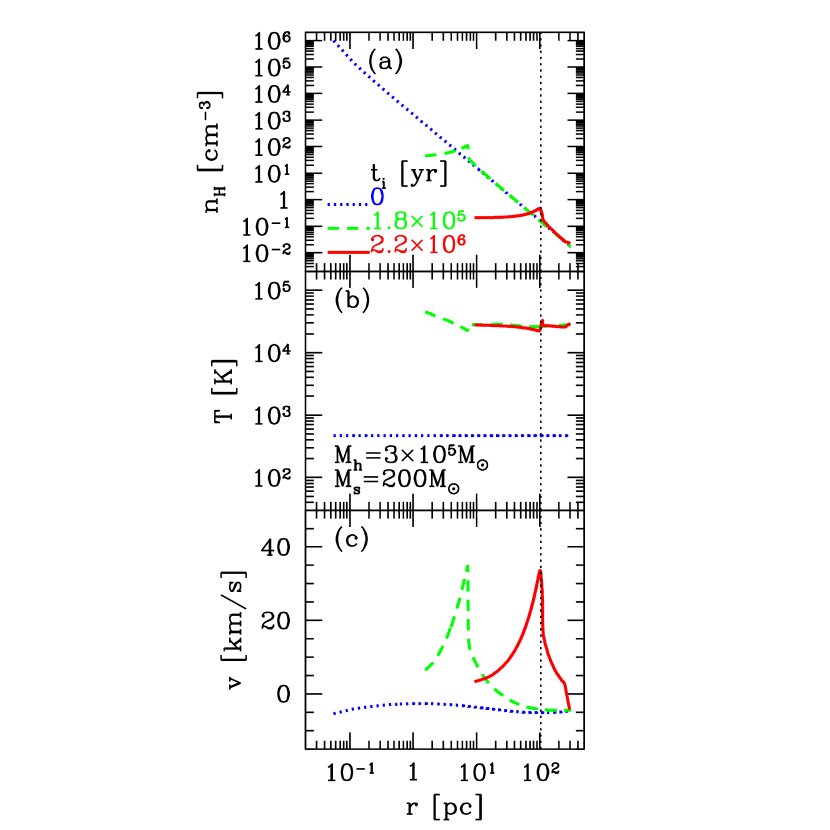
Unless otherwise stated, we adopt the fiducial set up in Paper I; a single progenitor star of mass is placed at the center of a halo collapsed at redshift . The gas density profile prior to the birth of the star is and is subsequently altered by the stellar radiation during its lifetime 2.2 Myr (Schaerer 2002). Figure 1 shows a characteristic example of such runs in the case of halo mass . The whole halo is ionized promptly and the gas inside the central pc is evacuated within the lifetime of the massive star, with the inner gas density being . For larger mass halos with , on the other hand, the I-front expansion is greatly hindered. Gas infall from the outer envelope continues in such cases and the density within the compact Hii region remains high at cm-3 (Fig. 2 of Paper I).
When making the initial conditions from the outputs of the Hii region calculations, we need to add extra shells and then interpolate the physical quantities in order to resolve thin cooling shocks. We adopt the following second-order re-zoning scheme so that their monotonicity is maintained as well as mass, momentum and thermal energy are conserved in each shell. First, gas density is expressed as a function of enclosed volume as . For the -th shell, we denote its center of volume by and assign the mean gas density of the shell to , i.e. . Second, the density gradient within the -th shell is defined by
| (1) |
where
| (2) | |||||
| (5) |
The gas density at an arbitrary point within the -th shell is computed by . Finally, similar procedures are repeated for the internal energy per unit mass and for the velocity, except that they are expressed as a function of enclosed mass as and , respectively.
For comparison, we also perform some runs without the radiative feedback prior to the SN explosion. Specifically, we adopt the same initial configurations as those in Paper I; the density profile follows a pure power-law with , the gas is isothermal and infalling with the free-fall velocity (dotted lines shown as initial configuration in Fig. 1). We adopt this somewhat artificial configuration in order to examine how the final results of our explosion simulations are affected by the initial density profiles.
All the simulations are initiated when the SN ejecta, assumed to have , has swept up the surrounding mass equal to its own, i.e., at the end of the initial free-expansion phase (see Appendix). This phase ends roughly at given in equation (A5) after the explosion. The extent of the inner-most shell is so chosen that the enclosed mass is . We then add the ejecta mass and the thermal energy to this cell assuming that the ejecta and the swept-up material are fully thermalized. In some cases, the density of the inner-most shell is larger than , its radiative cooling time gets smaller than , and the above assumption may not be valid (Terlevich et al. 1992; see also Appendix). We therefore adopt the following prescription for the initial energy input. To the crudest approximation, the energy lost before the Sedov phase is , where is the rate of energy loss in the inner-most shell computed under the above assumption. If is still greater than zero, we add it to the inner-most shell instead of and start the simulation. If it is less than zero, on the other hand, we regard the SN shock as being stalled during the initial phase and do not perform the simulation. More detailed discussion on the relevant time-scales is presented in Appendix.
We vary the input explosion energy over the range erg to account for various possibilities on the fate of massive stars; Type II SN, pair-instability SN, or by hypernovae (Heger & Woosley 2002; Umeda & Nomoto 2002). We also explore the cases where 10 progenitor stars with have produced an Hii region and explode with a total energy of erg. Since the lifetime of the massive stars, a few million years, is shorter than the characteristic evolution time of the SNR, we approximate the multiple SNe as a single explosion at the center with erg.
The outer boundary is taken at times the virial radius depending on the evolution. Since we do not know a priori the extent to which the blastwave can propagate, this procedure required us to carry out some of the simulations more than once. We set progressively larger radius for the outer boundary and made sure that it encloses the SN shock after yr and also that the boundary radius does not affect the result within the shock radius. Whenever necessary, we extrapolate the gas density to the envelope assuming . We assume that the internal energy and velocity are constant in the extrapolated region in accord with the adopted isothermal density profile. The pressure outside the outer boundary is set by extrapolating the pressure inside the boundary by a quadratic polynomial.
The gas shells are spaced such that the shell mass changes by a constant ratio, less than 1%, between the adjacent shells. The total number of shells is . We have checked that our results remain unchanged when the shell number is doubled or halved.
For the dark matter component, we assume that the density profile is given by a Navarro, Frenk & White (1997) profile as in Paper I. We follow Bullock et al. (2001) to determine the concentration parameter of a halo with total mass collapsing at redshift , by extrapolating their formula to the lower halo masses and the higher redshifts. The dark matter density is normalized so that the dark matter mass within the virial radius is equal to . As we focus on the evolution within yr after the SN explosion, less than the halo dynamical time at , we assume that the dark matter density is unchanged throughout the simulation.
3. Results
3.1. Evolution of early SNRs
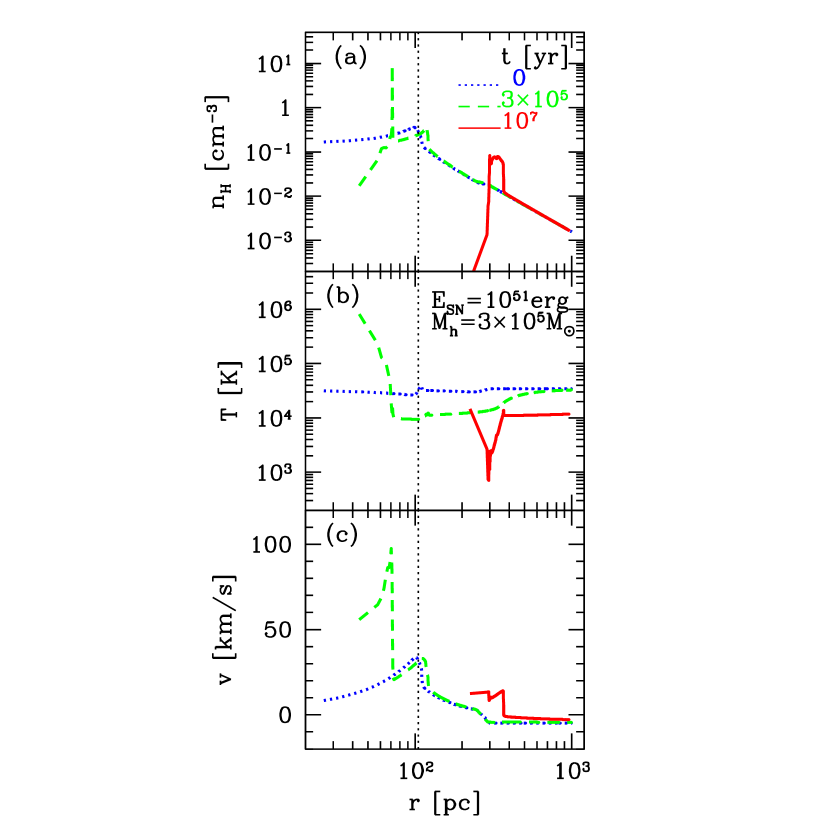
As a characteristic example of an early SNR evolution, we plot in Figure 2 the radial profiles for the run with erg, and . In what follows, we denote by the time elapsed since the end of the initial free-expansion stage. Prior to the SN explosion, the central massive star has ionized the gas beyond the virial radius and the associated shock has swept away the surrounding gas. The central gas density is cm-3 (Fig.1) at the time when the explosion is triggered. This greatly helps the propagation of the newly formed SN shock front. It quickly catches up with the foregoing shock generated during the Hii region formation (see the double peaks in density at yr). The halo gas is evacuated almost completely by yr, and the swept-up material resides in a dense ‘shell’ at pc. We found that the evolution of the SN blastwave before it merges with the foregoing shock is well described by the Sedov self-similar solution for a constant ambient density.
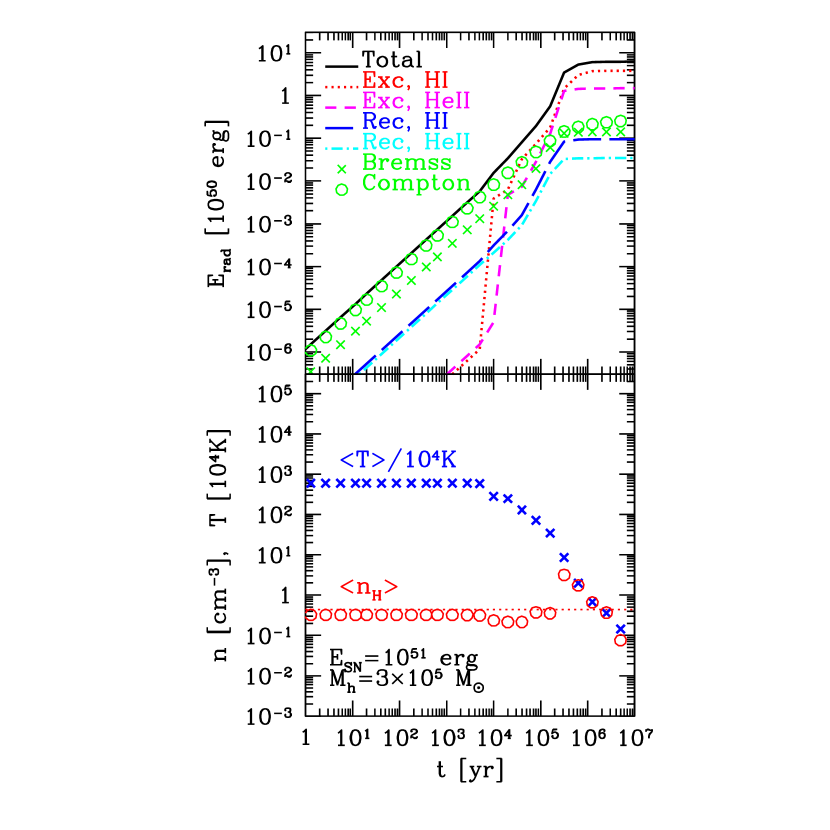
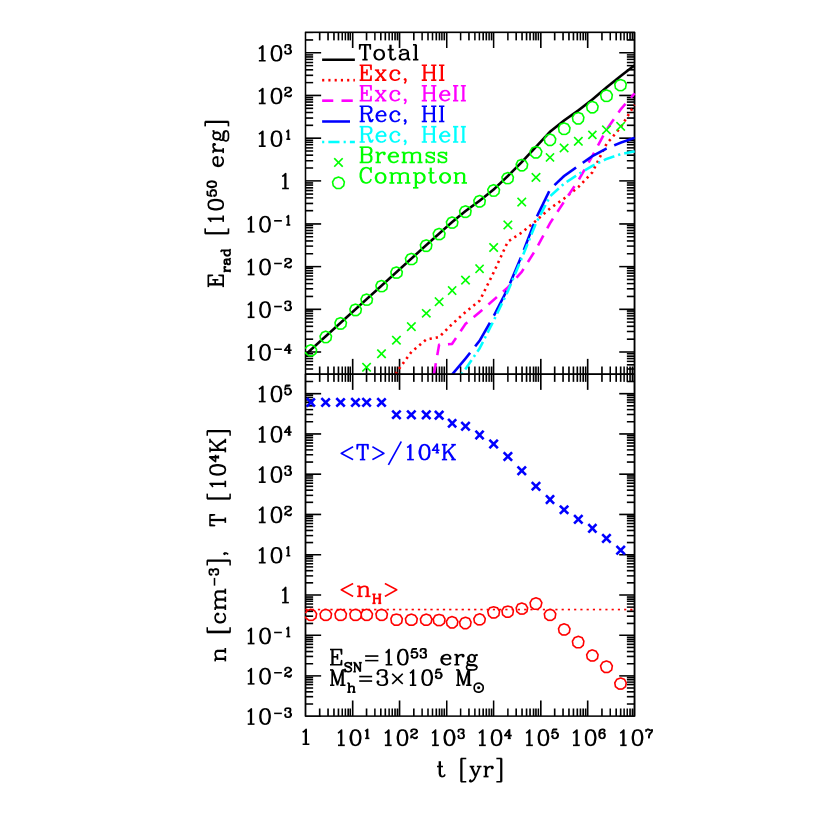
Figure 3 shows the cumulative energy radiated from inside the SN shock front and the mass-weighted mean temperature and density of the SN shocked region for the same run. At yr, the mean temperature of the shocked region is K and the dominant radiative processes are free-free and Compton cooling. The total emission rate is the largest at yr, when the dense shell forms (eq. A12) and the mean density of the shocked region is the largest. Bulk of the thermal energy is then lost via collisional excitation cooling of He+ and H. Thereafter the SNR enters the pressure-driven expansion stage.
We note here that our code does not solve the radiative transfer of photons emitted from the remnant itself. As the blast wave is induced by the pressure gap much greater than that attained by photoionization, the overall effect of the radiative precursor on the dynamics of blastwaves is expected to be small. To check this, we have performed a test run, constraining the temperature of the surrounding gas to be above K to approximate the pre-ionization ahead of the SN shock. For the same set of parameters as in Figure 2, the shock radius at yr changes by only . The difference will be even smaller for stronger blastwaves with larger . Thus we neglect the effect of radiative precursors in the rest of the paper. We refer the reader to a detailed study of the radiative transfer and the emission spectra by Shull & McKee (1979).
The case of a larger total SN energy erg is displayed in Figures 4 and 5. The gas is quickly evacuated and the shock front exceeds the virial radius at yr. The remnant temperature decreases initially via adiabatic expansion rather than radiative cooling. Due both to high temperature and low density of the shocked region, Compton cooling () dominates over the other radiative processes throughout the evolution. In this case, approximately 30% of the explosion energy is lost via the Compton cooling. Clearly, explosion energy can be efficiently transferred to cosmic microwave background (CMB) photons only if the explosion energy is large and/or the gas density is small.
The situation drastically changes if there were no I-front expansion prior to the SN explosion. If the initial density profile of the run shown in Figure 2 is a pure power-law with , the cooling time of the inner-most shell gets smaller than and the ejected energy is rapidly lost during the free-expansion stage, i.e. . Accordingly, the blastwave stalls in the dense environment and the halo gas in the outer envelope will not be disturbed. This is the case even if the ejected SN energy is much greater than the binding energy, erg, for baryons within the virial radius of a halo. It clearly shows the importance of setting-up appropriate initial configurations in quantifying the degree of SN feedback. We emphasize that simple analytic estimates based on explosion energy to binding energy ratio are inappropriate.
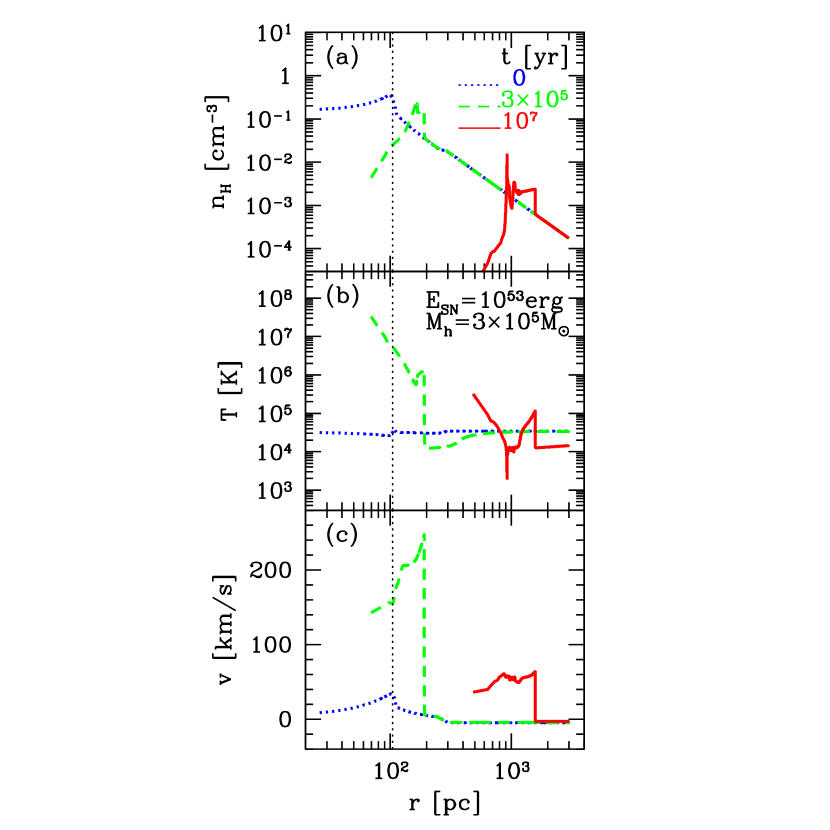
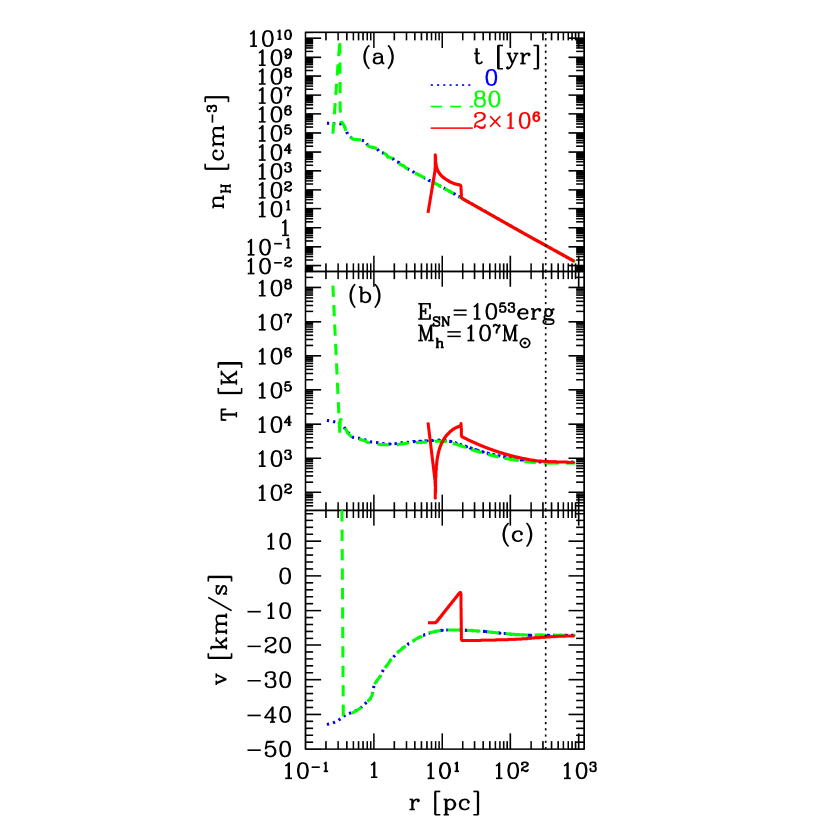
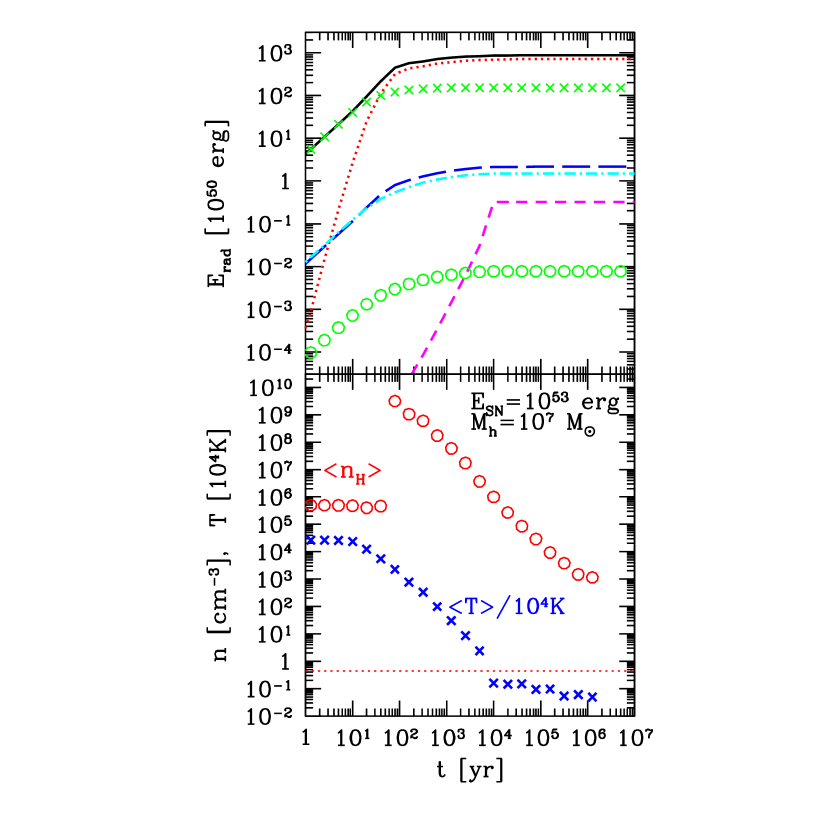
Corresponding cases of no I-front expansion are realized in a halo as large as . As shown in Figure 6, the central gas density remains at cm-3 even when the radiation from the massive star has photo-ionized and photo-heated the gas (see Paper I). The ejected SN energy is lost mainly via free-free emission from the shock interior and collisional excitation cooling from just behind the shock front (Fig. 7). The latter process efficiently converts kinetic energy into radiation in the present case; the gas behind the blastwave is shock-heated but radiates quickly at K. This process dominates the total cooling rate at yr. Due to high expansion velocity and high cooling efficiency, an extremely dense shell forms at yr. The shock expands only to pc in yr and stalls thereafter, being well inside the virial radius. Gravitational force by dark matter pulls the gas to the center, and the mass inflow is eventually recovered. The mass deposition rate inside pc is yr-1 at yr. In order to evacuate the gas out of the virial radius, multiple SN explosions with erg is required. Again this is much greater than the binding energy for baryons within the virial radius, erg.
It is illustrative to compare our 1-D calculation results with those of 3-D simulations. We have attempted a comparison with the Smoothed Particle Hydrodynamis simulations of Bromm et al (2003) as follows. First, we set and erg in a halo collapsing at as found in the parent cosmological simulation of Bromm et al (2003). Since they used an approximate treatment for the radiative feedback prior to the explosion, we decided to use the resulting gas density profile, rather than directly modeling the radiative feedback in their manner. The gas density profile is given such that there is a flat core with cm-3 within the radius pc and the envelope beyond that, as described in Bromm et al (2003). Since all the gas in the halo is ionized within the lifetime of the massive star, we assume that the initial temperature is uniform at K. To allow sufficient spatial resolution near the center, the mass of the inner-most shell is set to be , corresponding to the initial radius of 2.5 pc for this cell. The shell mass increases by between the adjacent shells toward the envelope. We ran the simulations starting from this configuration. The radial positions of the dense shell are found to be , 33, 89, and 214 pc at , , , and yr for erg, and , 34, 130 and 570 pc at , , , and yr for erg, respectively. Overall the evolution of the shock radius agrees well with the results of Bromm et al (2003). At pc, our calculations predict about a few times larger shock radius (i.e. faster expansion) than that plotted in Fig. 1 of Bromm et al (2003). We have checked that our simulations accurately reproduce the analytical solutions for the blast wave propagation in the Sedov phase (Appendix). Thus the disagreement at the small radii could be due to the limited spatial resolution of the 3-D simulations, and/or due to details in the way the initial explosion energy is deposited. Given that the density and velocity fields are likely more complex in the 3-D simulations, performing more accurate comparison would be difficult, and we do not attempt to do so further. We emphasize that it is indeed remarkable that the late-time evolution of the SNR is quite similar in both cases.
3.2. Radiative loss from early SNR
We have shown that the dominant cooling process during the SNR evolution varies with the ambient gas density and the explosion energy. In Figure 8, we plot the radiated energy from the SN shocked region within yr as a function of halo mass. The three panels differ in the explosion energy, as indicated in the figure. Note that, for low-mass halos, the total radiated energy is less than because a part of the SN energy is still in the form of kinetic energy to drive the shell expansion. We find that there are at least three key radiative processes in the evolution of high-redshift SNRs.
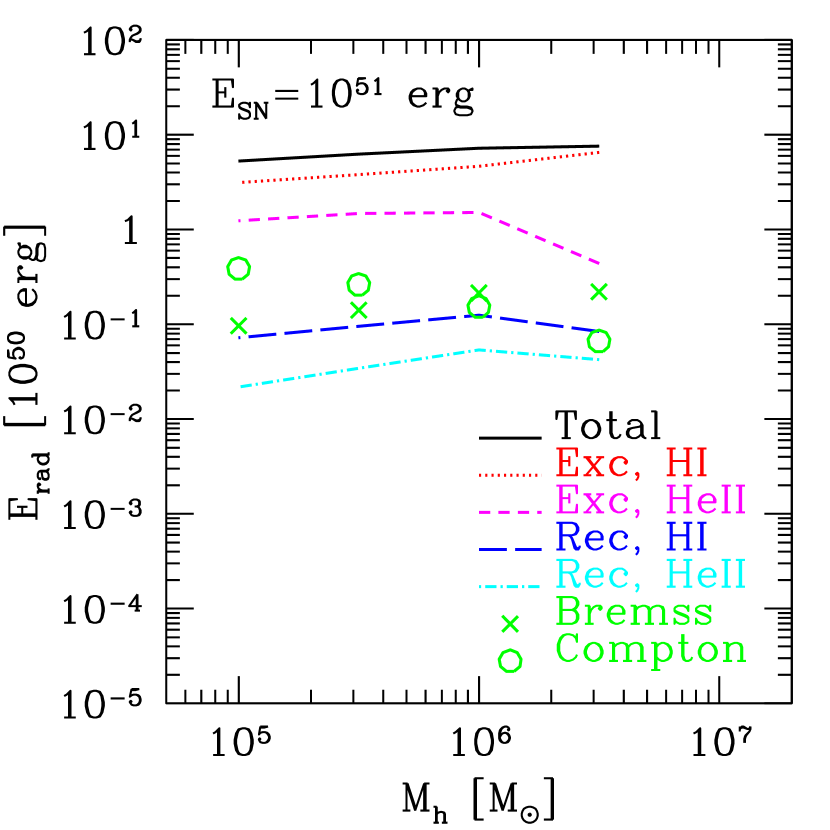
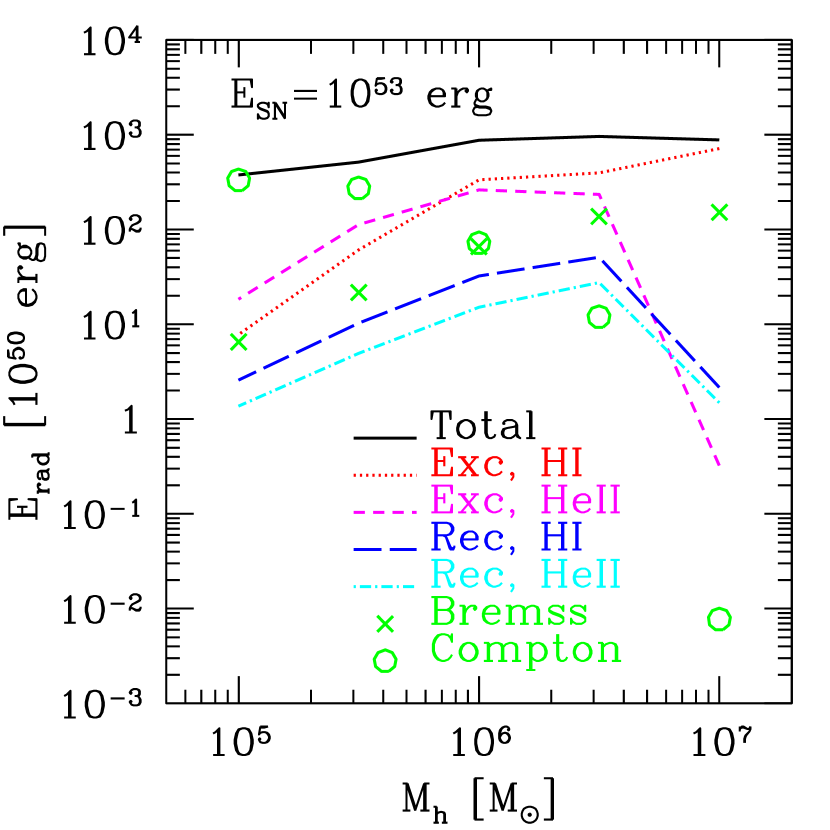
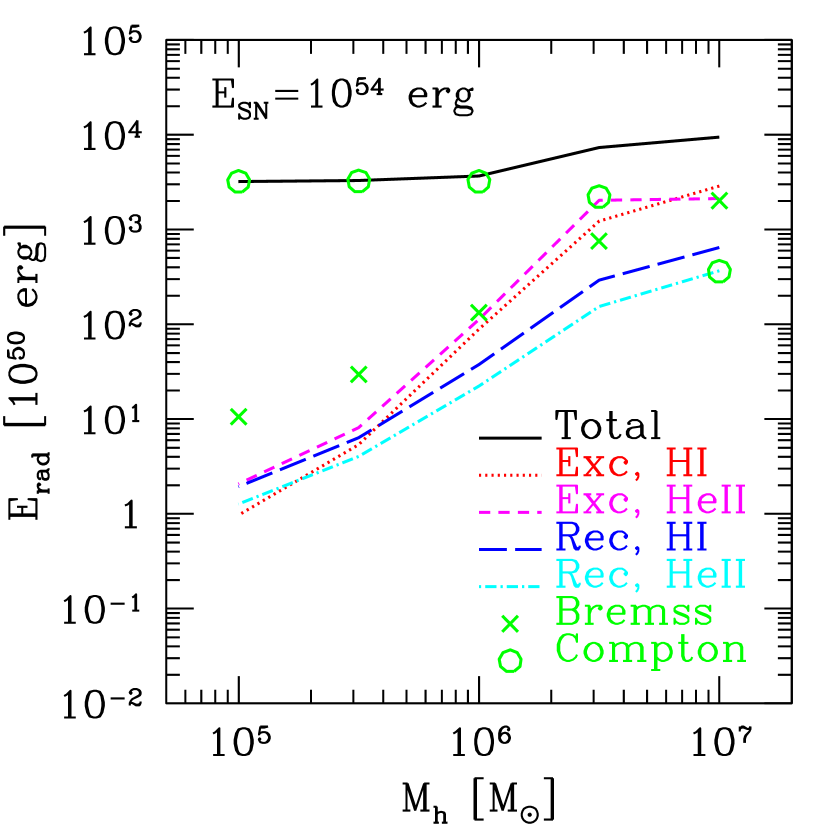
First, collisional excitation cooling of hydrogen and helium is dominant for high or low (e.g., Figs 3 and 7). It is particularly important in the later stage of the SNR evolution, when the temperature drops from K to K and a thin-shell appears. The most prominent process is hydrogen Ly emission. For erg and , about of the ejected energy is ultimately lost by the Ly line in yr, yielding an time-averaged luminosity erg s-1.
Second, Compton cooling is dominant for either very low or very high ; in this case the remnant expands very rapidly and cools mainly after its interior density has decreased significantly (e.g., Fig. 5). It is worth noting that these SNRs can produce small angular scale fluctuations of the CMB via the Sunyaev-Zel’dovich effect (e.g. Oh, Cooray & Kamionkowski 2003). In an extreme case of erg and , of the ejected energy is lost by Compton cooling in yr, yielding erg s-1. The halo virial radius corresponds to arcsec, and the mean -parameter within it is in the first yr and drops thereafter as the gas temperature decreases. We stress that this is a rather extreme case with the explosion of ten very massive stars within a small mass halo. The total energy lost via Compton cooling declines rapidly for larger or smaller . Thus the above numbers should serve as the most optimistic estimates for the Sunyaev-Zel’dovich effect caused by an individual SNRs.
Finally, free-free emission is important for massive halos () in which I-front expansion is suppressed. A large fraction of the explosion energy is lost immediately in the high density and high temperature region near the center, as in the case shown in Figs 6 and 7. Although the mechanical feedback is rather weak in this case, these SNRs can be significant compact X-ray sources. In the case of erg and , for example, of the ejected energy is lost by free-free emission in 30 yr, yielding the rest-frame luminosity of erg s-1 (Fig. 7). The corresponding number for erg and is in yr (Fig. 3), yielding erg s-1.
3.3. Criteria for the blow-away of halo gas
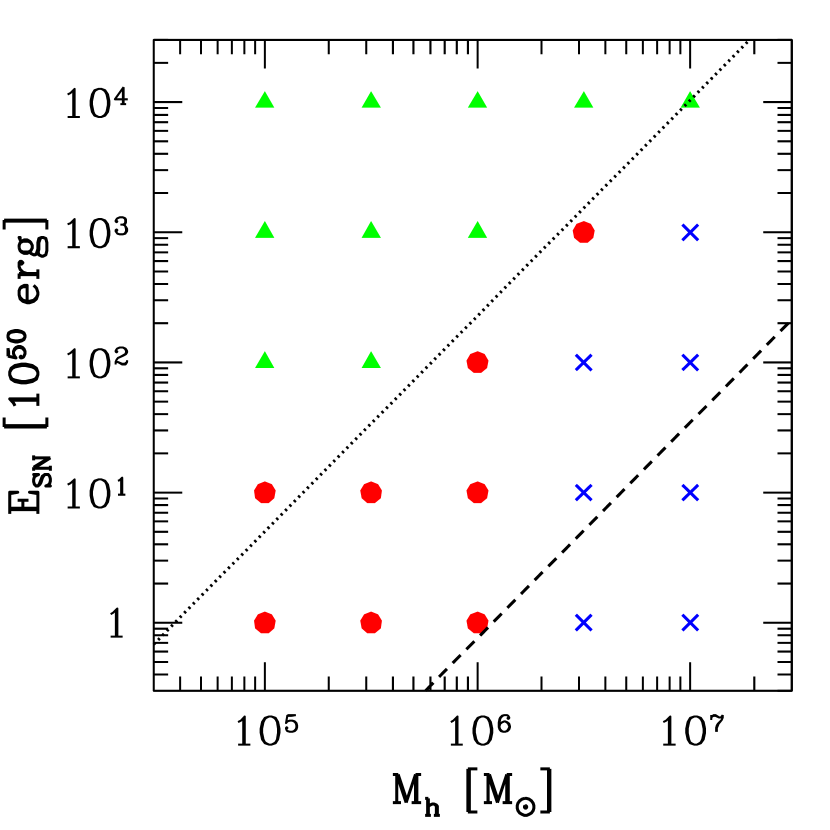
It is our primary goal in the present paper to quantify the halo destruction efficiency by SNe. The fate of host halos are summarized in Figure 9 for a wide range of halo mass and explosion energy. We regard a halo to be ‘blown away’, if more than 90% of the gas inside the virial radius is expelled within yr. We have checked that the result is insensitive to the specific choice of this threshold between 50% and 99%.
Figure 9 shows a clear trend that greater SN energy is required to blow away larger mass halos. It should be noted, however, that the required SN energy is roughly 300 times larger than the total binding energy for baryons in a given halo, if I-front expansion (and hence the decrease of the gas density) prior to the explosion is ineffective. As discussed earlier, this is due to efficient cooling in the high density ( cm-3) environment near the halo center. Once the I-front expansion is properly taken into account, low-mass halos with are blown away even by a single SN with erg. For higher mass halos (), the impact of I-front expansion weakens sharply as shown in Paper I.
We summarize our findings as follows, emphasizing a close link between the fate of halo gas classified in Figure 9 and the main radiative processes described in Sec 3.2. Compton cooling tends to dominate over other processes in halos most readily blown away (triangles). These SNRs will cause distortion in the CMB spectrum via the Sunyaev-Zel’dovich effect. Collisional excitation cooling is likely to be dominant in the others (circles and crosses). Ultra-violet photons from these SNRs may contribute to reionizing the IGM. Free-free emission is stronger in halos not blown away by SN explosion (crosses). They may be the first X-ray sources in the universe.
So far we have focused our attention on the evolution of SNRs until substantial gas cooling takes place within them. It is well known that expanding and cooling gas shells are subject to both thermal and gravitational instabilities (Ostriker & Cowie 1981; Vishniac 1983; MacLow & Norman 1993). Simple analytic arguments show that the fragmentation of the swept-up shell occurs efficiently when the ambient density is higher than cm-3 for the explosion energy of erg (Salvaterra, Ferrara & Schneider 2004). Following Machida et al. (2005), we have compared the local free-fall time-scale
| (6) |
and the sound crossing time-scale
| (7) |
where is the mean mass density, is the thickness and is the sound speed, of the thin shell. We define the shell in our simulations as the region within the full width at half maximum (FWHM) of the density peak, and assume that it is stable against fragmentation if .
We find that the above stability condition is satisfied in all the ‘blown-away’ cases with the initial I-front expansion (triangles and circles in Figure 9). In these runs, the initial gas density is lower than 1 cm-3 due to radiative feedback, resulting in the low efficiencies of both cooling and deceleration of the SN shocks. For the run plotted in Figure 2 ( and erg), the shell attains the highest density at yr with the FWHM pc resolved with eight gas meshes. At this point, the above time-scales are yr and yr, respectively. On the other hand, the shell may become unstable in some ‘stalled’ cases, in which the shell expansion slows down soon after the internal thermal energy is lost and cannot effectively counteract contraction. For the run plotted in Figure 6 ( and erg), becomes shorter than when an extremely dense shell forms at yr. Note that including molecular hydrogen cooling would further promote fragmention by lowering the temperature and increasing the density of the shell. Precise account of this effect needs further study and we address it in greater detail in a separate paper (Kitayama & Yoshida, in preparation). Finally, it is worth noting that first SN explosions could trigger self-propagating star-formation (e.g. Dopita 1985; Efremov & Elmegreen 1998). In large halos, second-generation stars could form in SN shells in the induced manner, rather than via gas condensation onto the halo center.
4. Discussion
The first generation stars cause three key feedback effects on subsequent star/galaxy formation: (1) Radiative feedback by photo-ionizing, -heating, and -dissociating the IGM as well as primordial gas clouds, (2) Mechanical feedback by expelling the surroundings, and (3) Chemical feedback by distributing heavy elements.
Radiative feedback usually has negative effects on star-formation efficiency. The gas in low-mass () halos is almost completely ionized even by a single massive star (Paper I). Soft-UV photons in the Lyman-Werner bands can dissociate hydrogen molecules, the main coolant in the primordial gas, in slightly larger mass halos. While Paper I confirmed a positive feedback effect on H2 formation just ahead of the I-front (Ricotti et al. 2001), it is shown to be rather weak and tentative.
It has also been argued that soft X-rays increase the ionization fraction and promote the formation of hydrogen molecules via the H- path (Haiman, Abel & Rees 2001; Oh 2001; Venkatesan, Giroux & Shull 2001). Heating by secondary electrons may, however, be substantial and the net effect of soft X-rays is still unclear. Indeed, 3-D adaptive-mesh-refinement simulations by Machacek et al. (2003) showed that, whereas molecular hydrogen formation is promoted in dense gas clouds that have already formed, the dominant effect of the X-ray background is to heat the IGM. Machacek et al. also conclude that the net effect (either positive or negative) is found to be quite small for X-ray intensities below erg s-1 cm-2 Hz-1 sr-1. From our estimates of the X-ray emission efficiency of a single SNR, this level of flux is achieved if more than a few thousand SN explosions occurred in a comoving cubic mega-parsec volume by . For reasonable early star-formation models, this rate is implausibly high, and thus we conclude that global feedback effects by X-ray emission from early SNRs are unimportant.
We further argue that the expected intensity of H2 lines from an early SNR is rather small. Consider as an optimistic limit that the ejected energy of erg is used only to heat the ambient gas to K, so that the atomic cooling is negligible. The heated region should enclose the gas mass of or the total mass of . It takes yr for the shock with K to propagate over the virial radius pc of such a halo at . The expected optimal luminosity is then erg s-1. In practice, some of the gas is heated to higher temperatures, atomic cooling will dominate over H2 lines, and the luminosity should be lower than this value.
Mechanical feedback from the first stars is often cited as a destructive process in the context of early structure formation. The energy released by a single Population III SN explosion can be as large as erg, which is much larger than the gravitational binding energy of a minihalo with mass . At the first sight, this simple argument appears to support the notion that high- SNe are enormously destructive. As we have explicitly shown, however, the evolution of the cooling remnants crucially depends on the properties of the surrounding medium, particularly on the central density after the gas is re-distributed by radiation.
The efficiency of radiative feedback declines sharply above a certain halo mass (Paper I), so does that of the mechanical feedback by SNe. Halos above this threshold can thus be ideal candidates for the hosts of the first massive black-holes in cases where supernovae leave remnant black-holes. Our calculations indicate that the mass deposition rate at parsec scales reaches yr-1 in the case of erg, at yr (Sec. 3.1). This value is much higher than a simple estimation for the Bondi accretion rate yr-1 for the ambient gas density cm-3 and temperature K, or the rate resulting in the Eddinton luminosity, yr-1, where is the black-hole mass and is the efficiency factor of fueling. Therefore, it should at least provide a necessary (obviously not sufficient) condition for the near-Eddinton growth of black-holes at the center of these large halos even after the mechanical feedback from the first SNe. We note, however, that actual mass accretion around black holes, occurring at much smaller radius than our simulations probe, is much more complicated because of radiation-hydrodynamical effects, non-spherical geometry, etc. These issues are still highly uncertain and beyond the scope of the present paper.
As has been often discussed in the literature (Ricotti & Ostriker 2004; Yoshida et al. 2004), the first star formation is likely to be episodic, at least locally, because the feedback effects tend to quench further star-formation in the same place. Although metal-enrichment by the first stars could greatly enhance the gas cooling efficiency, which would then change the mode of star-formation to that dominated by low-mass stars (Mackey, Bromm & Hernquist 2003; Bromm & Loeb 2003), the onset of this ’second-generation’ stars may be delayed particularly in low-mass halos. Our results imply that the strength of this negative feedback substantially decreases for halos. In CDM models, halos grow hierarchically and thus all the halos with used to be ‘mini-halo’ at some earlier epoch. If star-formation is prevented earlier in the progenitor small halos either by rapid mass accretion (Yoshida et al. 2003) or by a soft-UV background which raises the minimum mass scale for the gas cloud formation (Machacek et al 2001; Wise & Abel 2005), primordial stars could form in halos. Only if multiple explosions take place after a burst of star-formation in the large halos, a complete destruction can take place. Wada & Venkatesan (2003) showed that such multiple explosions can easily disrupt pre-galactic disks.
5. Conclusions
First supernova explosions in the early universe have a number of consequences on subsequent star formation. While they tend to expel gas from low-mass halos, the extent to which such feedback can operate depends sensitively on the initial configuration of the medium surrounding the explosion site. We have shown explicitly that the ionization front expansion around a massive progenitor star can significantly aid gas evacuation by supernova blastwaves. For halos with mass , essentially all the gas is expelled by merely a tenth of nominal SN explosion energy. On the other hand, if the Hii region is confined within the central portion of the halo, the gas density remains high, and the necessary SN energy for ‘blow-out’ is larger by more than two orders of magnitude than the total binding energy for baryons in the halo, i.e., erg, for at . This is due to very high efficiency of radiative cooling in the dense gas clouds.
We have also found that there are mainly three radiative processes that are important in the early SNRs. (i) Collisional excitation cooling, particularly via the Ly line emission, is dominant for either higher-mass halos or lower SN energy. (ii) Compton cooling is dominant for either lower-mass halos or higher SN energy. (iii) Free-free emission gets stronger for massive () halos, in which the expansion of an Hii region is greatly suppressed, and can make them compact X-ray sources.
Overall, the emergence of the first generation stars have significant impacts on the thermal state of the IGM in the early universe in at least two ways; the initially neutral cosmic gas is first photo-ionized and heated to K by stellar radiation, and subsequently heated to even higher temperature and enriched with heavy elements by SNe. Our results imply that radiative and SN feedback processes are closely related to each other and thus need be treated in a self-consistent manner. Because of the strong feedback effects, early star-formation is likely to be self-regulating; if the first stars are massive, only one period of star-formation is possible for a small halo and its descendant. The sharp decline in the efficiency of both feedback effects at indicates that the emergence of large halos can drastically raise the global star formation rate of the Universe. This may lead to accelerating the metal enrichment of the IGM at an early stage of galaxy formation.
We thank Satoru Ikeuchi, Kuniaki Masai and Paul Shapiro for fruitful discussions, and the referee for useful comments. NY acknowledges support from the 21st COE Program ORIUM at Nagoya University. This work is supported in part by the Grants-in-Aid by the Ministry of Education, Science and Culture of Japan (14740133:TK).
References
- (1) Abel, T., Bryan, G. L., & Norman, M. L. 2002, Science, 295, 93
- (2) Barkat, Z., Rakavy, G., & Sack, N. 1967, Phys. Rev. Lett., 18, 379
- (3) Bertschinger, E. 1983, ApJ, 268, 17
- (4) Bertschinger, E. 1985, ApJS, 58, 39
- (5) Bond, J. R., Arnett, W. D., & Carr, B. J. 1984, ApJ, 280, 825
- (6) Bowers, R. L. & Wilson, J. R., 1991, Numerical Modelling in Applied Physics and Astrophysics (Boston: Jones and Bartlett)
- (7) Bromm, V., Coppi, P. S., & Larson, R. B. 2002, ApJ, 564, 23
- (8) Bromm, V., & Loeb, A. 2003, Nature, 425, 812
- (9) Bromm, V., Yoshida, N., & Hernquist, L. 2003, ApJ, 596, L135
- (10) Bullock, J., et al. 2001, MNRAS, 321, 559
- (11) Caramana, E.J., Shashkov, M.J., & Whalen, P. P., 1998, Journal of Computational Physics, 144, 70
- (12) Carr, B. J., Bond, J. R., & Arnett, W. D., 1984, ApJ, 277, 445
- (13) Couchman, H. M. P., & Rees, M. J. 1986, MNRAS, 221, 53
- (14) Cox, D. P. 1972, ApJ, 178, 159
- (15) Dekel, A., & Silk, J. 1986, ApJ, 303, 39
- (16) Dopita, M. A. 1985, ApJ, 295, L5
- (17) Efremov, Y. N., & Elmegreen, B. G. 1998, MNRAS, 299, 643
- (18) Fryer, C. L., Woosley, S. E., & Heger, A. 2001, ApJ, 550, 372
- (19) Fukugita, M. & Kawasaki, M. 1994, MNRAS, 343, L25
- (20) Haiman, Z., Abel, T., & Rees, M. J., 2000, ApJ, 534, 11
- (21) Heger, A., & Woosley, S. E. 2002, ApJ, 567, 532
- (22) Ikeuchi, S., 1981, Pub. Astr. Soc. Japan, 33, 211
- (23) Kitayama, T. & Ikeuchi, S., 2000, ApJ, 529, 615
- (24) Kitayama, T., Tajiri, Y., Susa, H., Umemura, M., & Ikeuchi, S., 2000, MNRAS, 315, L1
- (25) Kitayama, T., Susa, H., Umemura, M., & Ikeuchi, S., 2001, MNRAS, 326, 1353
- (26) Kitayama, T., Yoshida, N., Susa, H., & Umemura, M., 2004, ApJ, 613, 631 (Paper I)
- (27) Machacek, M. E., Bryan, G. L., & Abel, T. 2001, ApJ, 548, 509
- (28) Machacek, M. E., Bryan, G. L., & Abel, T. 2003, MNRAS, 338, 273
- (29) Machida, M. N., Tomisaka, K., Nakamura, F. & Fujimoto, M. 2005, ApJ, 622, 39
- (30) Mac Low, M.-M., & Norman, M. L. 1993, ApJ, 407, 207
- (31) Mackey, J., Bromm, V., & Hernquist, L. 2003, ApJ, 586, 1
- (32) Madau, P., Ferrara, A., & Rees, M. J. 2001, ApJ, 555, 92
- (33) Masai, K. 1994, ApJ, 437, 770
- (34) Mori, M., Ferrara, A., & Madau, P., 2002, ApJ, 571, 40
- (35) Navarro, J. F., Frenk, C. S. & White, S. D. M., 1997, ApJ, 490, 493
- (36) Oh, S. P. 2001, ApJ, 569, 558
- (37) Oh, S. P., Cooray, A., & Kamionkowski, M. 2003, MNRAS, 342, 20
- (38) Omukai, K., & Palla, F. 2003, ApJ, 589, 677
- (39) Ostriker, J. P., & Cowie, L. L. 1981, ApJ, 243, L127
- (40) Ostriker, J. P., & McKee, C. F. 1988, Rev. Mod. Phys., 60, 1
- (41) Qian, Y.-Z. & Wasserburg, G. J., 2005, ApJ in press
- (42) Ricotti, M., Gnedin, N. Y., & Shull, J. M. 2001, ApJ, 560, 580
- (43) Ricotti, M., & Ostriker, J. P. 2004, MNRAS, 350, 539
- (44) Salvaterra, R., Ferrara, A., & Schneider, R. 2004, New Astronomy, 10, 113
- (45) Schaerer, D. 2002, A&A, 382, 28
- (46) Schneider, R., Ferrara, A., Ntarayan, P. & Omukai, K. 2002, ApJ, 571, 30
- (47) Sedov, L. I. 1959, Similarity and Dimensional Methods in Mechanics (New York: Academic Press)
- (48) Shull, J. M. 1980, ApJ, 237, 769
- (49) Shull, J. M. & McKee, C. F. 1979, ApJS, 227, 131
- (50) Tegmark, M., Silk, J., & Evrard, A. 1993, ApJ, 417, 54
- (51) Tegmark, M., Silk, J., Rees, M. J., Blanchard, A., Abel, T., & Palla, F. 1997, ApJ, 474, 1
- (52) Terlevich, R., Tenorio-Tagle, G., Franco, J., & Melnick, J. 1992, MNRAS, 255, 713
- (53) Umeda, H., & Nomoto, K. 2002, ApJ, 565, 385
- (54) Umeda, H., & Nomoto, K. 2003, Nature, 422, 871
- (55) Venkatesan, A., Giroux, M. & Shull, J. M., 2001, ApJ, 563, 1
- (56) Vishniac, E. T. 1983, ApJ, 274, 152
- (57) Vishniac, E. T., Ostriker, J. P., & Bertschinger, E., 1985, ApJ, 291, 399
- (58) Wada, K., & Venkatesan, A. 2003, ApJ, 591, 38
- (59) Whalen, D., Abel, T., & Norman, M. N. 2004, ApJ, 610, 14
- (60) Wandel, A. 1985, ApJ, 294, 385
- (61) Wise, J. & Abel, T. 2005, astro-ph/0411558
- (62) Yoshida, N., Abel, T., Hernquist, L. & Sugiyama, N., 2003, ApJ, 592, 645
- (63) Yoshida, N., Bromm, V., & Hernquist, L. 2004, ApJ, 605, 579
Appendix A Basic features of the SNR evolution in the early universe
The evolution of a SNR may be divided into three stages: (1) a free-expansion phase when the SN ejecta expand at nearly a constant velocity, (2) an adiabatic Sedov phase which is described by a self-similar solution, and (3) a pressure-driven snow-plow phase when a dense shell forms within which the thermal energy of the gas is radiated away. In the following, we describe basic elements of physical processes associated with point explosions.
The free-expansion phase lasts until the ejecta sweeps up roughly the same amount of mass as their own, , in the surrounding medium:
| (A1) |
yielding
| (A2) |
where is the radius enclosing , is the proton mass, is the hydrogen mass fraction, and is the mean hydrogen number density of the surrounding medium. With the ejected kinetic energy , the initial shock velocity is
| (A3) |
corresponding to the initial shock temperature of
| (A4) |
where is the mean molecular weight and is the Boltzmann constant. The time taken for the shock to reach is then estimated as
| (A5) |
The time required for electrons to attain the shock temperature via Coulomb collisions is roughly (Masai 1994)
| (A6) |
So long as , one can assume that electron-ion equilibration is achieved and , where is the electron temperature. The hot gas in the interior of high redshift () SNRs cools initially via free-free emission and Compton scattering with the time-scales given respectively by
| (A7) | |||||
| (A8) |
If either or is shorter than , the ejected energy is radiated away before entering the Sedov phase. If and are both greater than , the evolution is adiabatic. Note that can be larger than for low or high . The radiative cooling, however, is unimportant in such cases and the shock can still be well described by the adiabatic solution and electron-ion equilibration is eventually achieved.

For a power-law density profile with , the expansion of a blastwave in the adiabatic Sedov phase is described by the self-similar solution,
| (A9) |
where is the shock radius at time after the explosion (Sedov 1959; see also Ostriker & McKee 1988). In reality, the gas density profile can be more complex because photo-evaporation due to radiation from the central star is very effective in low-mass halos (Paper I). If the size of the Hii region is comparable to the virial radius (e.g. Fig. 2), the gas density inside the Hii region is nearly uniform at . For a constant density medium, the Sedov-Taylor self-similar solution reduces to
| (A10) | |||||
| (A11) |
Note that the shock radius in equation (A9) scales only weakly with the density and the explosion energy unless the density profile is very steep. The 3-D simulations of Bromm et al. (2003) show that the evolution of the shock radius is well described by equation (A10) in a piecewise manner for regions having density profiles with different slopes.
The above adiabatic solution breaks down once the gas becomes radiative. A dense shell will form roughly at the sag time (Cox 1972; Shull 1980) at which with from equations (A7) and (A11);
| (A12) |
The shock will then follow the snow-plow solution, (Shull 1980). The momentum-driven slow expansion is still important over a cosmological time-scale (Bertschinger 1983), with the radius doubling every twenty folds in time.

Appendix B Code test
We have tested and verified the validity of our Lagrangian code by a variety of test problems. The results of the ‘Strömgren sphere’ test is presented in Paper I. We here describe the results of the Sedov explosion problem (Sedov 1959), which is the most relevant to the present paper.
We solve the evolution of a blastwave in a spherical halo with and . For the sake of direct comparisons with the self-similar solutions, we neglect gravitational force and radiative cooling. The initial gas density profile is a power-law with either (uniform) or . The total number of gas shells is ; the inner-most shell encloses the gas mass and the shell mass increases by a constant ratio, , between the adjacent shells toward the envelope. The thermal energy of erg is given to the inner-most shell. The initial thermal energy in the other shells is essentially zero. The initial velocity is also taken to be zero. The simulation is otherwise performed in the same way as the other runs in the present paper.
Figures 10 and 11 compare the outputs of the above test runs and analytical solutions (Ostriker & McKee 1988). The numerical results reproduce well the latter for both and . The positions of shock front, defined as the peak of thermal pressure, agree with the analytical expectations within 1%. This further ensures the capability of the code for the simulations in the present paper.