The Local Group Census: searching for PNe in IC 1613, WLM and GR8††thanks: Based on observations obtained at the 2.5m INT telescope (La Palma, Spain) operated by the Isaac Newton Group and at the 8.2m VLT telescope (Paranal, Chile) operated by ESO (Proposal 70.B-0580(A)).
Abstract
In the framework of the Local Group Census (LGC), a survey of the Local Group (LG) galaxies above Dec=, which is aimed at surveying their populations with strong emission lines, we have searched for planetary nebulae (PNe) in the low-metallicity dwarf irregular galaxies IC 1613, WLM, GR 8. Two new candidate PNe have been found in IC 1613, one in WLM and none in GR 8. The observations presented in this paper, together with the previous results from the LGC, represent the first step in the study of the PN population in low-metallicity, dwarf irregular galaxies of the Local Group. They will be followed by deep spectroscopy to confirm their nature and to study their physical-chemical properties. We used the observed number of PNe in each LG galaxy to estimate a lower limit to the mass of the intermediate-age population which was compared to the Star Formation Rate (SFR) of LG dwarf galaxies. These results are in agreement with those from accurate star formation history (SFH) analysis for these small galaxy systems.
keywords:
planetary nebulae: individual : IC 1613, WLM– Galaxies: individual: IC 1613, WLM, GR 81 Introduction
The Local Group consists of three spiral galaxies and a large number of dwarf galaxies (90% of its 40 known members). This proportion of galaxy types may be typical of the local Universe as similar distributions are known to exist in nearby groups (Miller, 1996) and clusters (Phillips et al., 1998). The dwarf galaxies (irregular, spheroidal or elliptical) of the LG are of particular interest as their proximity allows us to study them in detail, testing predictions concerning their formation and evolution, as, for instance, the evolution of different kind of dwarfs (Richer & McCall, 1995) or their star formation histories (Aparicio, 2001).
Furthermore, their study is relevant because, according to the hierarchical scenario of galaxy formation, dwarf galaxies are the first structures to form and from their merging larger galaxies are built (Nagashima & Yoshii, 2004). Moreover, low-luminosity dwarf galaxies, as those discussed in this paper, are metal poor and are expected to have abundances close to primordial values (Kunth & Östlin, 2000). Thus the abundances derived there can be useful in extrapolating primordial He/H (Peimbert & Torres-Peimbert 1974; Lequeux et al. 1979).
It is also interesting to compare the overall star formation history (SFH) of the Universe predicted by Madau, Pozzetti & Dickinson (1998) with the SFHs of galaxies of different morphological type that exist in the LG (Mateo 1998, Aparicio 2001). This is fundamental in order to understand the variation of SFH from the global average in galaxies of differing morphological type (Renzini 1995, McGaugh & Bothun 1994).
A quantitative SFH can be obtained with the colour-magnitude diagram (CMD) technique (cf. Aparicio & Gallart 2004). This technique involves three main ingredients: i) the data, from which a deep observational CMD can be plotted; ii) stellar evolution and a bolometric correction libraries providing colors and magnitudes of stars as a function of age, mass, and metallicity; and iii) a method to relate the number of stars populating different regions of the observational CMD with the density distribution of stars as a function of age, mass, and metallicity, as predicted by stellar evolution theory (see Aparicio & Gallart 2004 for a complete review). This method can, in principle, constrain the entire star formation and chemical history of a galaxy, but, of course, it depends on the precision of the input models and on the assumptions (Aparicio & Gallart, 2004). Moreover, since the overall results of this method are model dependent, complementary specific evolutionary phases can be used as age-tracers to mark different populations and to infer the presence of a given age component (Mateo, 1998).
In this paper, we present new results from the latest study of individual group members as part of the continuing LG census. This census is a narrow- and broad-band imaging survey of the galaxies of the LG, visible from the Isaac Newton Group of telescopes (ING), whose aim is to find, catalogue and study old and young emission-line populations, such as planetary nebulae, supernova remnants and H ii regions (Corradi & Magrini, 2005). We are interested in identifying Planetary Nebulae, which are good indicators of the presence of intermediate-age stars. LGC observations were obtained with the Wide Field Camera (WFC) at the 2.5m Isaac Newton telescope (INT). The detector of the WFC is a mosaic composed of four CCDs, with 20484096 pixels each. It covers a field of view of . The pixel scale is 0.′′33. 111See http://www.ing.iac.es/rcorradi/LGC for the description of the project
The results obtained until now in the search for PNe in the LG galaxies are described in the following papers: Magrini et al. (2002), Magrini et al. (2003), hereafter M03; Corradi et al. (2005); Leisy et al. (2005); Corradi & Magrini (2005).
Here we describe the results of the observations of the next three targets: the dwarf irregular galaxies IC 1613 (morphological type Ir V according to van den Bergh (2000A), hereafter vdB00), WLM (Ir IV-V; van den Bergh 2000A), and GR 8 (dIrr; Mateo 1998).
The gas-rich dwarf irregular galaxy IC 1613 was first discovered by Wolf (1906) and because of its proximity (730 kpc, Dolphin et al. 2001), its high Galactic latitude (-60∘.6) and consequently small Galactic extinction, has provided an excellent opportunity to observe stellar populations in a low metallicity environment. In fact, its oxygen abundance as derived from H ii regions is approximately 12 + log (O/H)=7.7 (Skillman, Kennicutt & Hodge 1989; Lee, Grebel & Hodge 2003). Moreover, IC 1613 is a relatively isolated non-interacting irregular galaxy, as proven by the lack of stellar clusters generated by interactions with other galaxies (van den Bergh, 2000B). From an evolutionary point of view, it is a very primitive galaxy because the stellar mass is comparable to the gas mass (Hodge et al., 1991). Freedman (1988) presented B, V, R and I stellar photometry pointing out the presence of stars in a wide range of ages, from young to intermediate and old population. Recent Hubble Space Telescope observations by Skillman et al. (2003) found an enhanced star formation rate (SFR) from 3 to 6 Gry ago. A survey for emission-line objects was done in this galaxy by Lequeux, Meyssonnier & Azzopardi (1987) who found one candidate PN.
The Wolf-Lundmark-Melotte (WLM) galaxy was discovered by Wolf (1923) and independently by Lundmark (1923) and by Melotte (1926). WLM (called also DDO 221, van den Bergh 1966) is a Local Group metal-poor dwarf irregular (12 + log(O/H) = 7.7; Skillman, Kennicutt & Hodge 1989), in a part of the Local Group relatively free of galaxies, at a distance of 925 kpc (vdB00). Dolphin (2000) studied with the Hubble Space Telescope the SFH in a portion of WLM. It appears to have begun no more than 12 Gyr ago, forming more than half of its stellar population by 9 Gyr ago. The SFR has subsequently gradually decreased until a recent increase in activity starting between 1 and 2.5 Gyr ago, but is still continuing to the present time. Recent star formation is indicated by several H ii regions around O-type stars, as observed by Hodge & Miller (1995).
To date no candidate PN is known in this galaxy. In fact Minniti & Zijlstra (1997) found the two candidate PNe proposed by Jacoby & Lesser (1981) to be ordinary stars. The other candidate PN identified by Minniti & Zijlstra (1996;1997) was found to be a compact H ii region (Zijlstra, private communication).
GR 8 was first discovered by Reaves (1956) and it was catalogued as DDO 155 by van den Bergh (1959). It is a suspected member of the Local Group (vdB00), but observations of a single Cepheid by Tolstoy et al. (1995) and of the tip of the RGB by Dohm-Palmer, Skillman, & Gallagher (1998) placed this galaxy at the distance of 2.2 Mpc, beyond the usually accepted limit of the LG. GR 8 is one of the intrinsically smallest irregular galaxies known, with an effective radius of only 50 pc and H i mass of 10 (Hodge, Lee & Kennicutt, 1989). Several H ii regions are known in this galaxy (Hodge, 1974). Their abundances have been measured by Skillman et al. (1988), finding one of the lowest known oxygen abundances (12 + log (O/H)=7.4). No PN have been identified in GR 8 (Jacoby & Lesser, 1981). Basic data on the three galaxies are reported in Table 1.
| Name | R.A. (2000.0) Dec. | Type | Distance | Optical size | MV | 12+(O/H) | M | |
|---|---|---|---|---|---|---|---|---|
| (kpc) | (M⊙) | |||||||
| IC 1613 | 01h 04m 47s.8 | +02∘ 07′ 04′′ | Ir V (1) | 725 (1) | 16′20′ | -15.3 (1) | 7.7 (7) | 1108 (10) |
| 3.4 kpc4.2 kpc (4) | ||||||||
| WLM | 00h 01m 58s.1 | -15∘ 27′ 39′′ | IrIV-V (1) | 925 (1) | 6.5′12.6′ | -14.4 (1) | 7.7 (8) | 1.5108 (2) |
| 1.7 kpc3.4 kpc(5) | ||||||||
| GR 8 | 12h 58m 07s.4 | +14∘ 13′ 03′′ | dIrr (2) | 2200 (3) | 1.1′1.0′ | -11.6 (2) | 7.4 (9) | 7.6106 (1) |
| 0.7 kpc0.6 kpc (6) | ||||||||
References: R.A. and Dec. come from NED. (1) van den Bergh (2000A); (2) Mateo (1998); (3) Tolstoy et al. (1995); (4) Ables (1971); (5) Gallouet et al. (1975); (6) NED; (7) average of values obtained by Skillman, Kennicutt & Hodge (1989) and Lee, Grebel & Hodge (2003); (8) Skillman, Kennicutt & Hodge (1989); (9) Skillman et al. (1988); (10) Lake & Skillman (1989). Oxygen abundances reported in the Table have been computed from spectra of H ii regions.
2 Observations
IC 1613 (01h 04m 47s.8 +02∘ 07′ 04′′, J2000.0), WLM (00h 01m 58s.1 -15∘ 27′ 39′′, J2000.0), and GR 8 (12h 58m 07s.4 +14∘ 13′ 03′′, J2000.0) were observed with the WFC at the prime focus of the INT , on February 2001, October 2002, and September 2004 (see Tab.1).
The three galaxies were observed with the following filters: [O iii] (500.8/10.0 nm), H+ [N ii] (656.8/9.5), Strömgren y (550.5/24.0), (Sloan r, 624.0/135), and (Sloan g, 484.6/128). We used the Strömgren y and the filters as off-band images for the continuum subtraction of the [O iii] images, while was used as off-band for H+[N ii]. The February 2001 nights in which we observed GR 8, were photometric, whereas the October 2002 nights were not. The night of September 2004, which was photometric, was used to calibrate the observations of October 2002. Each exposure was split into several sub-exposures. The total exposure times, the number of exposures, and the seeing in each filter are listed in Tab.2.
| Target | Date | Inst. | Exp. | N. | Seeing | Filter |
| (sec) | (′′) | |||||
| Gr8 | Feb. 2001 | WFC@INT | 4800 | 4 | 1.0 | H+[N ii] |
| 3600 | 3 | 1.0 | [O iii] | |||
| 1800 | 3 | 1.0 | Str. y | |||
| 2400 | 5 | 1.0 | ||||
| 2400 | 5 | 1.0 | ||||
| IC1613 | Oct. 2002 | WFC@INT | 3600 | 3 | 1.3 | H+[N ii] |
| 4800 | 4 | 1.3 | [O iii] | |||
| 1800 | 4 | 1.4 | Str. y | |||
| 1200 | 3 | 1.3 | ||||
| 1200 | 3 | 1.7 | ||||
| Sept. 2004 | 300 | 1 | 1.1 | H+[N ii] | ||
| 300 | 1 | 1.2 | [O iii] | |||
| IC1613 | Sept. 2004 | FORS2@VLT | 200 | 2 | 0.9 | H |
| 20 | 2 | 0.9 | R | |||
| WLM | Oct. 2002 | WFC@INT | 5600 | 6 | 1.3 | H+[N ii] |
| 3200 | 6 | 1.6 | [O iii] | |||
| 1600 | 4 | 1.6 | Str. y | |||
| 4000 | 11 | 1.2 | ||||
| 1800 | 4 | 1.6 | ||||
| WLM | Oct. 2002 | FORS1@VLT | 300 | 0.8 | [O iii] | |
| 300 | 0.8 | [O iii]/6000 |
Several observations of the spectrophotometric standard stars BD+33 2642 and G191-B2B (Oke, 1990) were made each night during the February 2001 run, while Feige 110 (Oke, 1990) was observed during the September 2004 run.
We complemented our observations with images of WLM from the ESO archive 222http://archive.eso.org, taken with VLT+FORS1 on October 2002, and with observations of IC 1613 we obtained on September 2004 with VLT+FORS2 (see Tab.2).
The filters used for the FORS1 observations were [O iii] (500.5/0.8 nm) and [O iii]/6000 (510.9/0.8 nm), while for FORS2 observations H (656.3/6.1 nm) and R (655.0/165.0 nm) were employed. [O iii]/6000 and R filter images were used for continuum subtraction of the [O iii] and H images, respectively.
The VLT data taken with the [O iii] filter were calibrated using the INT observations. Scaling the diameters of INT and VLT telescopes with the exposure time, the INT images should be as deep as the VLT images. Because of the better seeing the VLT images through the [O iii] filter are however about 1 mag deeper than the corresponding [O iii] INT images.
3 Data reduction and analysis
The data reduction was done using IRAF333IRAF is distributed by the National Optical Astronomy Observatories, which is operated by the Association of Universities for Research in Astronomy, Inc. (AURA) under cooperative agreement with the National Science Foundation. First the data were processed by the ING WFC data-reduction pipeline (Irwin & Lewis, 2001): they were de-biased, flat-fielded, and linearity-corrected. Then they were corrected for geometrical distortion and subsequently all frames were aligned to the [O iii] one. The images were combined taking their median when the number of exposures was larger than three, otherwise the average was preferred. The numbers of images per filter and per field are specified in Table 2. The cosmic rays were removed with the CRREJECT algorithm, and finally the sky background was subtracted.
In order to search for emission-line objects, in GR 8 we subtracted from the [O iii] frames the properly scaled Strömgren y frames, whereas for IC 1613 and WLM we used the frames as a continuum. For each galaxy we have chosen the best quality continuum, Strömgren y or , to do the off-band subtraction.
For the VLT images of WLM, the scaled [O iii]/6000 images were subtracted from the [O iii] images. For the H+[N ii] images of all galaxies, we used the correctly scaled frames as a continuum. Finally for the H images of IC 1613 taken with VLT, R was used as a continuum. The search for unresolved emission-line objects in the continuum subtracted images was done visually at least three times per galaxy by different members of the team. In addition, we performed photometry of the unresolved sources in all the INT images with DAOPHOT (Stetson, 1997) to build H+[N ii]- vs [O iii] - diagrams, obtaining in IC 1613 the same results as the visual search, while the PN of WLM was not recovered because of its proximity to a star (see Fig.2).
The astrometric solutions were computed using the IRAF tasks CCMAP and CCTRAN and the APM POSS1 444http://www.ast.cam.ac.uk/apmcat/ and USNO A2.0 (Monet et al., 1998) catalogues. The final accuracy was 03 r.m.s..
4 Candidate planetary nebulae
We searched for PNe in our continuum-subtracted frames selecting objects which satisfy the following criteria (Magrini et al., 2000): i) they must appear in both the [O iii] and H+[N ii] images, but not in the continuum frames; and ii) they must be unresolved at the distance of IC 1613, WLM, and GR 8, on account of the typical physical size of PNe (0.1-1 pc). We found two objects in IC 1613 fulfilling these criteria, one in WLM and none in GR 8. Using both [O iii] and H+[N ii] images, the possibility that these PNe are background emission line galaxies (Méndez et al., 1993) can be excluded.
4.1 The completeness limit
The incompleteness in searching for emission-line objects results from a combination of the probability of missing an object in the emission-line image and of the probability of wrongly identifying a star in the continuum frame. To estimate the completeness limit of our search for PNe, i.e. the magnitude corresponding to a probability of non-identification of an emission-line object larger than 50% (defining the incompleteness according to Minniti & Zijlstra 1997), we added ‘artificial stars’ with various m within the range of luminosities expected for PNe (Jacoby, 1989), in both [O iii] and continuum images. We have then computed the recovery rate of such artificial objects (Magrini et al. 2002, M03). We find that in the three galaxies the recovery rate is about 50% for objects with 25.526.5 in GR 8, and 24.025.0 in IC 1613 and WLM using the INT images, while in the VLT images for objects with 25.026.0. The recovery rate is 100% for brighter objects. The difference in the incompleteness magnitude listed above comes mainly from the difference in seeing of the data used. We noted that the three candidate PNe are placed at the edges of each system and not in their more populated regions. This might be due to the identification technique, which is less effective in very crowded regions.
4.2 The expected number of PNe
The number of PNe, as well as the number of stars in any post-main-sequence phase, is proportional to the luminosity of the host galaxy, as derived from a simple (i.e. coeval and chemically homogeneous) stellar population model (Renzini & Buzzoni, 1986). Thus, a small number of PNe is expected in low-luminosity galaxies, such as the ones surveyed (see also Fig. 2 of M03). This trend is also expected when the galaxies have, in addition, a low-metallicity; since a fall in the observed number of PNe has been suggested when [Fe/H]1.0 (see Fig. 3, M03).
As described above, IC 1613, WLM, and GR 8 are low-luminosity and low-metallicity galaxies, so their expected PN number is very small. From the V-band luminosity vs. number of PNe diagram (Fig. 2 of M03), and assuming a search as deep as that made for Sex B, i.e. complete up to mag[OIII]=24.5 (M03), we infer that the expected observable number of PN for IC 1613 is 10 and 3 for WLM; while none is expected in GR8.
4.3 GR 8 and WLM
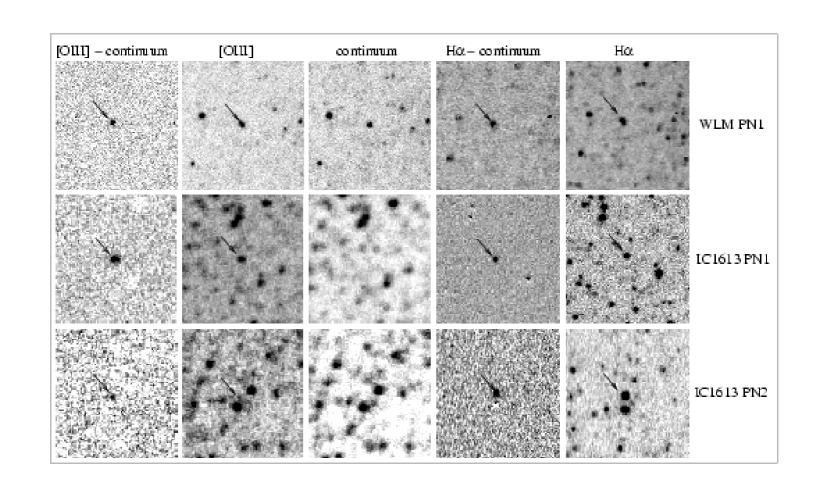
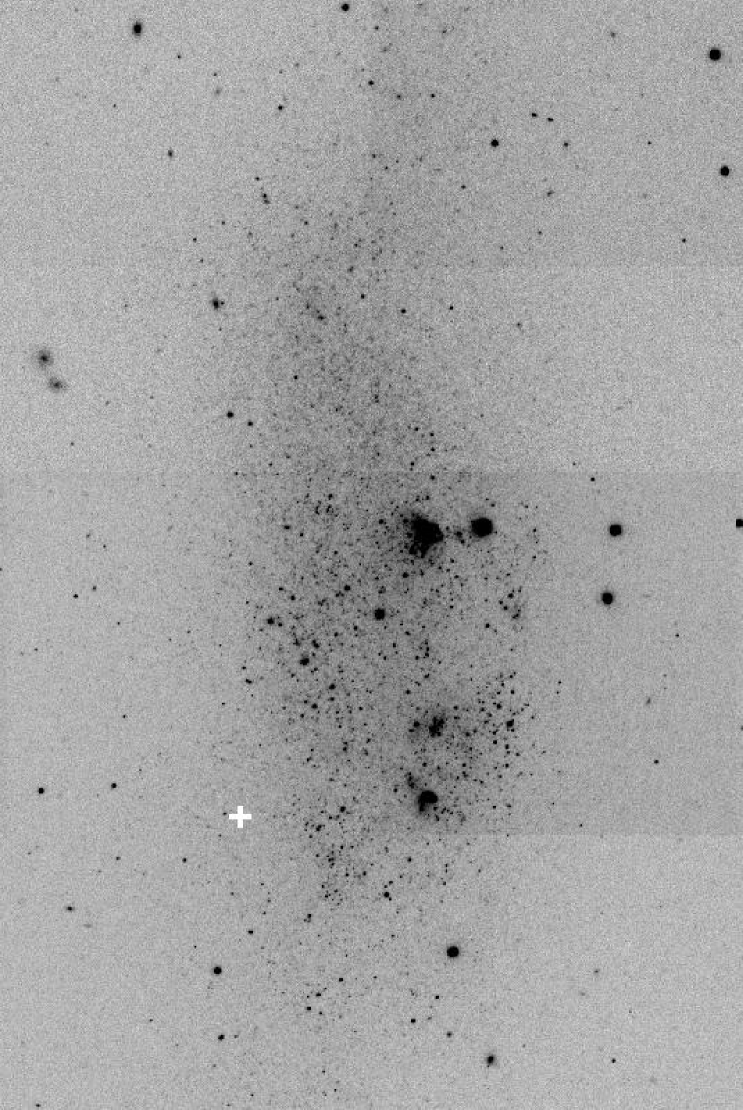
The result in GR 8 was expected from the low- luminosity of this galaxy and is in agreement with the survey of Jacoby & Lesser (1981) which did not find any PN. The result for WLM also statistically agrees with the small expected PN population size and the large distance to this galaxy. The PN found in WLM is barely detectable in LGC images, whereas it is very clear in the VLT FORS1 images (see Fig. 2). Its position and fluxes are reported in Table 3. It is marked in Figure 4. In Fig. 2 thumbnail images taken in the various filters of the PN are shown. It can be seen in the VLT [O iii] images that the PN is projected very close to a star, which is the object near to the location of the PN in the continuum image and disappears in the continuum-subtracted images. In addition, we found that the two objects previously claimed to be candidate PNe (Jacoby & Lesser, 1981) are instead stars because of their strong continuum emission in all broad band images, as already recognized by Minniti & Zijlstra (1997).
4.4 IC 1613
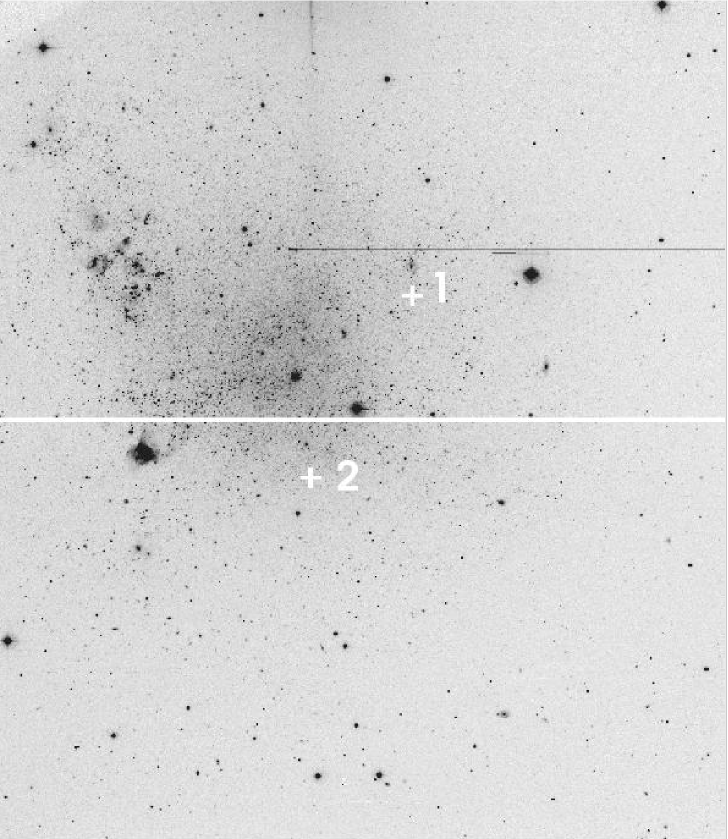
The objects belonging to IC 1613 presented in this paper are the first candidate PNe discovered in this galaxy. Lequeux, Meyssonnier & Azzopardi (1987) in an objective-prism survey for emission-line objects in this galaxy identified one candidate PN, but neither a following survey for H ii regions (Skillman, Kennicutt & Hodge, 1989) nor this work could confirm this object. The two candidates lie inside the optical size of the galaxy (16′20′, according to Ables 1971). The position and fluxes of the PN candidates are listed in Table 3 and marked in Figure 3. In Fig. 2 thumbnail images of these PNe taken in the various filters are shown.
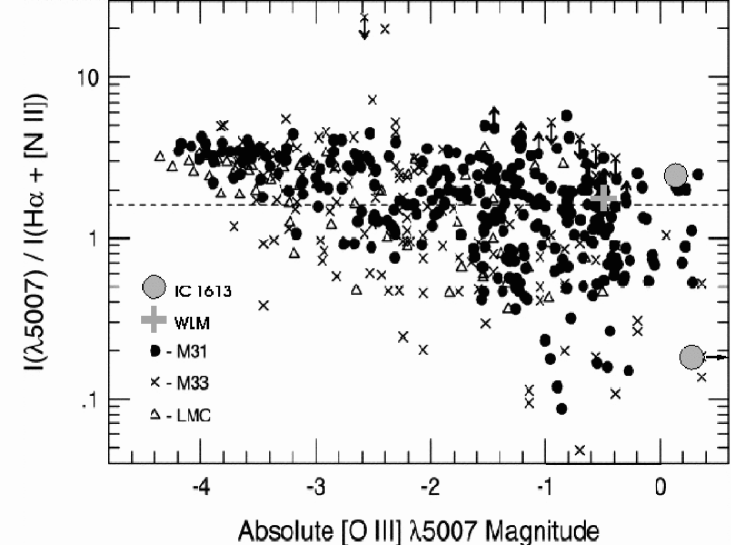
A criterion which is generally considered when selecting extragalactic PN candidates is the ratio between the [O iii] and the H + [N ii] fluxes, which allows a statistical discrimination with unresolved H ii regions. The criterion adopted by Ciardullo et al. (2002) is R=I([O iii])/I(H+ [N ii]) 1.6 for PNe. The reason is that central stars of PNe are generally hotter than the OB stars that excite H ii regions, and this produces in PNe an [O iii] flux higher than the H + [N ii] flux. The value 1.6 is an empirical value derived with a large sample of extragalactic PNe. The ratio R is a function of the absolute magnitude of the PN, as we can see in Fig. 1, reproduced from the paper by Ciardullo et al. (2002).
For low luminosity PNe, R ranges from 1.5-2 down to very low values of 0.1 or less. As the object designated as PN2 in IC 1613 has an extremely low absolute magnitude we can accept it as a PN candidate even with its low R ratio of 0.2, as can be seen from Fig. 1. In addition, both PN 1 and PN 2 are far from the main star formation regions, and this reduces the possibility of contamination with compact H ii regions (Ciardullo et al., 2002). Furthermore the value of R might be effected by the extinction on the observed line ratios. The extinction can arise within the Galaxy, along the line of sight to the LG galaxy and intrinsic to the galaxy itself. Any extinction would depress [O iii] relative to H and consequently decrease the value of R. For all the galaxies considered in this paper, the Galactic latitudes are very high, but localised extinction may still occur. Regarding the galaxies themselves, none are gas/dust rich and their internal extinction is very low.
In spite of the 10 PNe expected, we detected only two candidate PNe in this galaxy, which may be a significant difference. Anyhow we can never be complete for objects such as PNe - for instance in our Galaxy we now know more than 2500 PNe, but 10 000-30 000 are expected (Zijlstra & Pottasch, 1991). With reference to Fig. 2 by M03, the relatively large number of PNe found in Sextans B is an exception in the context of LG low-luminosity galaxies. In fact, we found that Sextans A, WLM, IC 1613 and IC 10 have PNe populations rather smaller than expected. M03 discussed the particular case of the starburst galaxy IC 10 whose central area is covered by large H ii regions thus producing a loss in observable PNe because of the superposition of the large H ii regions. For low-metallicity galaxies (like Sextans A, WLM, and IC 1613), M03 suggested that the small number of observed candidate PNe might be explained by the low metal content of the host galaxies, which would imply a reduced PN formation. Any firm conclusion in this sense is prevented by the small number statistics; deeper surveys would be needed to improve this situation.
4.5 The absolute magnitude of the PNe
Another aspect to be noted is the relative faintness of the discovered PNe. The absolute magnitude of the cutoff of the PNe [O iii] luminosity function (PNLF) in a galaxy with a large population of PNe is considered constant in large galaxies, with a value M=4.47 (Ciardullo et al., 2002). For dwarf galaxies, the cut-off magnitude decreases to fainter limits as a function of the galaxy mass and population size (Méndez et al., 1993). In fact, the brightest candidate PNe of IC 1613 and WLM are much fainter than M. Considering the distance modulus of 24.3 and E(B-V)0.03 for IC 1613 (vdB00), we obtain an absolute magnitude for its brightest PN of mag. For WLM, where the distance modulus is 23.8 and E(B-V)0.02 (vdB00), we found the absolute magnitude of the brightest PN to be approximately . As said above, this is likely due to the small population size of PNe in these dwarf galaxies, for which the magnitude of the cutoff, M, is shifted towards fainter magnitudes (Méndez et al., 1993).
| Identification | R.A. (2000.0) Dec. | m | |||
|---|---|---|---|---|---|
| WLM PN1 | 0 02 03.33 | -15 29 30.4 | 5.6 | 3.3 | 24.4 |
| IC 1613 PN1 | 1 04 32.28 | +02 08 43.5 | 5.2 | 2.3 | 24.5 |
| IC 1613 PN2 | 1 04 43.72 | +02 03 40.7 | 1.5 | 6.7 | 25.8 |
5 Intermediate-age star formation history
Given the mass range covered by PN progenitors, assumed to be classicaly between 0.8M⊙ (or a bit higher, 1 M⊙, cf. Phillips 2001) and 8M⊙, the stellar population from which PNe derive is formed at intermediate ages (roughly 1 to 8 Gyr ago) during the history of a galaxy. One can evaluate the total mass of such a stellar population using the theoretical relation between the total luminosity of the population of PNe progenitors and the PNe number, obtained under the hypothesis of coeval, chemically homogeneous stars (Renzini & Buzzoni, 1986). The total luminosity of the population of PNe progenitors, , is related to the number of PNe, , to their lifetime, , and to the so-called evolutionary flux, . The number of stars with initial mass per unit luminosity leaving the Main Sequence each year is then given by the expression
| (1) |
Thus, counting planetary nebulae and estimating the mean mass of the PNe progenitors we have a measure of the total mass of the intermediate-age stellar population, or at least a lower limit to it, when the PNe survey is not complete. Using a lifetime of 10 000 yrs for the PN phase, a mean specific evolutionary flux of 2 yr-1 (Renzini & Buzzoni 1986, Méndez et al. 1993, Buzzoni & Arnaboldi 2004), a mean progenitor mass of 1.5 M⊙ (computed using the Initial Mass Function by Scalo (1998), corresponding to a luminosity of 5), the lower limit to the intermediate-age stellar mass in the LG galaxies can be estimated. The intermediate-age stellar mass is proportional to the number of PNe, and with the approximations described above, we found that about 2106 M⊙ were formed for each PN observed.
We used all the candidate PNe discovered in the Local Group by several authors (see references below) with the on-band/off-band or similar techniques, and the criteria described in Sect. 4, considered as bona fide PNe for the following reasons. The first is that these criteria give a good confidence on the PN nature of the candidate. For instance, a follow-up spectroscopic study of PN candidates detected in M 33 by Magrini et al. (2000) confirmed more than 70% as PNe (Magrini et al., 2003A), even if the criterion of R1.6 was not used. Among the remaining 30% objects, some indetermination remains between low-excitation PNe and compact H ii regions, which have similar spectroscopic and photometric features. The second reason is that it is impossible to study the statistical properties of PN population in the LG if considering only spectroscopically confirmed PNe since spectroscopic observations have been obtained for only 10% of the total number of LG PNe. In addition, once obtained, spectroscopy cannot provide complete confidence in the determination of the nature of the object, in many cases because of the faintness of the objects (Jacoby, 2005).
In Figure 5, we show the result, plotting the total stellar mass of the galaxies (values from vdB00) vs. the observed number of PNe (left vertical axis). The latter is proportional to the the mass of the intermediate-age stellar population (right vertical axis) with a constant of proportionality of 2106. Errors amount to 30% in the estimate of the total stellar mass of galaxies, and to 50% in the estimate of the intermediate-age mass for the galaxies where we obtained the number of PNe within 4 mag from the cutoff of the PNLF (upper panel). For the galaxies where we have only the number of observed PNe (lower panel), only a lower limit to the intermediate-age mass can be given. The references on the number of PNe in the Local Group and also on their spectroscopic confirmation, if any, are: M 31 2764 PNe identified with the Planetary Nebulae Spectrograph by Merrett et al. (2005), 30 confirmed with spectroscopy by Jacoby & Ciardullo (1999), Stasinska et al. (1998); MW 2400 (1143 + 242 true and probable PNe in Acker et al. 1992, and 1000 in Parker et al. 2003); M 33 152 PNe identified by Ciardullo et al. (2004) (30 confirmed by Magrini et al. (2003A)); LMC 1000 estimated, 350 discovered by Jacoby (2005) and 700 newly discovered by Reid & Parker (2005) ( 200 confirmed by Leisy & Dennefeld 2005B); SMC 132 estimated and 101 discovered Jacoby (2005) ( 70 confirmed by Leisy & Dennefeld 2005B); M32 30 Ciardullo et al. (1989) (14 confirmed by Richer & McCall 2002); NGC 205 35 Corradi et al. (2005) (13 confirmed by Richer & McCall 2002); IC 10 16 Magrini et al. (2003B); NGC 6822 17 Leisy et al. (2005) (6 confirmed, Leisy, private communication); NGC 185 5 Corradi et al. (2005) (5 confirmed by Richer & McCall 2002); NGC 147 9 Corradi et al. (2005); Sagittarius 3 Zijlstra (2005) (confirmed); Fornax 1 Danziger et al. (1978) (confirmed); Pegasus 1 Jacoby & Lesser (1981); Leo A 1 Magrini et al. (2003B) (confirmed, Leisy, private communication); NGC 3109 18 Prada et al. (2005); Sextans B 5 Magrini et al. (2002) (confirmed by Magrini et al. 2005); Sextans A 1 Magrini et al. (2003B) (confirmed by Magrini et al. 2005).
Despite the large errors, a linear trend can be traced (the continuous line in the upper panel of Figure 5), where the total stellar mass of the galaxies is plotted versus the number of PNe, for all cases in which we could estimate their population size corrected to a completeness limit of 4 magnitudes below the PNLF cutoff. This number is extrapolated from the empirical formula of the luminosity function (Jacoby, 1989) for the LG galaxies where the completeness limit in the search for PNe was known, and where PNe above this limit were discovered. From this plot we can infer which galaxies had relatively strong star formation during the past 1–8 Gyrs, i.e. in the period corresponding to the formation of the PNe progenitors. In particular, we can compare the location of dwarf galaxies in Figure 5 with their SFHs reviewed by Mateo (1998). We find that the galaxies which show little star formation during the past 1–8 Gyrs, i.e. the galaxies with a relative star-formation rate 0.2 during that peroid of time (cf. Figure 8 of Mateo 1998), generally lie in the diagram below the continuous line (filled squares). On the contrary, those with strong intermediate-age star formation, namely SFR0.2, are located above the least squares fit line (filled circles).We note that galaxies which had a conspicuous star formation during the past 1–8 Gyrs lie above the continuous line, with the only exception being NGC 6822. It has a smaller number of PNe than expected for its mass. It might be due to the determination of its stellar mass which is particularly difficult because of the large extent of its halo (Weldrake, de Blok, & Walter, 2003). Another aspect which might be suggested from Figure 5 is that all systems associated with M 31 (M 32, NGC 205, NGC 147, IC 10, with exception of NGC 185) and with the MW (SMC, LMC) have enhanced ’recent’ star formation, while several isolated systems have lower rates (Sextans A, Sextans B, Leo A, NGC 6822), suggesting that star formation might be enhanced by interaction with the giant galaxies.
In the lower panel, the total stellar mass of the galaxies is plotted versus the observed number of candidate PNe. Again a linear trend can be traced, but we note that only a lower limit to the intermediate-age mass can be estimated from this plot because the number of PNe might be not complete. The location in this diagram of IC 1613 and WLM, is in agreement with what we know about their star formation histories, showing a higher star formation during intermediate ages in IC 1613 than in WLM.
PNe are therefore confirmed to be useful evolutionary age tracers of the intermediate-age population. The presence of PNe is enough evidence for an intermediate-age population (Aparicio & Gallart, 1994), and, in addition, the relationship of their number to the host galaxy mass gives information on the relative star formation history between different galaxies, where the same completeness in the search of PNe has been reached. These results agree with the those obtained by accurate SFH analysis (Mateo, 1998).


6 Summary and Conclusions
In this paper we presented the search for PNe in three dwarf irregular galaxies belonging to the Local Group, or close to it: IC 1613, WLM, and GR 8. We discovered two new candidate PNe in IC 1613, one in WLM, and none in GR 8. Their number and their absolute magnitude were analyzed as a function of the SFH of the hosting galaxies. The number of PNe of these galaxies together with the number of PNe in the other LG galaxies are used to estimate the mass of intermediate-age population of each galaxy. This is compared with the SFR of the LG dwarf galaxies from 1 to 8 Gry ago, finding that the number of PNe agrees with the results obtained by accurate SFH analysis and can therefore be used to constrain synthetic models of SFHs.
Acknowledgments
We are very grateful to the anonymous referee whose comments resulted in a significant improvement of the work reported in this paper.
The INT data have been made publically available through the Local Group Census programme (PI: N. A. Walton) of the Isaac Newton Group’s Wide Field Camera Survey Programme. This research has made use of the NASA/IPAC Extragalactic Database (NED) which is operated by the Jet Propulsion Laboratory, California Institute of Technology, under contract with the National Aeronautics and Space Administration, the APM Sky Catalogue and USNO-A2.0 Sky Catalogues, and the ESO Online Digitized Sky Survey. DM is supported by FONDAP Center for Astrophysics 15010003.
References
- Ables (1971) Ables H.D., 1971, Publ. U. S. Naval Obs., Second Series, 20, Part. 4
- Acker et al. (1992) Acker A., Ochsenbein F., Stenholm B., Tylenda R., Marcout J., Schohn C., 1992, 1996, Strasbourg–ESO catalogue of Galactic planetary nebulae, ESO
- Aparicio (2001) Aparicio A., 2001, A&SS, 276, 545
- Aparicio & Gallart (1994) Aparicio A., Gallart C., 1994, in The Local Group: Comparative and Global Properties, ESO Conference and Workshop Proceedings, Eds Andrew Layden, R. Chris Smith, and Jesper Storm, p.115
- Aparicio & Gallart (2004) Aparicio A., Gallart C., 2004, AJ, 128, 1465
- Buzzoni & Arnaboldi (2004) Buzzoni A., Arnaboldi, M., 2004, to appear in the Proceeding of ESO-Workshop ”Planetary Nebulae beyond the Milky Way ”, Garching, May 19-21, 2004.
- Ciardullo et al. (1989) Ciardullo R., Jacoby G.H., Ford H.C., Neill J.D. 1989, ApJ, 339, 53
- Ciardullo et al. (2002) Ciardullo R., Feldmeier J.J., Jacoby G.H., Kuzio de Naray R., Laychak M.B., Durrell P.R., 2002, ApJ, 577, 31
- Ciardullo et al. (2004) Ciardullo R., Durrell P. R., Laychak M. B., Herrmann K. A., Moody K., Jacoby G. H., Feldmeier J. J., 2004, ApJ, 614, 167
- Corradi & Magrini (2005) Corradi R.L.M., Magrini L., 2005, to appear in the Proceedings of the ESO-Workshop ”Planetary Nebulae beyond the Milky Way”, Garching, May 19-21, 2004.
- Corradi et al. (2005) Corradi R.L.M., Magrini L., Greimel R., Irwin M., Leisy P., Lennon D.J., Mampaso A., Perinotto M., Pollacco D.L., Walsh J.R., Walton N.A., Zijlstra A.A., 2005, A&A in press
- Danziger et al. (1978) Danziger I.J., Webster B.L., Dopita M.A., Hawarden T.G, 1978, ApJ, 220, 458
- Dohm-Palmer, Skillman, & Gallagher (1998) Dohm-Palmer R.C., Skillman E.D., Gallagher J., 1998, AJ, 116, 1227
- Dolphin (2000) Dolphin A. E., 2000, ApJ, 531, 804
- Dolphin et al. (2001) Dolphin A. E., Saha A., Skillman E.D., Tolstoy E., Cole A.A., Dohm-Palmer R.C., Gallagher J.S., Mateo M., Hoessel J.G., 2001, ApJ, 550, 554
- Freedman (1988) Freedman W. L., 1988, AJ, 96, 1248
- Gallouet et al. (1975) Gallouet, L., Heidmann, N., Dampierre, F., 1975 A&AS, 19, 1
- Hodge (1974) Hodge P., 1974, ApJS, 27, 113
- Hodge & Miller (1995) Hodge P., Miller B.W., 1995, ApJ, 451, 176
- Hodge, Lee & Kennicutt (1989) Hodge P.W., Lee M.G., Kennicutt R. C. Jr., 1989, PASP, 101, 640
- Hodge et al. (1991) Hodge P.W., Smith T.R., Eskridge P.B., MacGillivray H.T., Beard S. M., 1991, ApJ, 369, 372
- Irwin & Lewis (2001) Irwin M., Lewis J., 2001, New AR 45, Issue 1-2, 105
- Jacoby (1989) Jacoby G. H., 1989, ApJ, 339, 39
- Jacoby (2005) Jacoby G. H., 2005, to appear in the Proceedings of the ESO-Workshop ”Planetary Nebulae beyond the Milky Way”, Garching, May 19-21, 2004.
- Jacoby & Ciardullo (1999) Jacoby G. H., Ciardullo R., 1999, ApJ, 515, 169
- Jacoby & Lesser (1981) Jacoby G. H., Lesser M. P., 1981, AJ 86, 185
- Kunth & Östlin (2000) Kunth D., Östlin G., 2000, ARA&A, 10, 1
- Lake & Skillman (1989) Lake G., Skillman E. D., 1989, AJ, 98, 1274L
- Lee, Grebel & Hodge (2003) Lee H., Grebel E.K., Hodge P.W., 2003, A&A, 401, 141
- Leisy et al. (2005) Leisy P., Corradi R.L.M., Magrini L., Greimel R., Mampaso A., Dennefeld M., 2004, A&A accepted
- Leisy & Dennefeld (2005B) Leisy P.& Dennefeld M., 2005, in preparation
- Lequeux, Meyssonnier & Azzopardi (1987) Lequeux J., Meyssonnier N., Azzopardi M., 1987, A&AS, 67, 169
- Lequeux et al. (1979) Lequeux J., Peimbert M., Rayo J.F., Serrano A., Torres-Peimbert S., 1979, A&A, 80, 155
- Lundmark (1923) Lundmark K., 1923, PASP, 35, 95
- Madau, Pozzetti & Dickinson (1998) Madau P., Pozzetti L., Dickinson, M., 1998, AJ, 498, 106
- Magrini et al. (2000) Magrini L., Corradi R.L.M., Mampaso A., Perinotto M., 2000, A&A 355, 713
- Magrini et al. (2003A) Magrini L., Perinotto M., Corradi R. L. M., Mampaso A., 2003A, A&A, 400, 511
- Magrini et al. (2003B) Magrini L., Corradi R.L.M., Greimel R., Leisy P., Lennon D.J., Mampaso A., Perinotto M., Pollacco D.L., Walsh J.R., Walton N.A., Zijlstra A.A., 2003B, A&A, 407, 51
- Magrini et al. (2002) Magrini L., Corradi R.L.M., Walton N.A., Zijlstra A.A., Pollacco D.L., Walsh J.R., Perinotto M., Lennon D.J., Greimel R., 2002, A&A, 386, 869
- Magrini et al. (2003) Magrini L., Corradi R.L.M., Greimel R., Leisy P., Lennon D.J., Mampaso A., Perinotto M., Pollacco D.L., Walsh J.R., Walton N.A., Zijlstra A.A. (M03) 2003, A&A, 407, 51
- Magrini et al. (2005) Magrini L., Leisy P., Corradi R.L.M., Perinotto M., Mampaso A., Vílchez J., 2005, A&A submitted
- Mateo (1998) Mateo M.L., 1998, ARA&A, 36, 435
- McGaugh & Bothun (1994) McGaugh S. S., Bothun G. D., 1994, AJ, 107, 530
- Melotte (1926) Melotte P.J., 1926, MNRAS, 86, 636
- Méndez et al. (1993) Méndez R.H., Kudritzki R.P., Ciardullo R., Jacoby G.H., 1993, A&A 275, 534
- Merrett et al. (2005) Merrett H. et al., 2005, to appear in the Proceedings of the ESO-Workshop ”Planetary Nebulae beyond the Milky Way”, Garching, May 19-21, 2004.
- Miller (1996) Miller B.W., 1996, AJ, 112, 991
- Minniti & Zijlstra (1996) Minniti, D., Zijlstra, A.A., 1996, ApJ, 467, L13
- Minniti & Zijlstra (1997) Minniti D., Zijlstra A.A., 1997, AJ, 114, 147
- Moles, Aparicio & Masegosa (1990) Moles M., Aparicio A., Masegosa J., 1990, A&A, 228, 310
- Monet et al. (1998) Monet, D., Bird, A., Canzian, B., et al., 1998, USNO-A2.0, (U.S. Naval Observatory, Washington DC)
- Nagashima & Yoshii (2004) Nagashima M., Yoshii Y., 2004, ApJ, 610, 23
- Oke (1990) Oke J.B., 1990, AJ, 99, 1621
- Parker et al. (2003) Parker Q.A., Hartley M., Russeil D., Acker A., Ochsenbein F., Morgan D.H., Beaulieu S., Morris R., Phillipps S., Cohen M. 2003, IAU Symp. 209, S. Kwok, M. Dopita, & R. Sutherland eds, ASP/IAU, p.41
- Peimbert & Torres-Peimbert (1974) Peimbert M., Torres-Peimbert S., 1974, ApJ, 193, 327
- Phillips (2001) Phillips S., 2001, MNRAS, 326, 1041
- Phillips et al. (1998) Phillips S., Parker Q. A., Schwartzenberg J. M., Jones J.B., 1998, ApJ, 493, L59
- Prada et al. (2005) Prada, F., et al., 2005, in preparation
- Reaves (1956) Reaves G., 1956, AJ, 61, 69
- Reid & Parker (2005) Reid W. A., Parker Q. A., 2005, to appear in the Proceedings of the ESO-Workshop ”Planetary Nebulae beyond the Milky Way”, Garching, May 19-21, 2004.
- Renzini (1995) Renzini A., 1995, in Stellar Populations, ed. P. C. van der Kruit & G. Gilmore (Dordrecht: Kluwer), 325
- Renzini & Buzzoni (1986) Renzini A., Buzzoni A., 1986, in Spectral Evolution of Galaxies, eds. Chiosi C. and Renzini A., Reidel, Ap. Space Sci. Lib., Vol. 122, p.195
- Richer & McCall (1995) Richer M. G., McCall M. L., 1995, ApJ, 445, 642
- Richer & McCall (2002) Richer M. G., McCall M. L., 2002, RMxAC, 12, 173
- Scalo (1998) Scalo J.M., 1998, in The Stellar Initial Mass Function, ed, G. Gilmore, & D. Howell (San Francisco:ASP), ASP Conf. Ser., 142, 201
- Skillman, Kennicutt & Hodge (1989) Skillman E.D., Kennicutt R.C., Hodge P.W., 1989, ApJ, 347, 875
- Skillman et al. (1988) Skillman E.D., Melnick J., Terlevich R., Moles M., 1988, A&A, 196, 31
- Skillman et al. (2003) Skillman E.D., Tolstoy E., Cole A.A., Dolphin A.E., Saha A., Gallagher J.S., Dohm-Palmer R.C., Mateo M., 2003, ApJ, 596, 253
- Stasinska et al. (1998) Stasinska G., Richer M. G., McCall M. L., 1998, A&A, 336, 667
- Stetson (1997) Stetson P. B., 1987, PASP, 99, 191
- Tolstoy et al. (1995) Tolstoy E., Saha A., Hoessel J.G., Danielson G.E., 1995, AJ, 109, 579
- van den Bergh (1959) van den Bergh S., 1959, Publications of the David Dunlap Observatory, University of Toronto, v. 2, no. 5, Toronto, Canada : University of Toronto Press p. 147
- van den Bergh (1966) van den Bergh S., 1966, Observatory, 115, 103
- van den Bergh (2000A) van den Bergh S. (vdB00), 2000A, in The Galaxies of the Local Group, Cambridge University Press
- van den Bergh (2000B) van den Bergh S., 2000B, PASP, 112, 932
- Weldrake, de Blok, & Walter (2003) Weldrake D.T.F., de Blok W.J.G., Walter F., 2003, MNRAS, 340, 12
- Wolf (1906) Wolf M., 1906, MNRAS, 67, 91
- Wolf (1923) Wolf M., 1923, Astron. Nachr., 217, 476
- Zijlstra (2005) Zijlstra, A.A., et al., 2005, to appear in the Proceeding of ESO-Workshop ”Planetary Nebulae beyond the Milky Way ”, Garching, May 19-21, 2004.
- Zijlstra & Pottasch (1991) Zijlstra A. A., Pottasch S. R., 1991, A&A, 243, 478