The UV, Optical, and IR Properties of SDSS Sources
Detected by GALEX
Abstract
We discuss the ultraviolet, optical, and infrared properties of the Sloan Digital Sky Survey (SDSS) sources detected by the Galaxy Evolution Explorer (GALEX) as part of its All–sky Imaging Survey (AIS) Early Release Observations (ERO). Virtually all (%) of the GALEX sources in the overlap region are detected by SDSS; those without an SDSS counterpart within our search radius are mostly unflagged GALEX artifacts. GALEX sources represent of all SDSS sources within these fields and about half are optically unresolved. Most unresolved GALEX/SDSS sources are bright () blue turn–off thick disk stars and are typically detected only in the GALEX near–UV band. The remaining unresolved sources include low–redshift quasars (), white dwarfs, and white dwarf/M dwarf pairs, and these dominate the optically unresolved sources detected in both GALEX bands.
Almost all the resolved SDSS sources detected by GALEX are fainter than the SDSS “main” spectroscopic limit (conversely, of the SDSS galaxies in the “main” spectroscopic sample, about % are detected in at least one GALEX band). These sources have colors consistent with those of blue (spiral) galaxies (), and most are detected in both GALEX bands. Measurements of their UV colors allow much more accurate and robust estimates of star–formation history than are possible using only SDSS data. Indeed, galaxies with the most recent ( Myr) star formation can be robustly selected from the GALEX data by requiring that they be brighter in the far–ultraviolet than in the near–ultraviolet band. However, older starburst galaxies have UV colors similar to AGN, and thus cannot be selected unambiguously on the basis of GALEX fluxes alone. Additional information, such as spatially resolved far–UV emission, optical morphology, or X–ray and radio data, is needed before the blue GALEX color can be unambiguously interpreted as a sign of recent star formation.
With the aid of Two Micron All Sky Survey (2MASS) data, we construct and discuss median 10 band UV–optical–infrared spectral energy distributions for turn–off stars, hot white dwarfs, low–redshift quasars, and spiral and elliptical galaxies. We point out the high degree of correlation between the UV color and the contribution of the UV flux to the UV–optical–infrared flux of galaxies detected by GALEX; for example, this correlation can be used to predict the SDSS band measurement, using only two GALEX fluxes, with a scatter of only 0.7 magnitudes.
1 Introduction
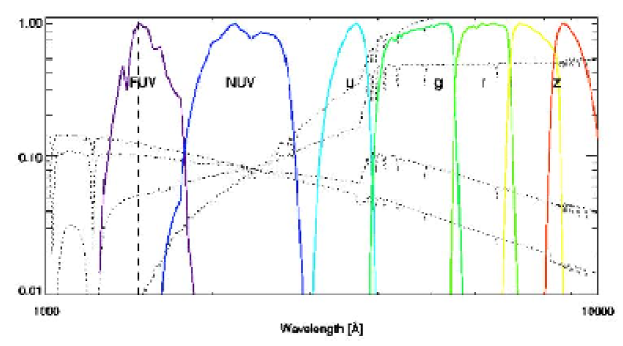
Launched in April 2003, the Galaxy Evolution Explorer (GALEX) made its first public data release (the Early Release Observations, or ERO) at the end of 2003. Included in the ERO are fields from several different GALEX surveys that overlap with the Sloan Digital Sky Survey (SDSS; York et al. 2000), allowing one to study sources over nearly the entire to range (see Fig. 1). Here we report the results of matching GALEX All–sky Imaging Survey (AIS; s) observations with SDSS data in the overlapping fields. There are other, deeper GALEX observations of SDSS fields in the ERO, but AIS is the GALEX survey that will eventually provide the largest sky coverage111The Medium Imaging Survey is magnitudes deeper, and will cover about 1000 deg2 of sky, overlapping the SDSS footprint.. It is therefore the most appropriate GALEX survey for discussing the bulk properties of objects in the overlapping GALEX/SDSS region.
Here we describe the optical properties of matched GALEX/SDSS sources in three AIS ERO fields, covering deg2 of sky, which overlap the SDSS DR1 footprint. The first full GALEX public data release should contain about deg2 of overlap with the SDSS (Seibert et al. 2005a) and therefore allow the construction of a much larger sample of matched objects than discussed in this paper. However, even the fairly small sample discussed here (about 3000 matched sources) is sufficient to highlight some of the challenges in producing a good sample of GALEX/SDSS sources, and to characterize the optical SDSS properties of the matched sources—as well as to produce representative spectral energy distributions (SEDs) for stars, quasars, and galaxies detected by these two surveys and by the Two Micron All Sky Survey (2MASS).
In the next section we briefly describe the three surveys we used in this work. Section 3 describes the process of matching GALEX/SDSS objects and of producing a clean photometric sample of matched objects. It also includes a discussion of GALEX objects without SDSS counterparts, as well as an analysis of the repeatability of GALEX measurements. Section 4 presents an analysis of the optical properties of unresolved and resolved GALEX/SDSS sources, a discussion of the SEDs of a number of interesting classes of sources, and an estimate of the UV contribution to the UV–optical–infrared flux of galaxies. We discuss the significance of our results in Section 5, and in particular compare them to those in the recently published Yi et al. (2005) and Rich et al. (2005) studies of star formation in early–type galaxies detected by GALEX.
2 Observations
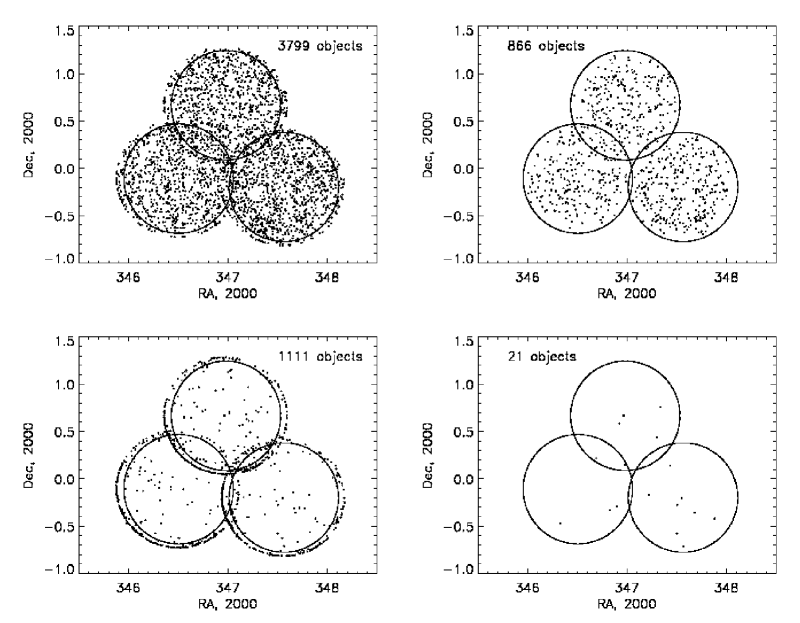
GALEX will eventually map the entire sky at wavelengths between and in two bands: the near ultraviolet (NUV; ) and the far ultraviolet (FUV; ). When comparing positions to the Tycho–2 catalog (Hg et al. 2000), of GALEX–detected stars are found within in the NUV and in the FUV of their expected positions (Morrissey et al. 2005). GALEX’s m telescope and field of view will also be used to make deep observations ( tens of kiloseconds) of individual fields of interest, such as the Lockman Hole and the Chandra Deep Field–South. The mission’s primary science goals are to observe star–forming galaxies and to track galaxy evolution (Martin et al. 2005). The GALEX Early Release Observations (ERO) include 10 fields, three of which are AIS observations that overlap the Sloan Digital Sky Survey (SDSS) footprint. The AIS fields were observed for 113, 111, and 113 seconds respectively, and each covers deg2 (the fields overlap slightly, however, so that the total area on the sky is smaller; see Fig. 2). While for most classes of objects in SDSS the SEDs drop off quickly in the UV, the ERO fields are observed to (NUV) and (FUV)222We use and to denote GALEX AB magnitudes in the far– and near–ultraviolet bands, respectively., deep enough that we expect to find GALEX counterparts for a large number of SDSS sources.
The Sloan Digital Sky Survey is currently mapping one quarter of the sky at optical wavelengths. SDSS uses a dedicated 2.5 m telescope at the Apache Point Observatory, New Mexico, to produce homogeneous five color u, g, r, i, z CCD images to a depth of (Fukugita et al. 1996; Gunn et al. 1998; Smith et al. 2002; Hogg et al. 2002) accurate to magnitudes (both absolute calibration, and root–mean–square scatter for sources not limited by photon statistics; Ivezić et al. 2004). Astrometric positions are accurate to better than per coordinate (rms) for sources with (Pier et al. 2003), and the morphological information from the images allows reliable star/galaxy separation to (Lupton et al. 2002). The survey’s coverage of deg2 in the North Galactic Cap and of deg2 in the Southern Galactic Hemisphere will result in photometric measurements for over stars and a similar number of galaxies. Additionally, SDSS will obtain spectra for over objects, including galaxies and quasars. The third public Data Release (DR3) includes imaging data for deg2 of sky, and catalogs objects (Abazajian et al. 2005).
Finally, in constructing UV–optical–infrared SEDs for our UV–selected sample of objects, we also utilize data from the Two Micron All Sky Survey (2MASS) survey. 2MASS used two 1.3 m telescopes to survey the entire sky in near–infrared light333See http://www.ipac.caltech.edu/2mass.. Each telescope’s camera was equipped with three arrays of HgCdTe detectors with pixels and observed simultaneously in the (1.25 ), (1.65 ), and (2.17 ) bands. The detectors were sensitive to point sources brighter than about 1 mJy at the level, corresponding to limiting (Vega–based) magnitudes of , , and , respectively. Point source photometry is repeatable to better than precision at this level, and the astrometric uncertainty for these sources is less than . The 2MASS catalogs contain positional and photometric information for point sources and extended sources. Finlator et al. (2000) and Ivezić et al. (2001) describe the properties of sources detected by both SDSS and 2MASS (in particular, Fig. 3 in Finlator et al. compares the SDSS and 2MASS bandpasses, and is analogous to Fig. 1 in this paper).
3 Matching GALEX and SDSS
3.1 Positional Offsets
The astrometry for both the GALEX and SDSS surveys is sufficiently accurate that the typical astrometric errors are much smaller than the average source separation; this significantly simplifies the matching algorithm. We began by correlating the GALEX source positions with positions in the SDSS catalog, taking a matching radius. This corresponds to the full–width–at–half–maximum angular resolution for the NUV channel (Morrissey et al. 2005). Fig. 2 illustrates the results of this matching: of the UV–detected objects in the three GALEX fields, we find optical counterparts for () sources, of which () are saturated in the optical. About 5% of matched GALEX sources have more than one SDSS counterpart444Note that this fraction of multiply matched GALEX sources is somewhat lower than that reported by Seibert et al. (2005a).. This is consistent with random matching, based on the mean separation between two SDSS sources of . In these cases, we simply take the closest match for evaluating sample completeness, and limit the matching radius to when studying colors of matched sources in §4 (for this matching radius, less than 1% of GALEX matches have more than one SDSS counterpart).
A closer look at the matches—and especially the non–matches, those GALEX objects without an SDSS counterpart—shows clear structure in the pattern of matching (see the lower left panel in Fig. 2). Objects along the edges of the GALEX field of view are far more likely not to have an optical counterpart. This is due mainly to distortions in the GALEX fields and to problems in the flat–fielding along the field edges; as a result, many spurious sources are detected by the GALEX data analysis pipeline (T. Wyder 2004, private communication). To avoid this contamination, we select an inclusion distance from the GALEX field center of R , which defines the size of the effective area of each of the three fields overlapping with SDSS. We then have GALEX sources with SDSS counterparts, and only without a match within , or and , respectively, of the total number of GALEX sources within the area defined above.
Further cuts are then applied to the data to obtain the highest quality sample of GALEX/SDSS sources. We determined the GALEX faint completeness limit from a histogram of the magnitudes of GALEX sources with an SDSS counterpart and within of their respective field centers (Fig. 3). GALEX sources begin to drop out at magnitudes; we select as a conservative completeness limit for our sample. For the optical counterparts, we require . Furthermore, we apply a number of conditions based on data processing flags in the two data sets. We require that the optical counterpart be a unique detection and not saturated in SDSS (for details see Stoughton et al. 2002). We also require that the GALEX artifact flag be set to zero for both the near–UV and far–UV detections. Bright star halos appear to be one of the major sources of artifacts in both the NUV and FUV GALEX data sets, while other problems (dichroic ghosts or detector hot spots, for example) tend to affect preferentially one set of detections or the other555See for a full description of GALEX image artifacts..
The sky distribution of the resulting sample of matched, “clean” sources is shown in Fig. 2 (top right panel). Table 1 gives the median astrometric offsets and standard deviations for each of the three GALEX fields, and for the overall list of matched sources; for comparison, the offsets obtained during all three of the matching procedures described above are included (i.e., for all matched GALEX/SDSS sources, for matches with R , and for clean matches). Fig. 4 illustrates these results.
We note that eliminating matches based on the GALEX NUV/FUV flags strongly impacts the spatial distribution of acceptable matches, so that there now seems to be a dearth of clean sources near the edges of the R disks. This suggests that perhaps the GALEX flags are in fact too conservative, and that we are losing good matches in these regions.
3.2 Unmatched GALEX Sources
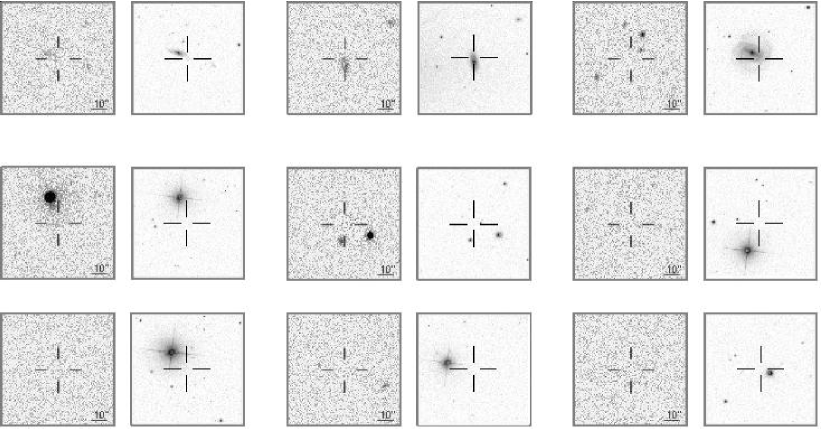
Interestingly, it appears that a handful (21) of GALEX sources have no SDSS counterparts within , even when highly restrictive quality cuts are applied. These sources are listed in Table 2, and their positions are plotted in the bottom right panel in Fig. 2. We used the Multimission Archive at the Space Telescope Science Institute (MAST666 MAST is operated by AURA under grant NAG5–7584.) and the SDSS Image List Tool777. to examine the GALEX and SDSS “postage stamp” images for all 21 sources (see Fig. 5 and Fig. 6 for mosaics of these images).
-
•
Extended galaxies
The only two GALEX sources without an SDSS counterpart detected both in the NUV and FUV, J230734.52001731.04 and J230919.65004515.64, are associated with optically large SDSS galaxies whose centers are farther than from the GALEX position—this large separation explains why they were not matched (for SDSS J230920.2004523.3, the counterpart to J230919.65004515.64, a spectrum is available; this is clearly an emission–line galaxy). In addition, J230644.65001302.13, detected only in the NUV band, also appears to be associated with a galaxy, although here the GALEX source is positioned on the very edge of the optically detected galaxy (see the top right pair of images in Fig. 5).
In all of these cases the GALEX source extraction pipeline (based on SEXtractor; Bertin & Arnouts 1996) did not label the sources as artifacts, but did set the extraction flag to 3 in all the bands in which it claimed a detection, indicating that the object was originally blended. These detections are supported by the recent work of Thilker et al. (2005), who observe significant GALEX emission at large radii in nearby galaxies. Our off–center detections may be UV emission coming from star–forming regions at large galactic radii, similar to those found in the tidal tails of “the Antennae” merging system (Hibbard et al. 2005).
-
•
Artifacts
Several other sources appear to be close enough to bright stars that they may in fact be artifacts that were not flagged. J230518.70002816.29, J230751.11003936.81, and J230959.96003441.17 were all flagged by SEXtractor as either having bright neighbors close enough to bias the photometry (flag ), or as having originally been blended sources (flag ). While J230717.62001853.40, J230852.36001005.47, and J231042.50002126.92 were not flagged at all, their SDSS images suggest that they could indeed be detections due to bright star halos (see the bottom two rows of Fig. 5).
We note that J230519.28002741.34 (GSC 0524200801; , 888This research has made use of the SIMBAD database, operated at CDS, Strasbourg, France.), the star responsible for the halo detected as J230518.70002816.29, is very bright in the near–UV: ().
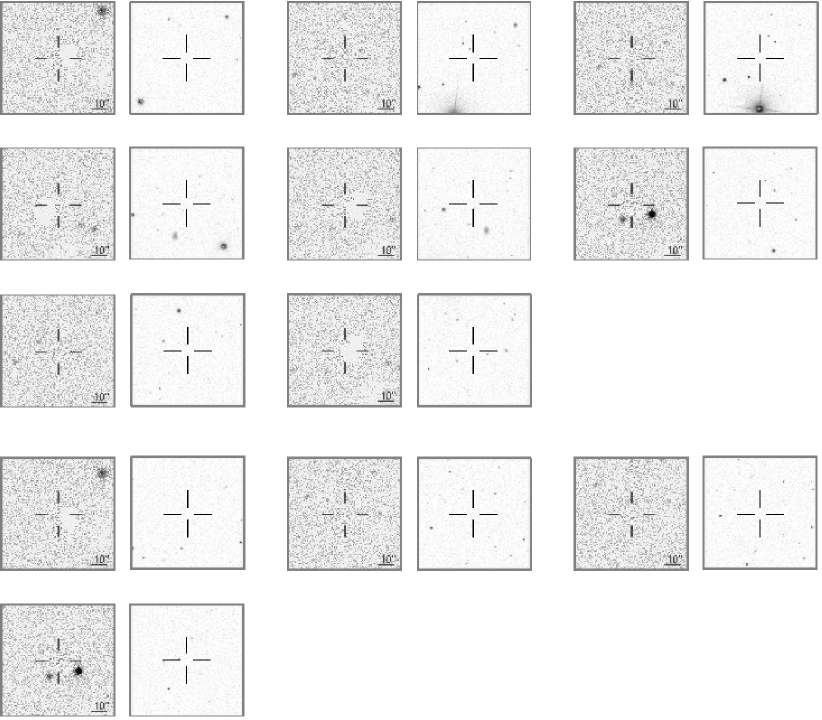
An additional eight GALEX sources are found between and from SDSS–detected stars with (see the top three rows of Fig. 6; three of these sources were flagged by SEXtractor as having originally been blended).
There are 1537 GALEX sources detected less than from their respective field centers with and no or flags. Assuming that the 14 sources described here are stellar artifacts, we can place an upper limit of for the fraction of the “photometric” GALEX sources that are unflagged artifacts.
-
•
Unexplained non–matches
Four GALEX sources do not have a bright star within a few arcminutes (see the bottom two rows of Fig. 6). J231131.21002510.96 is the only one flagged by SEXtractor as having been deblended, suggesting that it is an artifact. However, nothing in the MAST provides any explanation for the nature of the other non–matches. These mysterious sources represent fewer than of the total number of photometric GALEX sources within of the field centers. They do not have counterparts within cataloged in either SIMBAD or NED999This research has made use of the NASA/IPAC Extragalactic Database (NED) which is operated by the Jet Propulsion Laboratory, California Institute of Technology, under contract with the National Aeronautics and Space Administration., suggesting that they may not be real sources. On the other hand, if their UV detections could be confirmed, they would represent an interesting class of extremely blue (UV–to–optical) sources. A larger sample of GALEX sources may indeed provide scores of such objects worthy of further investigation.
In summary, of the 3199 UV sources cataloged with positions within R of their respective field centers, 192, or , have no SDSS counterpart within . If we make some basic quality cuts on the GALEX data, this proportion does not change much: of the 2362 unflagged GALEX sources within the radius, 130, or , are not matched with an SDSS source. Finally, if we require that the sources have , there are 1537 GALEX sources within the radius, and only 21, or , without an SDSS counterpart.
We can discount 10 of these 21 sources as probably artifacts based on their extraction flags. That leaves 11 UV sources out of 1537, or , as photometric GALEX sources without an SDSS counterpart within . We have examined the GALEX and SDSS images for all 21 of the sources without a counterpart; in a handful of cases, we are unable to identify even an unlikely source (i.e., a distant star’s halo) as responsible for the GALEX detection. While these comprise fewer than of the photometric GALEX sources, and are likely to be artifacts, they may be objects detected only in the UV and therefore of great interest.
3.3 The Repeatability of GALEX Measurements
The three GALEX AIS ERO fields overlap slightly. We therefore matched the GALEX catalogs for the AIS fields with each other in order to characterize the differences between the measurements of objects observed twice. There are 31 multiply observed GALEX sources that pass the quality cuts discussed above.
The systematic astrometric offsets in both coordinates are consistent with GALEX astrometric errors inferred from comparison with SDSS astrometry. The root–mean–square (rms) scatter is somewhat larger (), probably because the multiply observed GALEX objects are detected near the edges of the fields.
The rms scatter for the band measurements is 0.33 magnitudes (only a small fraction of sources is detected in both bands both times). The magnitude differences depend on the mean magnitude for . For sources at the bright end (eight sources with ) we find that the median offset is 0.13 magnitudes, with an rms of only 0.07 magnitudes. The magnitude difference normalized by the expected error has an rms scatter of 1.4, and 1.9 at the bright end. This demonstrates that the photometric errors are computed fairly accurately by the GALEX photometric pipeline, and that systematic errors at the bright end are not very large.
4 Analysis
In this section we first compare the optical properties of matched sources to the full SDSS sample, and then extend our analysis by combining UV, optical, and IR data from the GALEX, SDSS, and 2MASS surveys. The sample of matched sources analyzed here is UV–selected, since practically every GALEX source is detected by SDSS, while only 2.5% of SDSS sources are detected by GALEX. Not all GALEX/SDSS sources are detected by 2MASS (this is especially true for resolved sources; see Ivezić et al. 2001), but this has no impact on the UV–optical–infrared SEDs discussed in §4.3.
SDSS color–magnitude and color–color diagrams are a powerful tool to classify detected sources (e.g., Fan 1999, Finlator et al. 2000, Richards et al. 2002, and references therein), thanks to accurate five band photometry and robust star/galaxy separation. Thus, when studying a subsample of sources selected by other means, such as detections at non–optical wavelengths, it is very informative to examine their distribution in these diagrams.
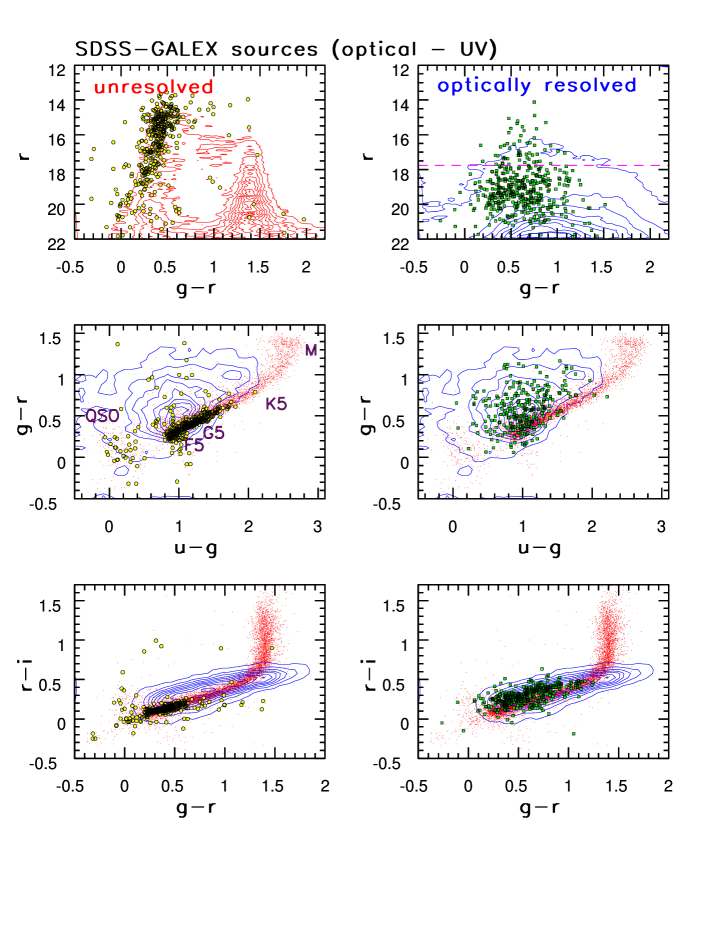
The contours in the top two panels of Fig. 7 outline the distribution of optically unresolved (left) and resolved (right) SDSS sources in the vs color–magnitude diagram (we use the SDSS model magnitudes; for details see Stoughton et al. 2002). The matched GALEX/SDSS sources are shown by symbols. For GALEX detections we require or and correct magnitudes for interstellar extinction using and , where is the band extinction from the maps of Schlegel, Finkbeiner, & Davis (1998), distributed with the SDSS data. These coefficients were evaluated using the standard interstellar extinction law101010The standard Milky Way extinction curve predicts that the color becomes bluer with increasing extinction—this is a consequence of the strong feature at 0.22 m (e.g., Fig. in Calzetti, Kinney, & Storchi–Bergmann 1994). from Cardelli, Clayton, & Mathis (1989; M. Seibert 2004, private communication). The median for the three AIS fields is 0.12, with a root–mean–square scatter of 0.02 magnitudes.
The remaining panels in Fig. 7 show the distribution of optically unresolved (dots) and resolved (contours) SDSS sources in the vs (middle row) and vs (bottom row) color–color diagrams, which we discuss in the next two sections.
4.1 Unresolved SDSS Sources
The optically unresolved GALEX/SDSS sources are dominated by blue turn–off stars ( and , see the middle left panel in Fig. 7). The sample also contains low–redshift quasars () and hot white dwarfs (both are identified by their blue colors, ), as well as white dwarf–M dwarf pairs (scattered above the locus; for details, see Smolčić et al. 2004 and Pourbaix et al. 2004). The well–defined red edge of the turn–off star distribution in the vs color–magnitude diagram (at for and for ) is a consequence of the GALEX faint limit and the steep dependence of the UV–optical color on the effective temperature (the latter essentially controls the color). For these stars we find that , and thus the faint limit in the GALEX band () defines the observed red edge: .
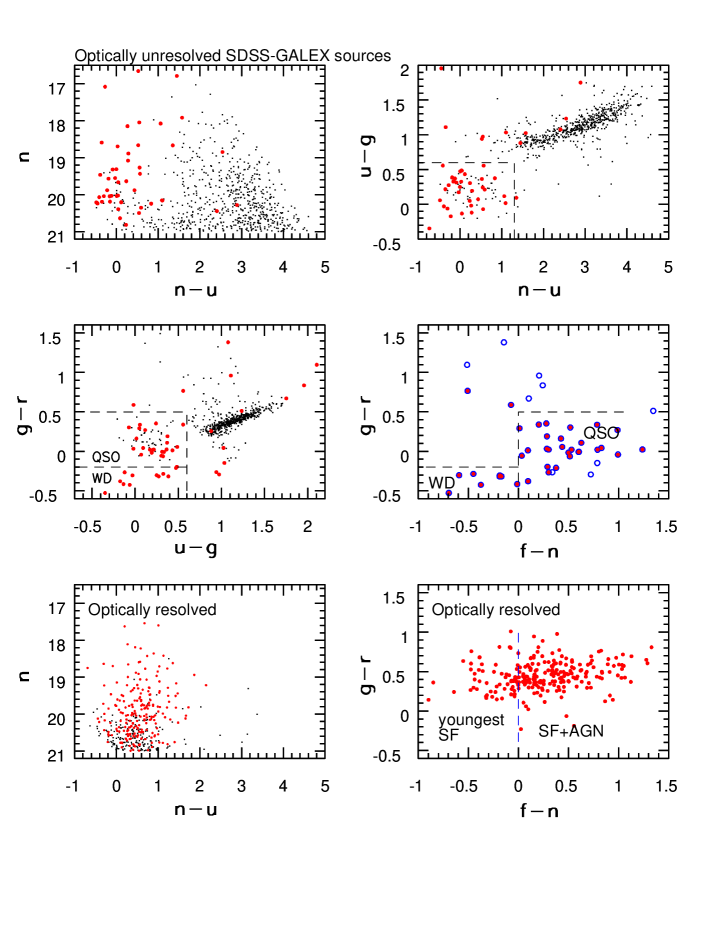
The top left panel in Fig. 8 shows the distribution of optically unresolved GALEX/SDSS sources in the vs color–magnitude diagram. Sources detected only in the GALEX NUV band are shown as small dots, and those with detections in both FUV and NUV bands as large dots. The easily discernible bimodal distribution of the color is well correlated with the distribution of the SDSS color, as shown in the top right panel. The boundary corresponds to which separates turn–off stars from hotter stars (T K) and low–redshift quasars. The last two classes dominate the optically unresolved sources detected in both GALEX bands. As discernible from the middle left panel, the fraction of GALEX/SDSS sources detected in both GALEX bands is much higher for hot stars (, , dominated by white dwarfs) than for quasars (, ). This is a consequence of the GALEX faint limit in the FUV band and the fact that the color is bluer for hot stars than for quasars (see the middle right panel in Fig. 8). In addition, quasars at redshifts beyond may be very faint in the band because the Ly line is redshifted to the band.
4.2 Resolved SDSS Sources
The optically resolved GALEX/SDSS sources are dominated by galaxies fainter than the SDSS spectroscopic limit for the “main” sample (111111The SDSS Petrosian magnitude, , is computed using the Petrosian flux. The Petrosian flux is measured in a circular aperture of radius twice the Petrosian radius, where the latter is defined by the ratio of the averaged and local surface brightness. See Strauss et al. (2002) for details.), but mostly brighter than , as discernible from the top right panel in Fig. 7. GALEX/SDSS galaxies are predominantly blue (, or ; for a discussion of the bimodal color distribution of galaxies see Strateva et al. 2001), while a small fraction have colors consistent with those of AGN (; Obrić et al. 2005, in preparation).
The distribution of optically resolved GALEX/SDSS sources in the vs color–magnitude diagram is shown in the bottom left panel in Fig. 8, where those detected only in the GALEX NUV band are shown as small dots, and those with detections in both FUV and NUV bands as large dots. Unlike optically unresolved sources, whose detection in both GALEX bands is strongly correlated with the color, for optically resolved sources the fraction of those with detection in both GALEX bands is strongly correlated with brightness: galaxies brighter than typically have both detections, and those with only one detection are dominated by galaxies with . The fairly narrow color distribution suggests that the mismatching of SDSS and GALEX detections and other problems such as the shredding of extended galaxies by the GALEX photometric pipeline discussed by Seibert et al. (2005a) are not significant for this sample.
Galaxies having undergone recent starbursts have UV fluxes dominated by their most massive young stars. These hot stars have T K and UV spectral slopes ( colors) similar to those of hot white dwarfs. As these galaxies age, stellar evolution will preferentially remove the hottest, bluest members first, and their UV color will grow redder121212According to models by Bianchi et al. (2005), the color changes from to to as a single stellar population ages from 1 Myr to 10 Myr and to 100 Myr.. By comparison, the UV flux of AGN host galaxies is dominated by emission from their central source, whose UV spectral slope is similar to that of (unresolved) low–redshift quasars.
In the middle right panel of Fig. 8, we divide the vs color–color diagram for unresolved sources into regions dominated by hot white dwarfs (, ) and by low–redshift quasars (, ). GALEX photometric errors should make negligible contributions to the observed color dispersion, as our flux limits are conservative ( and ); nevertheless, some of the extreme color outliers could reflect non–Gaussian errors, such as the pipeline’s treatment of complex or blended sources, or GALEX/SDSS mismatches. In addition, dust attenuation may affect the integrated color of galaxies, and bias the implied stellar ages discussed below towards larger values. Using the model results from Salim et al. (2005), we estimate that the median reddening of the color due to dust may be about 0.5 magnitudes. For this reason, we emphasize that the adopted boundary is intrinsically fuzzy.
As shown in the bottom right panel of Fig. 8, comparing the colors of GALEX/SDSS galaxies to those of the unresolved sources suggests that GALEX/SDSS galaxies with are likely to be the youngest starburst galaxies, with UV colors still dominated by flux from very hot stars (plausible ages, inferred from models, are less than 20 Myr; e.g., Bianchi et al. 2005). Furthermore, this sample should not suffer seriously from AGN contamination, as relatively few low–redshift quasars have colors this blue.
Resolved sources with , however, while consistent with a population of older starburst galaxies, may also contain a significant fraction of AGN hosts, given that low–redshift quasars share this UV color space. While GALEX colors will provide constraints on the star formation history with greater precision than is possible from SDSS data, since the GALEX color varies substantially more than the SDSS color (), additional information, such as spatially resolved far–UV emission, or X–ray and radio data, is needed before the GALEX UV color can be unambiguously interpreted as a sign of recent star formation. An analogous conclusion follows from the distribution of the color: for the majority of GALEX/SDSS galaxies is bluer than the color for turn–off stars in the Galaxy, and is similar to colors of both quasars and hot stars (compare the top left and bottom left panels in Fig. 8).
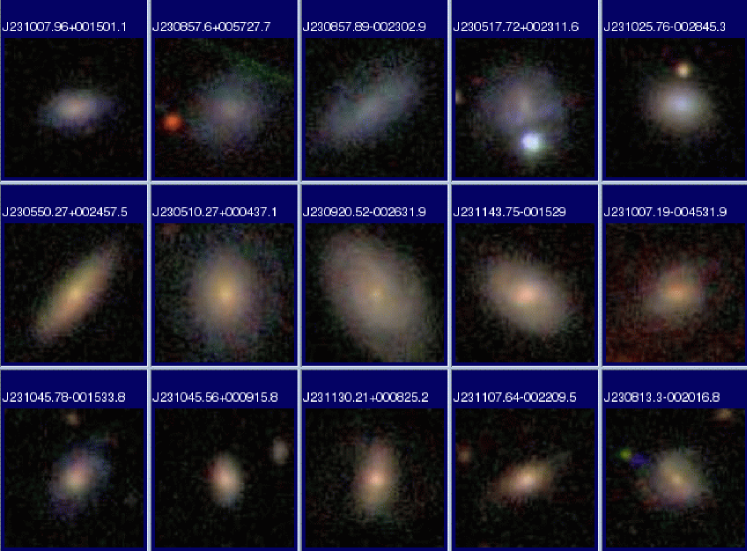
Further evidence that a blue UV color for GALEX/SDSS galaxies does not necessarily imply starburst emission comes from a detailed analysis of emission line strengths measured from SDSS spectra. Obrić et al. (2005) study the multi–wavelength properties of SDSS “main” spectroscopic galaxies and find that about 40% of them are detected by GALEX. Of those, 70% are emission–line galaxies, which they classify as AGN, star–forming, or “inconclusive” using line strength ratios. They find that at least 10% of SDSS “main” galaxies detected by GALEX have emission lines indicating an AGN, with the true fraction possibly as high as 30%. We have visually inspected SDSS color composite images of these galaxies (a total of 55) and found that the classification based on emission line strengths is well correlated with morphology. SDSS images of a random subsample of Obrić et al. GALEX/SDSS AGN, star–forming, and “inconclusive” galaxies are presented in Fig. 9, and show clear morphological differences between galaxies classified as star–forming and as AGN, with the latter being more centrally concentrated. These morphological differences further demonstrate that at least some GALEX/SDSS galaxies are more likely to be AGN than star–forming. In Table 3, we list Obrić et al.’s measurements of the light concentration indices (see Strateva et al. 2001 for details) and emission line strengths, SDSS redshifts, and GALEX, SDSS, and 2MASS photometry/colors, for the AGN candidates in Fig. 9. We note that one of the AGN candidates, SDSS J230920.52002631.9, is cataloged by SIMBAD as the Seyfert 1 galaxy [VV2003c] J230920.5002632, while another, SDSS J231143.75001529 is from a cataloged FIRST source (Becker, White, & Helfand 1995).
Finally, we note that although young stellar populations dominate the UV flux from starburst galaxies, their contribution to the UV–optical–infrared flux is very small, as inferred from the red colors for these sources (, unlike typical for stars with ). We discuss the contribution of UV light to the UV–optical–IR flux further below.
4.3 The 10 band UV–Optical–IR Spectral Energy Distributions
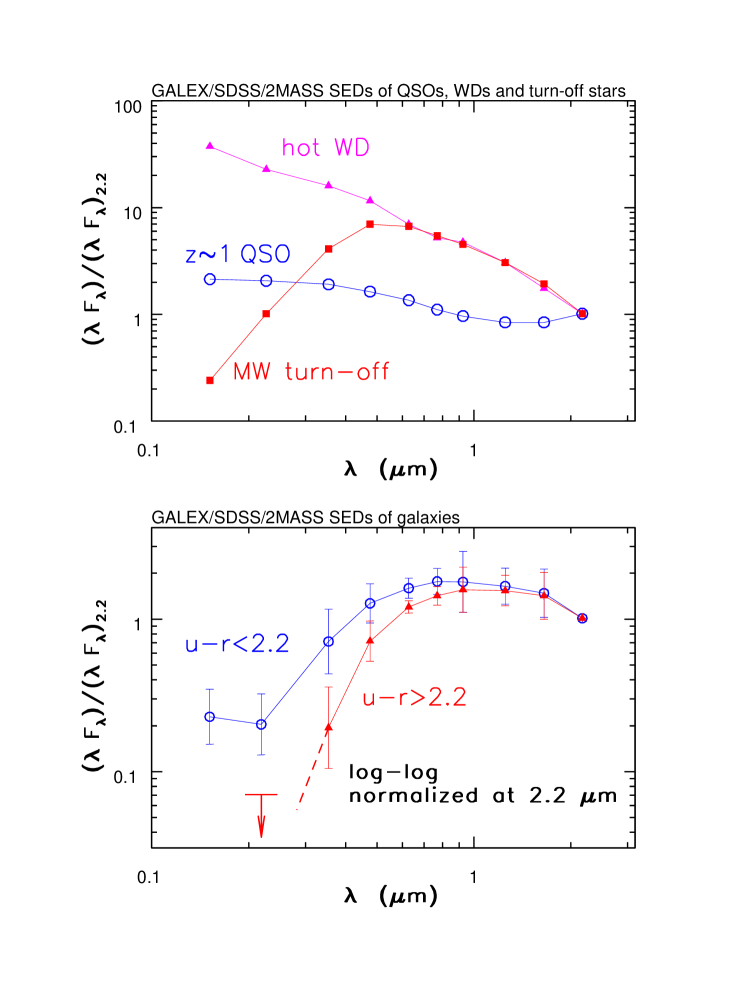
In addition to color–color and color–magnitude diagrams, an efficient way to analyze data that span such a wide wavelength range is to construct the spectral energy distributions (SEDs) for various classes of sources. Here we analyze the turn–off stars, hot stars, low–redshift quasars, and two subsamples of galaxies. We expand the wavelength range by including 2MASS data; we use the Vega–to–AB conversion for 2MASS magnitudes as described by Finlator et al. 2000: , , . The SEDs are presented in the (=) form, normalized to 1 at 2.2 m (2MASS band).
For hot and turn–off stars, we select subsamples in the SDSS vs color–color diagram (see §4.1 and Fig. 7), and use the median colors (e.g., for , , …, ) to construct their SEDs. Optical colors of low–redshift quasars vary by a few tenths of a magnitude as a function of redshift, due to emission line effects (Richards et al. 2001). We adopt optical colors representative of objects at (i.e., roughly the median redshift). The sample of GALEX/SDSS low–redshift quasars discussed here is not sufficiently large to constrain the dependence of UV colors on redshift, and we simply adopt the median values for and colors. For 2MASS colors (which vary less as a function of redshift than do the optical colors), we take the median values of , and colors for a sample of low–redshift quasars discussed by Covey et al. (2005, in preparation; these values agree well with the results of Finlator et al. 2000). The SEDs for these three representative classes of optically unresolved sources are shown in the top panel in Fig. 10. Note that the well–known 1 m inflection in the quasar SED (e.g., Elvis et al. 1994) is properly reproduced.
The observed broad–band colors of a galaxy depend both on its type and redshift (K correction). Due to the limited redshift range, the effect of galaxy type dominates the observed color dispersion. Following Strateva et al. (2001), we separate galaxies in two dominant subsamples using the SDSS color; in practice, this roughly corresponds to a morphological division into spiral and elliptical galaxies. The effect of K correction on measured optical and infrared galaxy colors is discussed in detail by Obrić et al. (2005). Of the “main” galaxies they study, 1880 blue and 3400 red galaxies listed in the 2MASS Extended Source Catalog and selected from the narrow redshift range are used to construct these SEDs. For the subsample we adopt the median and colors for the GALEX/SDSS galaxies discussed here. For the subsample, only the median color is used, while for the color we adopt a lower limit, based on the color of the GALEX faint flux limits (most of those galaxies are not detected in the band). The SEDs for the two dominant types of galaxies are shown in the bottom panel in Fig. 10. The error bars indicate the root–mean–square scatter in each color and for each subsample.
The comparison of the UV parts of SEDs for optically unresolved sources and galaxies further illustrates the conclusions from the preceding section. The very blue UV color for galaxies detected in both GALEX bands cannot be due to stars with similar ages as the turn–off stars from the Galaxy. On the other hand, the observed UV slope is consistent with the UV slope for both hot stars and low–redshift quasars. The contribution of the UV flux to the UV–optical–infrared flux of galaxies is discussed next.
4.4 The UV Contribution to the UV–Optical–IR Flux of Galaxies
Obrić et al. (2005) present an analysis of the dependence of galaxy SEDs on galaxy type. For each dominant galaxy type (defined by the color division of Strateva et al. 2001) they compute the integrated flux in the m range covered by GALEX, SDSS, and 2MASS data. Although we refer to this flux as the bolometric flux hereafter, note that it does not include the contributions from wavelengths longer than 2.2 m, which, for galaxies with strong mid– and far–infrared emission, could be as large, or larger, as those from the m region (the contributions from wavelengths shorter than m are most likely not important). Obrić et al. demonstrate that galaxy SEDs, when normalized by this bolometric flux, cross at a wavelength corresponding to the SDSS band, regardless of the galaxy type. In other words, the bolometric correction for galaxies in the band is independent of type, and thus the band flux and absolute magnitude measurements are good proxies, to within a type–independent constant (which they report as (), for bolometric flux and bolometric luminosity. Hence, the color is a good choice for studying the UV contribution to the bolometric flux of galaxies.
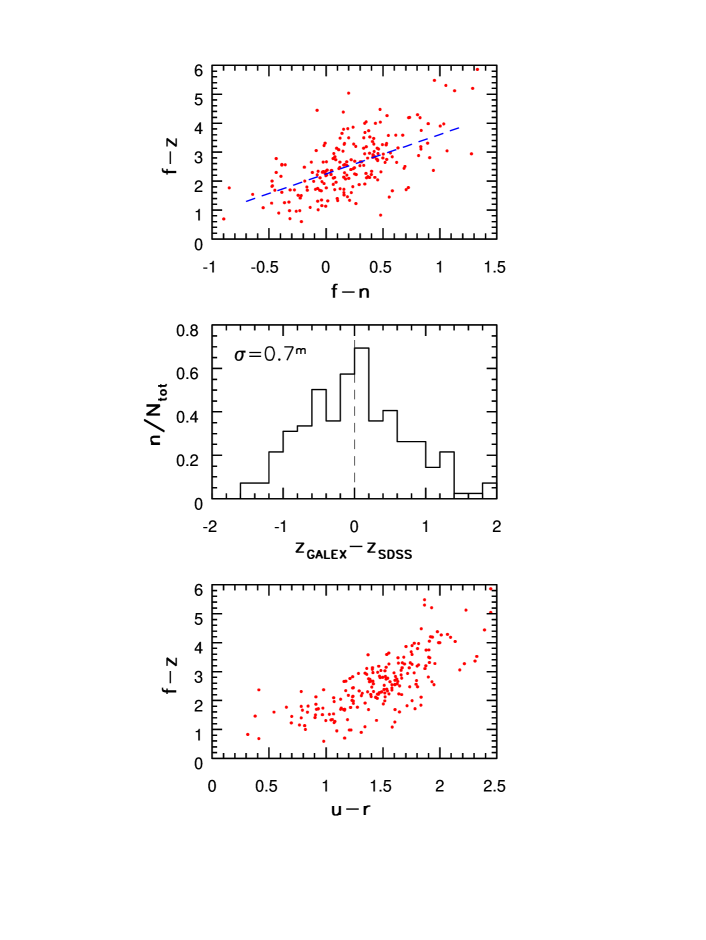
The top panel in Fig. 11 shows the color of galaxies detected in both GALEX bands as a function of the color. A good degree of correlation is evident: galaxies with bluest colors also tend to have the bluest colors. The selection effects for the sample shown in Fig. 11 are simple and defined by the GALEX faint flux limits, since essentially all GALEX sources are detected by SDSS. Hence, the correlation between the and colors is an astrophysical relation, rather than, for example, a consequence of missing sources in the upper left and lower right corners due to faint flux limits (for a counterexample see below). In other words, it is fair to use the GALEX and measurements to “predict” the SDSS magnitude. The relation , shown by the dashed line in the top panel in Fig. 11, predicts unbiased SDSS band magnitudes with a root–mean–square scatter of only 0.7 magnitudes (see the middle panel of Fig. 11).
This correlation probably includes both the effects of the age distribution of stellar populations and dust attenuation effects. If the contribution of dust attenuation effects is not dominant131313According to the effective extinction law from Calzetti, Kinney, & Storchi–Bergmann (1994), . Hence, even if that extinction law does not apply exactly (e.g., if the dust is different, or if there are unaccounted for radiative transfer effects), the slope of the observed vs correlation (1.36) appears too small to be explained only by dust attenuation., then it implies that the hottest, and thus youngest, stellar populations seem to have a fair degree of knowledge about the older populations. A detailed study of this interesting possibility, including disentangling the contributions of stellar age and dust attenuation effects, and the transformation to more physical quantities like the current and integrated star–formation rate, is beyond the scope of this work and will be addressed elsewhere.
As an example of an apparent correlation between colors due to selection effects, we show the color as a function of the color in the bottom panel in Fig. 11. The distribution of galaxies in this diagram represents a bivariate distribution of the UV contribution to the UV–optical–IR flux (or luminosity) as a function of the morphological type (i.e., the color). However, only those galaxies with substantial UV flux, relative to the UV–optical–IR flux, are sufficiently bright to be detected by GALEX. The sharp red cutoff in the distribution of sources, running from the lower left to the upper right corner, is therefore a direct consequence of the GALEX faint flux limit, and does not represent an intrinsic astrophysical correlation. This “asymmetry” with respect to the vs diagram discussed above comes from the fact that every GALEX galaxy is detected by SDSS, but only some SDSS galaxies (those with substantial star formation, or perhaps with AGN activity) are detected by GALEX. Equivalently, the measurement is available for every galaxy with measurement, but not for every galaxy with the measurement.
In the same way SDSS band magnitudes can be “predicted” from GALEX and measurements, the vs correlation can be used to formally predict the band flux from the SDSS , and band measurements, with a root–mean–square scatter of only 0.6 magnitudes. However, this scatter is simply a measure of the slope of the differential magnitude distribution, just above the band faint cutoff. With several magnitudes deeper UV data, the apparent correlation in the bottom panel in Fig. 11 should disappear, and this scatter would increase considerably.
5 Discussion
This study, despite the relatively small sample of matched objects, indicates the enormous potential of modern massive sensitive large–scale surveys, and emphasizes the added value obtained by combining data from different wavelengths. The comparison of GALEX and SDSS data, as well as the analysis of repeated GALEX observations, demonstrates the high quality of the GALEX catalogs. We find no significant population of sources detected only by GALEX; the 1% of GALEX sources without a probable SDSS counterpart appear to be dominated by processing artifacts. While the astrometric calibration seems to show systematic offsets of order , the reported photometric errors describe the behavior of GALEX photometry quite well.
Although only 2.5% of SDSS sources are detected by GALEX, the UV data carry important astrophysical information. For example, the GALEX measurements of the UV color allow much more accurate and robust estimates of star–formation history than possible using only SDSS data. However, we caution that the UV spectral slope for the majority of galaxies detected in both GALEX bands is consistent both with hot stars and with AGN activity. Additional information, such as spatially resolved far–UV emission, or X–ray, IR, and radio data, is needed before the blue GALEX UV color can be unambiguously interpreted as a sign of recent star formation. For example, Yi et al. (2005) interpreted the GALEX detections of 63 elliptical galaxies from an SDSS sample constructed by Bernardi et al. (2003) as evidence for recent star formation. However, as their Fig. 3 shows, all 63 of those galaxies have (or in their nomenclature). Our work suggests that, at least in principle, their UV emission may instead reveal low–level AGN activity.
Similarly to Yi et al., Rich et al. (2005) analyze a sample of early–type GALEX/SDSS galaxies with redshifts 0.2. They select a subsample of 172 quiescent early–type galaxies by excluding all those with any evidence for non early–type morphology, star formation, or AGN activity (using emission lines), and point out a surprisingly large range of the color (from 3 to 8). We find that the observed range of the color can be explained by a small contribution of AGN–like emission to an otherwise normal (“old red and dead”) elliptical galaxy. For example, assume that an AGN–like SED with and is added to an elliptical galaxy SED with and (Gil de Paz et al. 2005), such that the AGN contribution to the band flux is . The AGN contribution to the overall flux is then in the band and in the band. That is, the color is dominated by the AGN contribution and becomes 0.30 (with ). The addition of such a low–level AGN emission would likely go undetected in SDSS spectra.
We have used two special purpose analysis pipelines developed by Tremonti et al. (2004) and Hao et al. (2005) to model and subtract the stellar continuum and measure the residual emission lines in such composite AGN + galaxy spectra. Both codes produce comparable results: the addition of an AGN–like SED with the continuum contribution of in the band produces a signal–to–noise ratio (SNR) for the H emission line in of galaxies, and in only of galaxies. When the SNR cutoff is imposed on other lines needed to construct the BPT diagram (Baldwin, Phillips, & Terlevich 1981), such AGN emission is practically unnoticeable in SDSS spectra, although it dominates the GALEX flux measurements! Hence, the UV emission from quiescent ellipticals discussed by Rich et al. could simply be due to low–level AGN activity.
From our analysis of the UV colors of the low–redshift QSOs and the hottest stars detected by SDSS, we find that, in the absence of additional information, the only robust criterion to avoid contamination by AGNs is to require (which, of course, biases the sample towards the youngest starbursts). Indeed, Obrić et al. (2005) use emission line strengths to separate star–forming from AGN galaxies in a sample of “main” SDSS spectroscopic galaxies detected by GALEX, and find that the median colors are 0.1 for star–forming galaxies and 0.5 for AGN galaxies, in good agreement with the analysis presented here.
It should be noted that it is not obvious what exactly the color measures. For example, Seibert et al. (2005b) tested the canonical UV color–attenuation (IRX–) relation for starburst galaxies with a sample of GALEX and Infrared Astronomical Satellite (IRAS) galaxies, and found that it consistently overestimates the attenuation they derive from their sample by half a magnitude. While is certainly expected to be affected by dust attenuation (e.g., Kong et al. 2004, Buat et al. 2005), the distribution of galaxies in the vs diagram implies that the ages of the dominant stellar populations and the corresponding star–formation rates must play a significant role in determining the color of a galaxy (as opposed to simply reflecting a varying degree of reddening of one and the same intrinsic stellar population in different galaxies).
Finally, models have some difficulties producing colors at the extreme blue edge (e.g., Bianchi et al. 2005). While this discrepancy could of course point to suspect observations (e.g., non–Gaussian photometric errors), the modeling of far–UV colors of galaxies is notoriously difficult due to the unknown spatial distribution of dust and to the poorly constrained dust opacity in this wavelength range. Furthermore, the observed colors of hot stars in our Galaxy do extend all the way to .
In any case, we emphasize that most of our conclusions regarding the nature of GALEX sources are model–independent—for example, those that pertain to galaxies are based on the comparison of galaxy colors with those observed for Galactic sources and quasars using the same bands and the same instruments.
References
- (1) Abazajian, K., et al. 2005, AJ, 129, 1755
- (2) Baldwin, J., Phillips, M., & Terlevich, R. 1981, PASP, 93, 5
- (3) Becker, R.H., White, R.L., & Helfand, D.J. 1995, ApJ, 450, 559
- (4) Bernardi, M., et al. 2003, AJ, 125, 1817
- (5) Bertin, E. & Arnouts, S. 1996, A&AS, 117, 393
- (6) Bianchi, L., et al. 2005a, ApJL, 619, 27
- (7) Buat, V., et al. 2005, ApJL, 619, 51
- (8) Calzetti, D., Kinney, A.L., & Storchi–Bergmann, T. 1994, ApJ, 429, 582
- (9) Cardelli, J.A., Clayton, G.C., & Mathis, J.S. 1989, ApJ, 345, 245
- (10) Covey, K.R., et al. 2005, in preparation
- (11) Elvis, M., et al. 1994, ApJS, 95, 1
- (12) Fan, X. 1999, AJ, 117, 2528
- (13) Finlator, K., et al. 2000, AJ, 120, 2615
- (14) Fukugita, M., Ichikawa, T., Gunn, J.E., Doi, M., Shimasaku, K., & Schneider, D.P. 1996, AJ, 111, 1748
- (15) Gil de Paz, A., et al. 2005, ApJL, 619, 115
- (16) Gunn, J.E., et al. 1998, AJ, 116, 3040
- (17) Hao, L., et al. 2005, AJ, 129, 1783
- (18) Hibbard, J.E., et al. 2005, ApJL, 619, 87
- (19) Hg, E., et al. 2000, A&A, 357, 367
- (20) Hogg, D.W., Finkbeiner, D.P., Schlegel, D.J., & Gunn, J.E. 2002, AJ, 122, 2129
- (21) Ivezić, Ž., et al. 2001, in IAU Colloq. 184, AGN Surveys, ed. R.F. Green, E.Ye. Khachikian, & D.B. Sanders (San Francisco: ASP), 137
- (22) Ivezić, Ž., Lupton, R.H., Schlegel, D., et al. 2004, AN, 325, 6/8, 583
- (23) Kong, X., et al. 2004, MNRAS, 349, 769
- (24) Lupton, R.H., Ivezić, Ž., Gunn, J.E., Knapp, G.R., Strauss, M.A. & Yasuda, N. 2002, in Proceedings of the SPIE, 4836, Survey and Other Telescope Technologies and Discoveries, ed. J.A. Tyson & S. Wolff (Bellingham: SPIE), 350
- (25) Martin, D.C., et al. 2005, ApJL, 619, 1
- (26) Morrissey, P., et al. 2005, ApJL, 619, 7
- (27) Obrić, M., et al. 2005, in preparation
- (28) Pier, J.R., Munn, J.A., Hindsley, R.B., Hennesy, G.S., Kent, S.M., Lupton, R.H., & Ivezić, Ž. 2003, AJ, 125, 1559
- (29) Pourbaix, D., Ivezić, Ž., Knapp, G.R., Gunn, J.E., & Lupton, R.H. 2004, A&A, 423, 755
- (30) Rich, R.M., et al. 2005, ApJL, 619, 107
- (31) Richards, G.T., et al. 2002, AJ, 123, 2945
- (32) Richards, G.T., et al. 2001, AJ 121, 2308
- (33) Salim, S., et al. 2005, ApJL, 619, 39
- (34) Schlegel, D., Finkbeiner, D.P., & Davis, M. 1998, ApJ 500, 525
- (35) Seibert, M., et al. 2005a, ApJL, 619, 23
- (36) Seibert, M., et al. 2005b, ApJL, 619, 55
- (37) Smith, J.A., et al. 2002, AJ, 123, 2121
- (38) Smolčić, V., et al. 2004, ApJ, 615, L141
- (39) Stoughton, C., et al. 2002, AJ, 123, 485
- (40) Strateva, I., et al. 2001, AJ, 122, 1861
- (41) Strauss, M.A., et al. 2002, AJ, 124, 1810
- (42) Thilker, D.A., et al. 2005, ApJL, 619, 79
- (43) Tremonti, C.A., et al. 2004, ApJ, 613, 898
- (44) Yi, S., et al. 2005, ApJL, 619, 111
- (45) York, D.G., et al. 2000, AJ, 120, 1579


| RARASDSS | DecGALEXDecSDSS | |
| GALEX field center | Median (arcsec) | Median (arcsec) |
| All matches | ||
| Combined fields | ||
| Matches with R | ||
| Combined fields | ||
| Clean matches | ||
| Combined fields | ||
| GALEX name | Flags? | Likely SDSS counterpart | ||
| Galaxies | ||||
| J230644.65001302.13 | N/A | NUV = 3 | J230645.4001309.5, , D | |
| J230734.52001731.04 | FUV, NUV = 3 | J230734.4001737.3, , D | ||
| J230919.65004515.64 | FUV, NUV = 3 | J230920.2004523.3, , D | ||
| Likely stellar artifacts | ||||
| J230518.70002816.29 | N/A | NUV = 1 | J230519.2002741.3, , D | |
| J230717.62001953.40 | N/A | None | J230715.31002008.8, , D | |
| J230751.11003936.81 | N/A | NUV = 2 | J230752.1003858.5, , D | |
| J230852.36001005.47 | N/A | None | J230853.7000942.1, , D | |
| J230959.96003441.17 | N/A | NUV = 1 | J231002.3003433.1, , D | |
| J231042.50002126.92 | N/A | None | J231041.6002133.3, , D | |
| Likely stellar artifacts? | ||||
| J230740.51003458.86 | N/A | None | J230731.4003538.1, , D | |
| J230750.47004018.21 | N/A | None | J230752.1003858.5, , D | |
| J230752.10004008.03 | N/A | None | J230752.1003858.5, , D | |
| J230754.36000907.62 | N/A | NUV = 2 | J230800.1000710, , D | |
| J230756.56000859.81 | N/A | NUV = 2 | J230800.1000710, , D | |
| J230911.58002631.83 | N/A | None | J230923.4002727.5, , D | |
| J230943.69000822.11 | N/A | None | J230946.4001041.5, , D | |
| J231015.82004246.95 | N/A | NUV = 2 | J231017.9004123.5, , D | |
| Unexplained | ||||
| J231000.10001636.82 | N/A | None | ||
| J231011.21001211.11 | N/A | None | ||
| J231011.36001227.72 | N/A | None | ||
| J231131.21002510.96 | N/A | NUV = 2 | ||
| SDSS name | J230550.27 | J230510.27 | J230920.52 | J231143.75 | J231007.19 |
|---|---|---|---|---|---|
| 002457.5 | 000437.1 | 002631.9 | 001529 | 004531.9 | |
| RA | |||||
| Dec | |||||
| CI | |||||
| NII/Hα | |||||
| OIII/Hβ | |||||
| z | |||||
| aaA nearby star (saturated in SDSS) is likely to have affected the GALEX and SDSS measurements | |||||
| bbUpper limit | |||||
| Comments | LEDA 1156491 | Seyfert 1 | FIRST source |