Unusual Pulsed X-ray Emission from the Young, High Magnetic
Field Pulsar
PSR J1119–6127
Abstract
We present XMM–Newton observations of the radio pulsar PSR J1119–6127, which has an inferred age of 1,700 yr and surface dipole magnetic field strength of 4.11013 G. We report the first detection of pulsed X-ray emission from PSR J1119–6127. In the 0.5–2.0 keV range, the pulse profile shows a narrow peak with a very high pulsed fraction of (7414)%. In the 2.0–10.0 keV range, the upper limit for the pulsed fraction is 28% (99% confidence). The pulsed emission is well described by a thermal blackbody model with a temperature of = 2.4106 K and emitting radius of 3.4 km (at a distance of 8.4 kpc). Atmospheric models result in problematic estimates for the distance/emitting area. PSR J1119–6127 is now the radio pulsar with smallest characteristic age from which thermal X-ray emission has been detected. The combined temporal and spectral characteristics of this emission are unlike those of other radio pulsars detected at X-ray energies and challenge current models of thermal emission from neutron stars.
Subject headings:
ISM: individual (G292.2-0.5) — pulsars: individual (PSR J1119–6127) — supernova remnants — X-rays: ISM1. Introduction
The most commonly studied neutron stars (NSs) are radio pulsars, generally thought to be powered by the loss of rotational kinetic energy due to magnetic braking. The thermal X-rays observed from some pulsars are thought to be emitted at the surface and to originate from initial cooling or from polar caps reheated by magnetospheric processes (see, e.g., Kaspi, Roberts & Harding 2004, for a review). At low X-ray energies, this thermal emission shows broad pulses of low amplitude. In contrast, highly modulated non-thermal X-rays showing narrow pulses are thought to arise from synchrotron emission in the magnetosphere (e.g., Cheng & Zhang, 1999; Becker & Aschenbach, 2002). Thus, X-ray studies of radio pulsars are an excellent diagnostic of the physics governing NS emission.
PSR J1119–6127 was discovered in the Parkes Multibeam Pulsar Survey (Camilo et al., 2000). It has a spin period = 0.408 s 1/ and period derivative = 4.110-12. The measured braking index for the pulsar of = 2.910.05 ( ) implies an upper limit for the age of 1,700 yr, making it one of the youngest pulsars known. The pulsar has a spin-down luminosity of = 4/ = 2.31036 erg s-1 (for a moment of inertia 1045 g cm2) and an inferred surface dipole magnetic field strength of 3.21019()1/2 G = 4.11013 G. This value of is among the highest known in the radio pulsar population. PSR J1119–6127 powers a small () X-ray pulsar wind nebula (PWN, Gonzalez & Safi-Harb, 2003) and lies close to the center of the -diameter supernova remnant (SNR) G292.2–0.5 (Crawford et al., 2001; Pivovaroff et al., 2001). HI absorption measurements imply a kinematic distance for the remnant of 8.40.4 kpc (Caswell et al., 2004), in agreement with estimates made from its location in the Carina spiral arm (Camilo et al., 2000).
Here we report on XMM–Newton observations of PSR J1119–6127 and SNR G292.2–0.5. The X-ray emission from PSR J1119–6127 shows a high-temperature thermal spectrum having a high pulsed fraction at low energies. No pulsations are detected at high energies. These characteristics are unlike those of other radio pulsars detected at X-ray energies. We discuss the possible origins of this emission. A detailed analysis of SNR G292.2–0.5 is deferred to a future paper.
2. Observation and Imaging Analysis
SNR G292.2–0.5 and PSR J1119–6127 were observed with XMM–Newton on 2003 June 26. The European Photon Imaging Camera (EPIC) instruments MOS and PN were operated in full-window and large-window mode, respectively, using the medium filter for both. The temporal resolution was 2.6 s for MOS and 48 ms for PN. The data were analysed using the Science Analysis System software (SAS v6.2.0) and standard reduction techniques. The last 5 ks of the PN observation were rejected due to high radiation. The resulting exposure time was 48 ks for MOS1/MOS2 and 43 ks for PN.
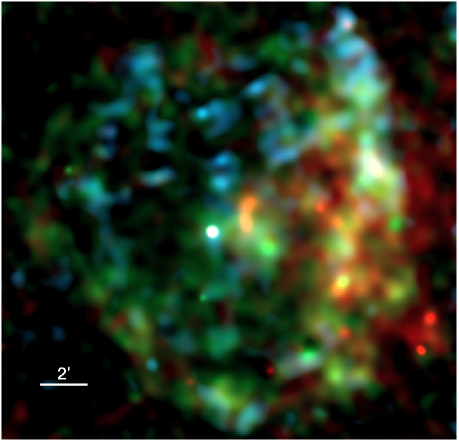
Figure 1 shows the combined MOS image of the system in the 0.3–1.5 keV (red), 1.5–3.0 keV (green) and 3.0–10.0 keV (blue) bands. Individual MOS1/MOS2 images were first binned into pixels of 2525 and other point sources in the field were excluded. These images were then added and adaptively smoothed with a Gaussian with =5′′–15′′ to obtain signal-to-noise ratios higher than 3. Background images and exposure maps at each energy band were similarly obtained and used to correct the final images. The detailed spatial distribution in the 3.0–10.0 keV (blue) image should be examined with caution as this energy band suffered from a high degree of stray-light contamination on XMM–Newton’s mirrors from a nearby high-energy source. Here we focus on the bright source at the center of Fig. 1, which has coordinates =11h19m1465 and =6127′502 (4′′ error). This position coincides with the Chandra and radio coordinates of PSR J1119–6127. The spatial resolution of XMM–Newton (half-power diameter of 15′′) does not allow for the arc-second scale PWN discovered with Chandra to be resolved.
3. Timing Analysis
The PN data were used to search for pulsations from PSR J1119–6127. Examining the raw event list as in Woods et al. (2004) revealed an instrumental timing anomaly that resulted in time tags being shifted forward by 1 s for events detected after the anomaly took place. We corrected for this by subtracting 1 s from the original time stamps and from the auxiliary PN file (*AUX.FIT) for the observation. The corrected dataset was then converted to the solar system barycenter.
A circular region of 25′′ radius was used to extract the pulsar events. The data were divided into different energy ranges at 0.5–10.0 keV (62030 photons), 0.5–2.0 keV (34025 photons) and 2.0–10.0 keV (27522 photons). From an updated radio ephemeris obtained from regular monitoring at the Parkes radio telescope, the predicted barycentric radio period for the middle of our observation (MJD 52816.54) was 2.44972914 Hz. The test (Buccheri et al., 1983) with harmonics = {1,2,4,8} was used to search for pulsations. The most significant signal was detected in the 0.5–2.0 keV range with = 52.8 (6.6 significance) at a frequency of 2.449726(6) Hz (1 errors). This frequency is in agreement with the radio prediction for PSR J1119–6127. In the 2.0–10.0 keV range, no signal was found with a significance 2.8. In the 0.5–10.0 keV range, the above signal was detected with a 5.2 significance.
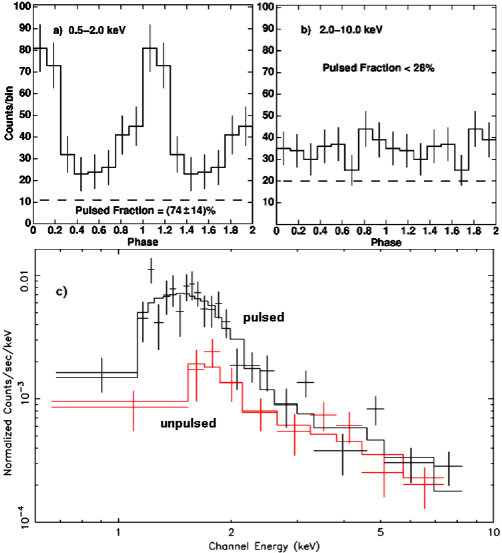
Figure 2 shows the resulting pulse profiles at 0.5–2.0 keV (top, left) and 2.0–10.0 keV (top, right). The background was estimated from a nearby region away from bright SNR knots. The horizontal dashed lines represent our estimates for the contribution from the pulsar’s surroundings (see §5.1). The resulting pulsed fraction [PF (–)/(+)] is labeled in Fig. 2 (1 statistical errors). In the 2.0–10.0 keV range, we derive an upper limit for the pulsed fraction of 28% (at the 99% confidence level). For this, we used the maximum power obtained from a Fourier analysis of the data for a small range of frequencies centered on the radio prediction (within our errors) and assumed a worse-case sinusoidal profile. An upper limit for the pulse amplitude can then be derived by calculating an upper limit on the power that could still be present above the observed maximum at a specific level of confidence. For a detailed description of this method we refer to Vaughan et al. (1994), and e.g., Ransom et al. (2002).
The pulse profile in the 0.5–2.0 keV range shows a single, narrow pulse with a high PF = (7414)%. We then modeled the profile with a 1-D gaussian using Sherpa (v.3.2.0). The best-fit value for the full-width at half maximum was 0.26 (1 errors) with (dof) = 2.1(4) and a probability of 0.72. A sinusoidal model resulted in (dof) = 8.9(5) with a probability of 0.11. Due to the limited statistics available, the gaussian fit is preferred with a probability of only 2.310-2 (according to the -test). Additional X-ray observations at higher resolution are needed to further constrain the pulse shape.
Correlating the times of arrival for the radio pulse at 1.4 GHz with the X-ray pulse, we find that the radio peak arrives 26 ms before the centre of the X-ray peak (with 3 ms uncertainty). This corresponds to phase 0 in the pulse profiles of Fig. 2. Taking into account the low temporal resolution of the XMM–Newton observation (phase bin width of 51 ms), this result suggests that the radio peak is in phase with the X-ray peak within our uncertainties, or possibly just slightly ahead. In addition, although it is unlikely that the EPIC-PN timing anomaly present during the observation affected the absolute timing (XMM–Newton HelpDesk, private communication), we regard this result with caution until it can be confirmed.
4. Spectral Analysis
The EPIC data were used to perform a spectral analysis of PSR J1119–6127. Circular regions with radii of 20′′ and 25′′ were used for MOS and PN, encompassing 75% and 78% of the source photons, respectively. The derived fluxes have been corrected accordingly. Background regions were chosen from nearby areas away from bright SNR knots. The spectra were fit in the 0.5–10.0 keV range using XSPEC (v.11.3.0) with a minimum of 20 counts per bin from a total of 24019, 21018, and 62030 background-subtracted counts in MOS1, MOS2 and PN, respectively.
One-component models were first fit to the phase-averaged MOS and PN data. A power-law model provided a better fit than a thermal blackbody model (BB), giving (dof) = 113(68) and (dof) = 180(68), respectively. However, it was evident from the fit residuals and the improvement in that two-component models were needed in order to describe the low and high energy portions of the spectra. The derived fits from two-component models are summarised in Table 1. In these fits, a non-thermal power-law component with photon index 1.5 described the high-energy emission in the spectra well. In turn, various models were used to describe the low-energy emission. A magnetised hydrogen atmosphere model (Atm; Zavlin et al., 1996) required a small distance of 2 kpc to account for the observed emission (or conversely an implausibly large emitting radius of 27 km at 8.4 kpc, 1 range). Such a small distance can be ruled out from HI absorption measurements (Caswell et al., 2004). Currently available (non-magnetic) atmosphere models of higher metallicity (Gänsicke et al., 2002) were also used and found to produce poor fits to the observed emission. At a fixed distance of 8.4 kpc, the derived temperatures were 1.9 MK [(dof)=85(67)] and 1.2 MK [(dof)=114(67)] for solar and pure iron compositions, respectively. However, when the distance was allowed to be a free parameter, the models converged to unrealistic values (e.g., 200 pc for temperatures 1.4 MK) with no improvement on the resulting .
We also extracted PN spectra from the “pulsed” and “unpulsed” regions of the pulse profile, at phases 0.7–1.3 (43028 counts) and 0.3–0.7 (20020 counts), respectively. These spectra are shown in Figure 2 (bottom) and were well fit by two-component models that agree with those derived for the phase-averaged spectra. For example, a blackbody plus power-law model yielded = 2.80.4 MK and = 1.4 (1 errors). The main difference between the pulsed and unpulsed spectra was found to be the relative contributions of the model components. The pulsed spectrum is dominated by the soft component below 2 keV, where it contributes 85% (90%) of the absorbed (unabsorbed) flux. In turn, the unpulsed spectrum is dominated by the hard, power-law component even below 2 keV, where it contributes 65% (55%) of the absorbed (unabsorbed) flux. For both pulsed and unpulsed spectra, the power-law component contributes 90% of the flux above 2 keV (either absorbed or unabsorbed).
5. Discussion
5.1. Emission Characteristics
The XMM–Newton observation of PSR J1119–6127 allowed us to detect, for the first time, X-ray pulsations from this high-magnetic-field pulsar. The pulsations are only detected in the 0.5–2.0 keV range with a single, narrow peak and a very high pulsed fraction of (7414)%.
The emission detected within the XMM–Newton extraction regions is a combination of pulsar, PWN and diffuse SNR emission (see Fig. 1). In addition, the derived spectra from these regions are well fit by two-component models. We then argue that the hard spectral component detected arises primarily from the pulsar’s surroundings and not from the NS itself. Using a high-resolution archival Chandra observation of the field (see Gonzalez & Safi-Harb, 2003), we estimate that the PWN plus SNR emission within a radius, excluding the pulsar, is well described by a power-law model with =1.8 and unabsorbed flux in the 0.5–10.0 keV range of 0.910-13 erg s-1 cm-2 (1 errors). These values are in good agreement with the hard, power-law component shown in Table 1. Although a small contribution from the pulsar to this hard emission cannot be ruled out, it would not affect our results on the pulsar’s soft emission.
The soft component detected with XMM–Newton must then arise from PSR J1119–6127, as is further supported by the pulsed emission having a distinctly soft spectrum (see §4). Such emission is unlikely to have a non-thermal origin. Non-thermal X-rays from radio pulsars have photon indices in the range 0.52.7 (e.g., Gotthelf, 2003). Synchrotron emission models due to accelerated particles in the magnetosphere predict 2 (e.g., Cheng & Zhang, 1999; Rudak & Dyks, 1999). The soft component of the pulsed emission from PSR J1119–6127, if interpreted as non-thermal, has a steeper spectrum (=6.50.9) than those observed or predicted and would imply an acceleration mechanism that cannot be achieved with current models.
The derived blackbody temperature for PSR J1119–6127 of = 2.4 MK is among the highest seen for radio pulsars. Although it is similar to those found in a few other pulsars, none of them exhibits a higher temperature at statistically significant levels (e.g, PSR J0218+4232 has a characteristic age of = /2 = 5.1108 yr and a blackbody temperature of = 2.90.4 MK; Webb et al., 2004). In addition, PSR J1119–6127 is now the youngest radio pulsar from which thermal emission has been detected, the next youngest being Vela ( = 11 kyr) with a blackbody temperature = 1.470.06 MK (Pavlov et al., 2001). For comparison, the young Crab pulsar ( = 1.3 kyr) and PSR J0205+6449 ( = 5.4 kyr, in the SNR 3C 58) have upper limits on the possible blackbody emission from their entire surface of 1.97 MK (Weisskopf et al., 2004) and 1.02 MK (Slane et al., 2004), respectively, at the 3 confidence level.
The observed pulsed fraction for the thermal emission in PSR J1119–6127 is also higher than those of other radio pulsars. Sources for which the thermal emission arises from the entire surface or from localized regions show pulsed fractions at low energies of 42% (e.g., Pavlov et al., 2001; Pavlov et al., 2002; Becker & Aschenbach, 2002). The narrow peak in the pulse profile also appears to differ from the broad pulsations seen in thermal emission from radio pulsars at low energies. Although a multi-component pulse profile (e.g., sine curve plus a narrow peak) in the 0.5–2.0 keV range cannot be ruled out for PSR J1119–6127 and requires additional observations, we expect any pulse components to show a soft spectrum consistent with the 3 values in Table 1 and the narrow component to exhibit a high PF 50%.
5.2. Thermal Emission Mechanisms
We first consider the observed characteristics in light of conventional models for NS emission. Thermal emission from polar-cap reheating, due to return currents from the “outer gap” (Cheng & Zhang, 1999) or from close to the polar cap (Harding & Muslimov, 2001), is expected to have an X-ray luminosity of 10-5 in young sources. This is at least 2 orders of magnitude below our value for the luminosity of 0.910-3 (see Table 1, BB+PL model). In addition, although polar-cap reheating has been proposed to explain similar characteristics to that of PSR J1119–6127 in some older pulsars ( 1 Myr, e.g., Becker & Aschenbach, 2002), such emission implies much smaller emitting areas (radius 1 km, see e.g., Webb et al., 2004).
Thermal emission may also arise from the entire surface of the NS due to initial cooling. While the observed blackbody luminosity is in line with predictions from cooling models, the observed blackbody temperature is slightly higher than predicted (1.8 MK, e.g., Yakovlev et al., 2004) and the blackbody radius of = 3.4 km (3 errors) is smaller than allowed from NS equations of state (12 km, Lattimer & Prakash, 2000). The surface temperature can be made more consistent with those expected from initial cooling if a hydrogen atmosphere model is used (see Table 1, and e.g., Pavlov et al., 2002). However, a recent study argues that hydrogen cannot be maintained long-term in atmospheres of NSs having magnetic fields as high as that of PSR J1119–6127 due to diffusive nuclear burning, with only heavier elements surviving long-term (Chang et al., 2004). Regardless of this, atmospheric models result in high values and/or problematic estimates for the distance/emitting area (see §4).
If the thermal emission originates from the entire surface due to initial cooling, the pulse profile and pulsed fraction in particular are highly problematic, as low amplitude, broad, sinusoidal profiles are expected (e.g., Becker & Aschenbach, 2002; Pavlov et al., 2002). The surface brightness distribution on a highly magnetic star cannot produce pulsed fractions higher than 37% due to General Relativistic light bending. This applies for all reasonable NS compactnesses ( /, the mass-to-radius ratio of the star), extreme viewing geometries and large beaming of the emergent radiation (DeDeo et al., 2001).
Larger pulsed fractions can be obtained if the emission arises from localized hot spots on a highly magnetised atmosphere. However, the possible physical mechanisms leading to this geometry are not well understood and has led to suggestions of, e.g., metallicity gradients on the surface due to magnetically channelled fallback material (Pavlov et al., 2000) or nonuniform heating of the atmosphere due to magnetic field decay (Thompson & Duncan, 1996). In any case, previous work suggests that if two (isotropic) antipodal hot spots are present, the large pulsed fraction in PSR J1119–6127 can only be achieved for extreme viewing geometries, extremely small or large NS compactnesses, and small spot sizes (Psaltis et al., 2000; Özel et al., 2001). These contraints are relaxed if a single hot spot is present on the surface, although it is particularly uncertain how such a geometry could be physically achieved; perhaps the NS has an off-centre magnetic dipole. Regardless of this, accounting for the higher effective temperature in PSR J1119–6127 than in other young pulsars is still an issue.
Currently, modelling of the resulting pulsed fraction from hot spots using appropriate atmospheric parameters for the case of PSR J1119–6127 is underway (W. Ho & P. Chang, private communication). Preliminary results suggest that improved atmospheric models and including effects from limb darkening due to magnetic fields can reproduce the observed pulsed fraction over a wider range of parameters for hot spot emission. However, broad pulsations are expected in this case and the physical origin for such spots is still uncertain.
Thus, understanding the thermal emission from PSR J1119–6127 in light of conventional NS emission mechanisms requires further theoretical studies to be made. Although the particular reason for such emission is not clear at present, it is likely to be related to the high inferred magnetic field, an unusual surface temperature distribution and/or an unusual beaming from the surface. The pulsar’s radio emission reveals nothing out of the ordinary that would hint at such peculiar X-ray properties. The X-ray characteristics distinguish PSR J1119–6127 from other radio pulsars detected at X-ray energies, even from those with similar spin characteristics (of which there are only a few). For example, PSR J1846–0258 in the SNR Kes 75 has almost identical spin properties ( = 0.324 sec, = 4.81013 G and age 1,000–1,700 yr). However, it is a bright X-ray source with a standard power-law spectrum with = 1.390.04 and broad pulse profile (Helfand et al., 2003; Mereghetti et al., 2002).
The emission observed from PSR J1119–6127 also allows us to consider alternate models from those of radio pulsars. For example, it has been proposed that some (and maybe all) neutron stars are quark stars (Witten, 1984), which are generally thought to cool faster than NSs or become indistinguishable from them after an initial fast cooling period (Weber, 2004). Quark stars can be kept hotter for longer by including the effects of pair formation from the surface, although the observed emission would harden and deviate largely from a blackbody (Page & Usov, 2002). This does not appear to be the case for PSR J1119–6127 as its spectrum is well described as a blackbody. Newly discovered photon emission processes are also expected to keep the star hot and conserve the blackbody spectrum (Vogt et al., 2004), but detailed models of the cooling history in this case are not currently available.
Unlike radio pulsars, the observed emission from “magnetars” is thought to be powered by the decay of an ultrastrong magnetic field (1014-15 G, Thompson & Duncan, 1995). The high thermal temperature and high pulsed fraction for PSR J1119–6127 is reminiscent of magnetar emission (see, e.g., Woods & Thompson, 2004, for a review). The high pulsed fraction and observed pulse profile for PSR J1119–6127, as well as for the Anomalous X-ray Pulsars, are consistent with magnetar models where the emission arises from a single hot spot on the surface (Özel et al., 2001; Özel, 2002), although, again, the reason for this geometry is unclear. These models also predict little dependence of the pulsed fraction with energy, which can be tested in PSR J1119–6127 with additional observations. However, unlike PSR J1119–6127, magnetars show a significant (pulsed) power-law contribution in their spectra, have X-ray luminosities much higher than the available rotational energy and, thus far, have not shown radio emission. To date, no other apparently high magnetic field radio pulsar has shown emission characteristics similar to that of magnetars (e.g., PSR J1814–1744, Pivovaroff et al. 2000; PSR J1846–0258, Helfand et al. 2003; PSR J1718–3718, Kaspi & McLaughlin 2004), although it has been suggested that they represent magnetars in quiescence (Kaspi & McLaughlin, 2004).
References
- Becker & Aschenbach (2002) Becker, W., & Aschenbach, B. 2002, in Proc. 270th WE-Heraeus Seminar on Neutron Stars, Pulsars, and Supernova Remnants, ed. W. Becker, H. Lesch, & J. Trümper (MPE Rep. 278; Garching: MPE), 64 (astro-ph/0208466)
- Buccheri et al. (1983) Buccheri, R., et al. 1983, A&A, 128, 245
- Camilo et al. (2000) Camilo, F., et al. 2000, ApJ, 541, 367
- Caswell et al. (2004) Caswell, J. L., McClure-Griffiths, N. M., & Cheung, M. C. M. 2004, MNRAS, 352, 1405
- Chang et al. (2004) Chang, P., Arras, P., & Bildsten, L. 2004, ApJ, 616, L147
- Cheng & Zhang (1999) Cheng, K. S., & Zhang, L. 1999, ApJ, 515, 337
- Crawford et al. (2001) Crawford, F., et al. 2001, ApJ, 554, 152
- DeDeo et al. (2001) DeDeo, S., Psaltis, D., & Narayan, R. 2001, ApJ, 559, 346
- Gänsicke et al. (2002) Gänsicke, B. T., Braje, T. M., & Romani, R. W. 2002, A&A, 386, 1001
- Gonzalez & Safi-Harb (2003) Gonzalez, M., & Safi-Harb, S. 2003, ApJ, 591, L143
- Gotthelf (2003) Gotthelf, E. V. 2003, ApJ, 591, 361
- Harding & Muslimov (2001) Harding, A. K., & Muslimov, A. G. 2001, ApJ, 556, 987
- Helfand et al. (2003) Helfand, D. J., Collins, B. F., & Gotthelf, E. V. 2003, ApJ, 582, 783
- Kaspi & McLaughlin (2004) Kaspi, V. M., & McLaughlin, M. A. 2004, ApJ, in press
- Lattimer & Prakash (2000) Lattimer, J. M., & Prakash, M. 2000, PhR, 333, 121
- Mereghetti et al. (2002) Mereghetti, S., Bandiera, R., Bocchino, F., & Israel, G. L. 2002, ApJ, 574, 873
- Özel et al. (2001) Özel, F., Psaltis, D., & Kaspi, V. M. 2001, ApJ, 563, 255
- Özel (2002) Özel, F. 2002, ApJ, 575, 397
- Page & Usov (2002) Page, D., & Usov, V. V. 2002, Phys. Rev. Lett., 89, 131101
- Pavlov et al. (2000) Pavlov, G. G., et al. 2000, ApJ, 531, L53
- Pavlov et al. (2002) Pavlov, G. G., Zavlin, V. E., & Sanwal, D. 2002, in Proc. 270th WE-Heraeus Seminar on Neutron Stars, Pulsars, and Supernova Remnants, ed. W. Becker, H. Lesch, & J. Trümper (MPE Rep. 278; Garching: MPE), 273 (astro-ph/0206024)
- Pavlov et al. (2001) Pavlov, G. G., et al. 2001, ApJ, 552, L129
- Pivovaroff et al. (2001) Pivovaroff, M. J., et al. 2001, ApJ, 554, 161
- Psaltis et al. (2000) Psaltis, D., Özel, F., & DeDeo, S. 2000, ApJ, 544, 390
- Ransom et al. (2002) Ransom, S. M., Eikenberry, S. S., & Middleditch, J. 2002, AJ, 124, 1788
- Rudak & Dyks (1999) Rudak, B., & Dyks, J. 1999, MNRAS, 303, 477
- Slane et al. (2004) Slane, P., Helfand, D. J., van der Swaluw, E., & Murray, S. S. 2004, ApJ, 616, 403
- Thompson & Duncan (1995) Thompson, C., & Duncan, R. C. 1995, MNRAS, 275, 255
- Thompson & Duncan (1996) Thompson, C., & Duncan, R. C. 1996, ApJ, 473, 322
- Vaughan et al. (1994) Vaughan, B. A., et al. 1994, ApJ, 435, 362
- Vogt et al. (2004) Vogt, C., Rapp, R., & Ouyed, R. 2004, Nuclear Physics A, 735, 543
- Webb et al. (2004) Webb, N. A., Olive, J.-F., & Barret, D. 2004, A&A, 417, 181
- Weber (2004) Weber, F. 2004, To appear in “Progress in Particle and Nuclear Physics”. (astro-ph/0407155).
- Weisskopf et al. (2004) Weisskopf, M. C., et al. 2004, ApJ, 601, 1050
- Witten (1984) Witten, E. 1984, Phys. Rev. D, 30, 272
- Woods et al. (2004) Woods, P. M., et al. 2004, ApJ, 605, 378
- Woods & Thompson (2004) Woods, P. M., & Thompson, C. 2004, in Compact Stellar X-ray Sources, ed. W. H. G. Lewin & M. van der Klis (UK: Cambridge University Press), in press (astro-ph/0406133)
- Yakovlev et al. (2004) Yakovlev, D. G., et al. 2004, Advances in Space Research, 33, 523
- Zavlin et al. (1996) Zavlin, V. E., Pavlov, G. G., & Shibanov, Y. A. 1996, A&A, 315, 141
| PL + PL | BB + PL | Atmaa The atmospheric model was computed with =1013 G and pure hydrogen composition. The local values for the temperature, , and radius, = 10 km, of the star have been redshifted to infinity according to = (12/)1/2 and = (12/)-1/2, with = 1.4 . + PL | |
|---|---|---|---|
| Parameter | (1) | (1) | (1) |
| (1022 cm-2) | 2.3 | 1.6 | 1.9 |
| (dof) | 79(66) | 78(66) | 78(66) |
| Soft component characteristics | |||
| or | 6.50.9 | 2.4 MK | 0.90.2 MK |
| (km) | … | 3.4 | 12 (fixed) |
| (kpc) | 8.4 (fixed) | 8.4 (fixed) | 1.6 |
| bb The 0.5–10.0 keV absorbed and unabsorbed fluxes, and , have units of ergs s-1 cm-2. The 0.5–10.0 keV X-ray luminosity, , at the distance , is in units of ergs s-1. (10-14) | 2.1 | 1.5 | 1.7 |
| bb The 0.5–10.0 keV absorbed and unabsorbed fluxes, and , have units of ergs s-1 cm-2. The 0.5–10.0 keV X-ray luminosity, , at the distance , is in units of ergs s-1. (10-13) | 63 | 2.4 | 7.2 |
| bb The 0.5–10.0 keV absorbed and unabsorbed fluxes, and , have units of ergs s-1 cm-2. The 0.5–10.0 keV X-ray luminosity, , at the distance , is in units of ergs s-1. (1033) | 53 | 2.0 | 0.22 |
| Hard component characteristics | |||
| 1.3 | 1.5 | 1.5 | |
| bb The 0.5–10.0 keV absorbed and unabsorbed fluxes, and , have units of ergs s-1 cm-2. The 0.5–10.0 keV X-ray luminosity, , at the distance , is in units of ergs s-1. (10-14) | 7.1 | 7.4 | 7.3 |
| bb The 0.5–10.0 keV absorbed and unabsorbed fluxes, and , have units of ergs s-1 cm-2. The 0.5–10.0 keV X-ray luminosity, , at the distance , is in units of ergs s-1. (10-13) | 1.0 | 1.1 | 1.1 |
| bb The 0.5–10.0 keV absorbed and unabsorbed fluxes, and , have units of ergs s-1 cm-2. The 0.5–10.0 keV X-ray luminosity, , at the distance , is in units of ergs s-1. (1033) | 0.8 | 0.9 | 0.040.02 |