The Physical Natures of Class I and Flat-Spectrum Protostellar Photospheres: A Near-Infrared Spectroscopic Study111Data presented herein were obtained at the W.M. Keck Observatory from telescope time allocated to the National Aeronautics and Space Administration through the agency’s scientific partnership with the California Institute of Technology and the University of California. The Observatory was made possible by the generous financial support of the W.M. Keck Foundation.
Abstract
We present high resolution (R 18,000), high signal-to-noise, 2 m spectra of 52 infrared-selected Class I and flat-spectrum young stellar objects in the Taurus-Auriga, Ophiuchi, Serpens, Perseus, and Corona Australis dark clouds. We detect key absorption lines in 41 objects and fit synthetic spectra generated from pre-main sequence models to deduce the effective temperatures, surface gravities, near-infrared veilings, rotation velocities, and radial velocities of each of these 41 sources. We find these objects to span ranges in effective temperature, surface gravity, and stellar luminosity which appear similar to those of late spectral-type Class II sources and classical T-Tauri stars. However, due to significant but uncertain corrections for scattering and extinction, the derived luminosities for the embedded protostellar objects must be regarded as being highly uncertain. We determine that the mean 2 m veiling of Class I and flat-spectrum objects is significantly higher than that of Class II objects in the same region where both types of objects are extensively observed ( Oph). We find a significant fraction of our protostellar sample also exhibits emission lines. Twenty-three objects show H2 emission, usually indicative of the presence of energetic outflows. Thirty-four sources show HI Br emission and a number of these exhibit profile asymmetries consistent with in-fall. Eight sources show significant CO emission suggestive of emission from a circumstellar disk. Overall, these observations indicate that Class I and flat-spectrum objects are self-embedded protostars undergoing significant mass accretion, although the objects appear to span a broad range of mass accretion activity.
1 Introduction
The quest to identify and understand protostars has long been a key but stubborn problem for star formation research (Spitzer, 1948; Larson, 1969; Wynn-Williams, 1982; Shu et al., 1987). The primary factor hindering the investigation of protostellar objects has been the fact that such sources are deeply embedded in dusty molecular gas and are heavily extincted. As a result most of the luminosity generated by a protostar is absorbed and scattered by dust and radiated in the infrared, rendering the object very difficult, if not impossible, to detect at optical wavelengths. Consequently, progress toward achieving a physical understanding of the nature of protostars had to wait for the development of observing capabilities at longer wavelengths.
Significant progress in understanding the physical nature and evolutionary status of protostars has been achieved from measurements of the broadband photometric infrared spectral energy distributions (SEDs) of low-luminosity young stellar objects (YSOs) in star forming molecular clouds (Wilking & Lada, 1983; Lada, 1987; Adams et al., 1987; André et al., 1993). These studies established that the shape of the SED of a YSO is linked to its evolutionary state. Class I (and Class 0) sources were characterized by strong infrared excesses and steeply rising SEDs from near- to far-infrared wavelengths. These sources were found to be distinctly different from Class II sources. These latter objects were characterized by smaller infrared excesses and SEDs that decreased from near- to far-infrared wavelengths and could be well-explained by models of pre-main sequence (PMS) stars surrounded by circumstellar disks (i.e. classical T-Tauri stars). Class II sources, in turn, were differentiated from Class III sources which displayed no infrared excess and whose SEDs could be explained by normal stellar photospheres of classical PMS stars. Class I SEDs were found to be consistent with, and well-fit by, theoretical models of protostellar envelopes. Moreover, other lines of evidence, such as the intimate association of Class I (and 0) sources with molecular outflows, molecular hydrogen emission, FU Ori phenomenon, etc. strongly suggested an extreme youth and possibly protostellar nature for these objects.
Little is known about the underlying stellar component of protostars since these objects are typically undetectable in visible light rendering the traditional methods of optical spectroscopy that are used to measure stellar physical properties not generally applicable. However advances in technology over the past dozen years have enabled spectroscopic observations of Class I sources at near-infrared wavelengths. In a pioneering paper, Casali & Matthews (1992) obtained low resolution (R 300) spectra at 2 m of a sample of ten bright Class I and Class II sources in Ophiuchus and found Class I sources to exhibit a featureless continuum, unlike Class II sources which displayed photospheric absorption lines. This result was confirmed by a subsequent low resolution (R 500) near-infrared spectroscopic survey of a significantly larger sample of 100 low luminosity YSOs in Ophiuchus and Taurus (Greene & Lada, 1996). The absence of photospheric absorption lines in Class I sources was interpreted as being the result of high veiling due to strong infrared excess emission produced by disk accretion and reprocessing in circumstellar envelopes. This provided strong supporting evidence for a protostellar nature for Class I objects. However, the high veilings of Class I sources indicated that very high signal-to-noise and high spectral resolution observations would be required to detect photospheric features and measure the physical parameters of the embryonic stellar core at the heart of a protostellar object.
Greene & Lada (1997, 2000) obtained the first such deep and high resolution (R 20,000) infrared spectra and detected photospheric absorption features in a sample of several flat-spectrum protostars. These embedded sources exhibit SEDs with shapes between those of Class I and II objects and are believed to be in transition between the Class I and II evolutionary states. Flat-spectrum sources are likely to be extremely young and can be considered the least obscured candidate protostars. These objects were found to have late (M0 or later) spectral-types confirming their nature as low mass stellar objects and to be relatively fast rotators compared to Class II sources, an unexpected result. Greene & Lada (2000) also obtained spectra of five Class I sources, and all presented featureless spectra indicating that even more sensitive infrared observations would be necessary to detect the photospheres of these objects. Using the 10 meter Keck telescope, Greene & Lada (2002) were able to obtain yet deeper observations and detect the first photospheric absorption lines in a heavily veiled accreting protostellar source, YLW 15. These observations enabled determinations of the central source’s spectral-type, veiling, stellar luminosity and allowed its placement on the Hertzsprung-Russell (H-R) diagram.
Although most Class I sources are deeply buried in dusty envelopes, visible light scattered off cavities in these envelopes can in some cases be detected at optical wavelengths with large ground-based telescopes. Kenyon et al. (1998) performed an I-band spectroscopic survey of 13 Class I sources in Taurus that were optically visible. They were able to detect photospheric features in 5 of these sources and found them to display late (M) spectral-types and to lie in the same general region of the H-R diagram as Class II sources. The optically-selected sample of Taurus Class I sources also did exhibit stronger and more frequent forbidden-line emission than Class II sources, suggesting higher mass outflow and accretion rates. A recent higher resolution, more sensitive optical spectroscopic survey of optically detected Class I sources in Taurus by White & Hillenbrand (2004) produced spectral-types of 11 objects and generally confirmed the trends observed by Kenyon et al. (1998), although the White & Hillenbrand (2004) observations suggest similar accretion and rotation rates for Class I and II objects in their sample. These observations suggest that optically detectable Class I sources may be in a more advanced state of evolution than the more common optically invisible Class I protostars which are more deeply embedded.
Sensitive high resolution infrared and optical spectroscopy of flat-spectrum and Class I sources represent a significant advance in protostellar studies and clearly have demonstrated the utility and potential of such observations for investigating protostellar evolution. A number of interesting issues have been raised by these observations. Do the optically detectable Class I sources represent the end stages of protostellar evolution? Are their physical properties similar to those of the optically invisible Class I objects or is there a significant range in evolutionary states among Class I objects from accretion active to accretion anemic objects?
To better define the physical properties and nature of Class I sources and achieve a more complete understanding of protostellar evolution we have conducted the first extensive and systematic near-infrared spectral survey of deeply embedded Class I and flat-spectrum objects carried out at high resolution and with the high sensitivity afforded by a 10 meter class telescope. We were able to obtain high quality spectra for more than 50 Class I and flat-spectrum sources in three nearby regions of active star formation. Photospheric absorption features were detected with good signal-to-noise in the vast majority of these sources. In order to derive the physical parameters that characterize these young stellar objects we have employed synthetic model atmospheres following the techniques successfully developed by Doppmann & Jaffe (2003) (hereafter DJ03) in their recent study of infrared Class II sources in Ophiuchus (Doppmann, Jaffe, & White, 2003).
In this paper we present the basic observational results of the survey. In 2 we describe the instrumentation and observing procedures used to obtain our data and discuss our data reduction methods. In 3 we present the results and analysis of our observations. In 4 we discuss the implications for the nature of Class I and flat-spectrum sources in the context of protostellar evolution and in 5 we summarize the results and conclusions of this contribution. This paper is the first in a series of three papers dealing with the results of our survey. Two subsequent papers will respectively deal with the analysis of the rotational properties (Covey et al., 2005a) and radial velocities (Covey et al., 2005b) of this sample.
2 Observations and Data Reduction
2.1 Sample Selection
YSOs were selected from nearby star forming regions of Oph, Taurus, Serpens, Perseus, and Corona Australis using the following criteria: (1) objects with rising or flat spectral energy distributions across 2 – 10 m, indicative of excess emission at infrared wavelengths (); and (2) except for a few fainter sources in Ophiuchus, our targets were generally K 11, in order to obtain high signal-to-noise spectra (S/N 100) in a reasonable amount of time ( 120 minutes) at the telescope. In total, our sample was comprised of 52 flat-spectrum or Class I protostars: 2 in Perseus, 13 in Taurus, 20 in Ophiuchus, 13 in Serpens, and 4 in Corona Australis (Table 1). These sources were selected from Wilking et al. (1989, 1992); Ladd, Lada, & Myers (1993); Greene et al. (1994); Kenyon & Hartmann (1995); Kaas et al. (2004). In addition, 28 late-type giant and dwarf MK spectral standards were observed for calibration of our spectral synthesis models.
2.2 Spectroscopic Observations
Near-IR spectra of the protostellar sample and MK spectral standards were acquired on 2000 May 29 – 30, 2001 July 7 – 10, 2001 November 4 – 6, and 2003 June 19 – 21 UT. All data were acquired with the 10-m Keck II telescope on Mauna Kea, Hawaii, using the NIRSPEC multi-order cryogenic echelle facility spectrograph (McLean et al., 1998). Spectra were acquired with a 058 (4 pixel) wide slit, providing spectroscopic resolution = 18,000 (16.7 km s-1). The plate scale was 020 pixel-1 along the 12 slit length, and the seeing was typically 05 – 06. The NIRSPEC gratings were oriented to allow orders containing the 2.1066 m Mg and 2.1099 m Al lines, the 2.1661 m HI Br line, the 2.2062 and 2.2090 m Na lines, and the 2.2935 m CO bandhead regions to fall onto the instrument’s 1024 1024 pixel InSb detector array. The instrument’s NIRSPEC-7 blocking filter was used to image these orders on the detector. NIRSPEC was configured to acquire simultaneously multiple cross-dispersed echelle orders 31 – 36 (2.08 – 2.45 m, non-continuous) for most objects, but some objects were observed in orders 32 – 38 (1.97 – 2.38 m, non-continuous). Each order had an observed spectral range ( 4450 km s-1).
The internal instrument rotator was used to maintain a fixed position angle on the sky when observing on 2000 May 29 – 30. Unfortunately vibration from the rotator caused slight changes in the echelle grating angle during those nights, but we removed the resultant wavelength shifts during the data reduction process. The slit was held physically stationary and thus allowed to rotate on the sky (as the non-equatorially-mounted telescope tracked) when observing at all other times. Data were acquired in pairs of exposures of durations from less than 1 second (for giant MK standards) to up to 900 s (for the protostars) each, with the telescope nodded along the slit between frames so that object spectra were acquired in all exposures. Early-type (B7 – A2) dwarfs were observed for telluric correction of the protostellar and MK standard stellar spectra. The telescope was automatically guided with frequent images from the NIRSPEC internal SCAM IR camera during all exposures of more than several seconds duration. Spectra of the internal NIRSPEC continuum lamp were taken for flat fields, and exposures of the Ar, Ne, Kr, and Xe lamps were used for wavelength calibrations. The observation dates, total integration times, signal-to-noise, and other parameters of the observed objects are given in Table 1.
2.3 Data Reduction
All data were reduced following standard procedures with IRAF packages (Massey et al., 1992; Massey, 1997). Bad pixels and cosmic rays were removed with the COSMICRAY task – images were cleaned once to remove cosmic rays and bad pixels, then inverted and cleaned again to remove cold pixels before being returned to positive flux. Frames were then flatfield divided and sky subtracted before spectra were extracted with the APALL task. Extracted spectra were wavelength calibrated using 4th order fits to lines in arc lamp exposures, and all spectra of objects at the same slit position and similar airmasses were coadded. Instrument vibration during the May 2000 observing run caused the echelle grating to shift slightly between lamp and object spectra exposures. Corrections for the shift of the wavelength solution between objects were applied by using the FXCOR task to find the pixel shift between object spectra and telluric standards observed closely after lamp spectra. This appears to have improved the wavelength solutions of the May 2000 data considerably, but radial velocities derived for objects observed during May 2000 will be significantly more uncertain than those objects observed on later runs.
Instrumental and telluric features were removed by dividing wavelength calibrated object spectra by spectra of early type stars observed at similar airmass and slit position. Spectral orders containing the HI Br line (2.1661 m) were corrected for telluric absorption with the use of the XTELLCOR IDL routine developed by Vacca et al. (2003). This routine creates and then removes a pure telluric spectrum generated by dividing an observed early-type stellar spectrum by a synthetic model of Vega (modified to include line broadening). Combined spectra were then produced by summing the spectra of both slit positions for each object. Wavelength shifts have not been applied to correct for Earth and solar system motions; rather, radial velocities have been measured and then converted to radial velocities with respect to the local standard of rest. Finally, the spectra of each wavelength sub-interval used in our analysis (see 3.2), was flattened and continuum normalized to one by linear function, so as to be directly comparable to the intrinsically flat continua of our synthesis models.
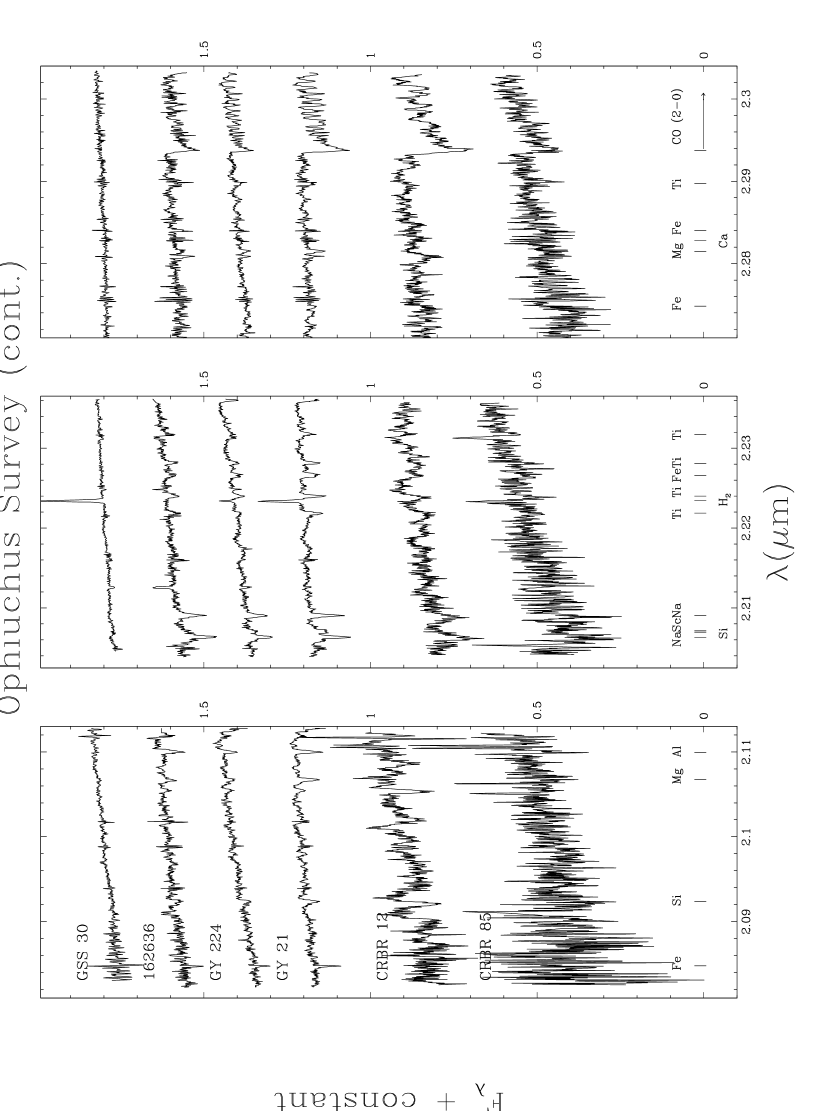
In order to view the true continuum shape within the three K-band orders where we analyze photospheric lines, we multiply the spectra of our YSOs and MK standards by a 10,000 K blackbody following the telluric division by a hot (B7 – A2) telluric standard star. All these spectra are displayed in Appendix B (Figs. 1 – 8).
3 Results and Analysis
3.1 Basic Spectral Properties of Sample
Our high resolution spectra reveal numerous absorption and emission lines in our Class I and flat-spectrum sample (listed in Table 1). In 41/52 sources, we detect photospheric absorption lines ( 3.2) sufficient to carry out an analysis of their stellar properties. Additionally, ten of these sources show HI Br absorption, superposed on a Br emission peak in 6/10 cases (see 4.3). The existence of infrared emission lines indicative of accretion, in-fall, and outflows may distinguish between Class I and Class II YSO populations (Greene & Lada, 1996). Our flat-spectrum / Class I study shows the presence of such lines in some of our sample: 34/52 have HI Br , 8/52 show 12CO overtone emission, and 23/52 have H2 1-0 S(0) emission. Table 2 lists these statistics grouped by individual star forming region. In the 11 sources for which we do not detect photospheric lines sufficient for our following analysis, 10 show Br emission, while the remaining one (CRBR 85) has marginal CO absorption evident in its lower signal-to-noise spectrum.
In this Section 3, we describe the method by which we compare spectral synthesis models to observed protostellar spectra and produce the best multi-line fit to numerous K-band lines that diagnose fundamental stellar or circumstellar properties. In particular, the resolved line shapes, depths, and positions permit us to measure the effective temperature (Teff), surface gravity (), rotational broadening (), and radial velocity (vrad) of an embedded YSO, as well as the amount of continuum veiling (rK FKex/FK∗, the ratio of non stellar excess over the stellar flux at K) arising in its circumstellar disk. This method is based on a routine originally presented in DJ03, but has been substantially expanded to include simultaneous fitting of multiple wavelength regions and is thus discussed here in detail. 3.2 describes the photospheric lines utilized by this spectral fitting routine and the stellar parameters to which each line is most sensitive. 3.3 explains the creation of a grid of synthetic spectra for various values of Teff and , while 3.4 reviews the routine which extends the spectral grid to cover a range of , rK, and vrad, as well as selecting the set of parameters which minimizes the overall residuals between the model grid and the observed protostellar spectrum to find the best-fit stellar parameters. In 3.5 we explore the sensitivity of the model results to both random and systemic errors, while in 3.6 we verify the accuracy of the stellar parameters determined by the fitting routine for spectra of well-studied MK standards. 3.7 corrects the routine for a slight () bias in the detected radial velocity. Finally, in 3.8 we describe the way we derive stellar luminosities from photometry, pointing out issues and uncertainties associated with using this traditional approach for placing YSOs on the H–R diagram.
3.2 Diagnostic Lines
We focus our analysis on key diagnostic absorption lines whose sensitivity to stellar parameters we have identified and tested with late-type spectra of MK dwarfs and giants. The cross dispersed wavelength coverage afforded by NIRSPEC enables the detection of photospheric lines across multiple echelle orders. We select strong absorption lines of neutral metals and the molecular overtone band of (2-0) 12CO, present in three K-band echelle orders, to diagnose the physical state of our embedded protostars, by measuring effective temperature (Teff), surface gravity (), projected rotation (), continuum veiling (rK), and radial velocity (vLSR).
At 2.21 m (order 34), we utilize neutral atomic lines of Na, Si, and Sc (hereafter, the Na interval), proven diagnostics of Teff in MK standard stars (DJ03). At 2.11 m (order 36), lines of neutral Mg and Al (hereafter, the Mg/Al interval) are also present in K and M spectral-type stars, and are sensitive to changes in Teff and . The first overtone of the 12CO bandhead at 2.29 m (order 33, hereafter the CO interval) is also prominent in the photospheres of cool, late-type stars. Changes in Teff and affect the depth of the bandhead and R branch lines, without broadening the feature (i.e no pressure broadening). Furthermore, CO is not affected by Zeeman broadening seen in K-band atomic lines of T-Tauri stars with strong magnetic fields (Johns–Krull et al., 1999, 2001). Therefore, our most reliable measurement of in our protostars comes from spectral fits to the CO interval.
At cool effective temperatures (Teff: 3200K – 4500K) and sub-dwarf surface gravities (), the Na lines in the Na interval grow and broaden as Teff decreases and increases (see Figs. 5 & 6 in Appendix B). Conversely, the Mg lines (a close triplet) in the Mg/Al interval are degenerate between temperature and gravity, but in the opposite sense as are the Na lines (i.e. a decrease in Teff trades off with a decrease in gravity). Earlier studies have identified the strength of the CO overtone band at 2.2935 m as being diagnostic of luminosity and surface gravity (Baldwin et al., 1973; Kleinmann & Hall, 1986; Lancon & Rocca–Volmerange, 1992; Ramírez et al., 1997) in stars that have already evolved to the main-sequence and beyond, and in Class II PMS stars (DJ03) that are less likely to have contamination by CO emission arising from disks or in outflow winds. For our Class I and flat-spectrum YSOs, we avoid using fits to the CO interval to constrain temperature and gravity, since the strength of the bandhead absorption may be altered by non-stellar components.
3.3 A Grid of Synthetic Spectra
We develop a multi-parameter grid of synthetic spectra in which we search to find the best simultaneous fit to the wavelength intervals described in 3.2, extending the spectral fitting techniques pioneered by DJ03 to include these three distinct wavelength regions. The spectral synthesis code MOOG (Sneden, 1973) is used to generate a high resolution (R = 120,000) K-band spectrum of each wavelength interval based on LTE radiative transfer through a NEXTGEN (Hauschildt et al., 1999) stellar atmosphere profile (see DJ03). Each MOOG synthesis generates a model spectrum specific to a particular Teff, , and metallicity. We restrict our spectral search to objects with solar abundances (Padgett, 1996), though, in principle, spectral fits using metallicity as another free search parameter have potential for future work when more diagnostic lines are present.
Physical constants (i.e. oscillator strengths and damping coefficients) are needed in order to model the correct depth and width for each absorption line transition in the synthetic spectra. For our spectral syntheses in the Na and CO intervals, we use atomic and molecular line constants published by Kurucz (1994) and Goorvitch & Chackerian (1994), respectively. However, no published oscillator strengths or damping coefficients were available in the literature or on-line (i.e. VALD or NIST) for the Mg line transitions (3s4f3F–3s7g1G) at 2.1061 m in the Mg/Al interval. Therefore, we determined these values empirically by fine tuning the models to best fit our observed spectra of several MK standard stars for which Teff, , and [Fe/H] was known.
We use solar micro-turbulence values (1 km s-1), appropriate for our models of late-type stars with dwarf and sub-dwarf gravities (DJ03). Damping of the Na lines, which are noticeably pressure broadened in the Na interval in dwarf standards, has been tuned to best match an observed solar spectrum (DJ03).
3.4 Spectral Fitting Routine
Once the basic synthesis grid has been created, a spectral search routine (DJ03) steps through each model spectrum, modifying it by incrementally adding rotational broadening (), continuum veiling (rK), and fractional pixel wavelength shifts (). Broadening by stellar rotation is modeled by convolving our model spectra with a rotational broadening profile and an assumed limb-darkening coefficient of 0.6 (Gray, 1992). We simulate the amount of 2 m continuum veiling (rK) by adding successive amounts of non-photospheric flux, assumed to be spectrally flat and featureless. A coarse value for the topocentric radial velocity is estimated by eye for each observed spectrum. Then, 0.8 km s-1 shifts (1/5 of a pixel) are each tested over a 5 km s-1 range to find the best radial velocity fit to each protostellar spectrum.
The search routine steps through a selected region of parameter space, modifying the spectral synthesis templates of all three wavelength intervals by modeling each unique combination of the five search parameters within the following range of values: 3000K – 6000K (Teff), 3.5 – 5.0 cm s-2 (), 0 – 80 km s-1 (), 0 – 6.0 (veiling, rK), and 5 km s-1 (vrad). Each unique model spectrum is compared to the observed YSO spectrum. Wavelength sub-intervals in the observed spectrum are selected by eye to isolate only those photospheric lines which will be compared to their model counterparts. The quality of the fit between the observed protostellar spectrum and each spectral synthesis model is then quantified from the aforementioned selected wavelength sub-intervals as the root mean square (RMS) of the residuals in the data-to-model comparison (DJ03). The overall best-fit model is automatically selected by the search routine as the one with the lowest RMS value over the entire search grid. Fig. 9 illustrates the RMS error space in the veiling/effective temperature plane for the model fits to DG Tau. The elongation in the error space stretching from upper left to lower right in the lower panel shows that there is still a bias for lines with higher amounts of veiling to trade off with lines of cooler temperature stars.
The range of the search grid in Teff and is constrained by the availability of the NEXTGEN models (Hauschildt et al., 1999) which we use to generate the spectral synthesis templates. RMS values corresponding to each of the fits in the three wavelength intervals are combined in the following way after validating this technique with the fits to MK standards of known Teff, , and ( 3.6). (1) We use the Na and Mg/Al wavelength intervals together as combined diagnostics of temperature, gravity, and veiling in an iterative process. Initially, gravity is held fixed, while the best fit for temperature and veiling is found. Then, temperature is fixed at the previous best-fit value while gravity and veiling were varied to find the best fit. This process is iterated until a best fit for all three parameters is found. By fitting both Na and Mg/Al wavelength intervals simultaneously we usually converge to a unique value for effective temperature, gravity and veiling where the combined RMS value from both Na and Mg/Al intervals is lower and the error space more sharply defined than when either interval is used alone. Therefore, we use both intervals weighted together, equally, as strong diagnostics for Teff and , as well as rK. (2) The broadening of the bandhead in the CO interval is determined to be the most sensitive indicator of projected rotation of all our diagnostic lines. Therefore is solely determined by the best fits to the CO interval by first imposing the best Teff and from the Na and Mg/Al intervals, while leaving the amount of veiling unconstrained, in favor of finding the best rotationally broadened spectral fit. This amount of broadening is likewise imposed on the fits in the other two intervals.
Radial velocities for each object are found as the mean of the velocity shifts between the observed and the best-fit synthetic spectra for each of three spectral regions independently. Occasionally one of the three orders had a widely divergent derived velocity shift; in these cases the discrepant point is discarded from the mean. The derived velocities are adjusted using the IRAF package RVCORRECT to account for motions due to the Earth’s solar and galactic orbits, allowing a calculation of VHelio and VLSR for each object.
3.5 Quality of the Model Fits
Random errors present in the RMS best-fit value of the spectral fits are due to the finite signal-to-noise present in our data. In order to calibrate a 3 change in the RMS parameter search space, a test model spectrum was constructed using a particular synthesis model, representative of a typical YSO fit in our sample: (Teff = 3600K, = 4.0, = 40, and rK = 3.0). Random Gaussian noise was added to the test spectrum to achieve S/N = 200 pixel-1 before it was then run through the standard fitting routine. This was done many times with random noise seeds. A 1 variation in the best-fit RMS value over many trial fits to the same spectrum with noise was RMS = 10-4. Using this number, we calibrate the errors due to noise in each of the physical parameters using the RMS error contour plots (output by the spectral fitting routine for each fit). A change in the RMS from the lowest value (i.e. the best fit) to a value that is bigger by 3 10-4, then corresponds to the 3 random error along that new error contour line. For example, Fig. 10 shows the error space contours in the vs rK and vs planes corresponding to the best fits of these quantities in DG Tau. The asterisks mark the minima in the error space (RMS = 4.2 10-3 and 4.5 10-3) and each contour interval corresponds to an increase of 3 10-4 (3 contours), resulting in a calibrated change for each parameter. Therefore, the error space in each of four parameter fit planes (Teff vs ), (Teff vs rK), ( vs ), ( vs rK) is characterized by changes of 10-4 (1 ) from the best-fit RMS value. Random errors in the four parameters are generally smaller than systematic errors.
The best model fit to each observed protostellar spectrum is associated with an initial seeded value, where the initial seed value for is assumed and held fixed while the spectral fitting routine then finds the best-fit Teff. Following this, the routine then holds the new best-fit Teff fixed and searches for the corresponding best fit for , and so forth. Thus, the routine finds an RMS minimum within the 5 parameter search space, iterating between the Teff and search planes. Sometimes there is more than one local minima in the solution and different initial seed values for fit to different best-fit solutions. In this case, differences in the different RMS minima are compared and the overall best solution is taken as the global minimum of all different seeded best fits. Uncertainties (1 ) in the physical parameters (Teff, , rK, and ) derived from the spectral fits are computed by measuring the changes in each quantity that produced a change of in the RMS fit residual, about the global minimum RMS fit. Systematic errors in the best-fit parameters are then gauged by changes in best-fit solutions that are below our ability to discern real changes in the fits appropriate to the signal-to-noise of our spectra.
Changes in the equivalent widths of lines are evident in the spectra of young stars with differing Teff, , and rK. At high resolution the changes to the lines whose shapes are fully resolved can distinguish between different physical diagnostics (i.e. line damping and large rotation), but degeneracies in the fits to spectral models in Teff, , and rK persist even at high spectral resolution, especially in unsaturated lines. The elongation in the error space in figures 9 and 10 (bottom panels) show how Teff and are both somewhat degenerate with veiling, though in opposite senses. Also, surface gravity and effective temperature are together degenerate (DJ03) in the sense that lower effective temperatures fit to lower spectra (see further discussion in 3.6).
The degeneracy is less pronounced when simultaneous fits to more spectral lines can be performed, as has been done here with the NIRSPEC echelle spectra. In particular, the Na fits and Mg/Al fits together constrain gravity and temperature better than using only one interval, despite systematic errors that can dominate the accuracies of the best-fit model.
3.6 Spectral Fits
To validate the quality of the spectral synthesis models and our ability to accurately fit them to actual data, we apply our fitting routine ( 3.4) to our NIRSPEC observations of MK standards. Using our standard fitting procedure to the synthesis model grid, we determine the best-fit values for Teff spanning G8 – M5.5 spectral-types (5300K to 3100K) in our standard stars. We find a very good agreement (correlation coefficient of 0.99) between our near-IR temperatures and those inferred from the optical spectral-types (Fig. 11) using the relation quoted by de Jager & Nieuwenhuijzen (1987). The surface gravities we derive in the standards are consistent with those of late-type dwarfs ( = 4.4 – 5.0) with some scatter due to the uncertainties in the conversion from the standards’ spectral-types to surface gravities. All but 2 of our late-type standards have rotational velocities well below our resolution limit (R = 18,000, 17 km s-1). The average value derived for these slow rotating standards is 10.8 km s-1, which we adopt as a measure of the instrumental broadening through our 4 pixel wide slit. We remove this value in quadrature from the values we measure in two standards (Gliese 791.2 & 1245A) whose velocity broadened lines we resolve and compare with independent derived optical measurements of 32 and 22.5 km s-1, respectively (Mohanty & Basri, 2003). Our near-IR derived values are in excellent agreement with the optical study, where we measure, 34.3 and 22.5 km s-1, respectively.
We expect our MK standard stars that are in the field to be completely unveiled. However, when we allow veiling to be fit as a free parameter along with Teff, , and , we find the best-fit value has an average veiling of rK,fit = 0.2, weighted toward more veiling in later type spectral standards. We also see a similar effect in the CO order. If this is an instrumental effect caused by scattering or leaking some of each object’s own light, then the amount of this excess instrumental veiling is r) where rK is the object’s true veiling. We correct the best-fit veiling values rK,fit of the YSOs (as derived from the Na and Mg/Al intervals) to true intrinsic veilings (rK) with this relation and report only these corrected values in this publication:
| (1) |
After validating our technique with the standards, and establishing the veiling correction needed in our NIRSPEC data, we fit 41 spectra of Class I and flat-spectrum sources to the synthesis models following the procedure described in 3.4. At least 1 echelle order displayed photospheric absorption lines in all of these 41 sources from which we were able to derive key physical properties directly from the spectra. These results are listed in Table 3 along with the 1 uncertainties ( 3.5). We do not apply our fitting routine to 11 stars in our sample due to the absence of photospheric lines in their spectra.
As a check to the effective temperatures, rotational broadening and veiling values that we derive using our spectral synthesis models, we evaluate fits to our protostellar spectra using the observed standard spectra (that have been spun-up and veiled), where the best fit is found qualitatively by eye. We compare the best model fit to the best standard fit after converting the spectral-type of each best-fit dwarf MK standard to an effective temperature (de Jager & Nieuwenhuijzen, 1987). The and rK values both show some scatter that is roughly symmetric about a perfect-fit line. The Teff values show a systematic offset toward higher derived effective temperatures (). This temperature difference is likely due to differences in surface gravities between the dwarf standards ( 4.3 – 4.7) and our YSO models (mean = 3.8). In general, effective temperatures increase by 200K for each increase of 0.5 in for late-type stars (DJ03), so the sign and magnitude of the temperature offset is correct.
The rotation velocities and rK continuum veilings for each of the 41 objects fit in our sample (Table 3) are shown in Figure 12. This figure also shows 2 curves which plot our expected sensitivity to and rK for Teff = 3500K and 4600K stars with signal-to-noise representative of our object sample (S/N = 180). We should detect photospheric absorption lines in objects which lie to the left of those curves, and we are insensitive to detecting photospheric absorption features in objects which lie to the right of these curves. The curves and points show that we are least sensitive to objects with high rK and high and most sensitive to ones with low rK and low ; high veilings and fast rotation velocities both reduce the depths of absorption features relative to continua.
K-band veilings and rotation velocities do not appear strongly correlated in Figure 12. We detect objects which span nearly the entire range of and rK to which we expect to be sensitive. However, there are no objects in the region near the line defined by the points rK = 1, = 0 km s-1 and rK = 4, = 40 km s-1. It is unclear whether this gap is due to a physical effect or else a characteristic of our finite object sample.
3.7 Accuracy of Radial Velocity Measurements
To determine the accuracy of our derived radial velocities, we compare our derived heliocentric radial velocities to those in the literature for well-observed spectral-type standards. Figure 13 shows a histogram (solid line) of the residuals of our derived velocities less the previously determined value for spectral-type standards with precise (error 2 km s-1) heliocentric velocities (de Medeiros & Mayor, 1999; Gizis et al., 2002; Nidever et al., 2002; Mohanty & Basri, 2003). The best fit Gaussian to the histogram, binned in the same manner, is shown as the dashed line. The mean of the Gaussian fit is –1.8 km s-1, indicating the presence of a slight offset in our derived velocities. To correct for this systematic observational artifact, a +1.8 km s-1 shift has been applied to all derived velocities presented in this work (Table 3) and Covey et al. (2005b).
The width of the Gaussian fit in Fig. 13 also provides an indication of the level of accuracy with which we can determine the velocities of targets ( 2 km s-1). The true distribution appears to have slightly broader wings than the Gaussian fit. We therefore consider the size of our true velocity error as 1.5 , or 3 km s-1.
3.8 Stellar Luminosities Derived from Photometry
In addition to the surface gravities we measure directly from the spectra, we derive stellar luminosities for our sources in Ophiuchus, Taurus, and Serpens based on published H and K-band apparent magnitudes (Eiroa & Casali, 1992; Kenyon & Hartmann, 1995; Barsony et al., 1997; Kaas, 1999). Many of our objects do not have J-band photometry, so we are unable to de-redden these sources individually on a color-color diagram. Instead, we estimate the extinction at K by de-reddening all our objects to an intrinsic H–K color of 0.6, which is midway between the end of the classical T-Tauri star locus (H–K = 1.0, Meyer et al., 1997) and the average intrinsic color for late-type dwarfs (H–K 0.2, Table A5 of Kenyon & Hartmann, 1995). To account for the presence of scattered light, we increase each of our derived extinctions by 0.88 magnitudes (see paragraph below). Absolute K magnitudes were computed from observed K magnitudes corrected for extinction (employing the extinction law of Martin & Whittet, 1990), excess emission that is measured spectroscopically though veiling in this work (see Table 3), and distance to the star forming cloud (Tau = 140 pc, Oph = 145 pc, Ser = 259 pc; Kenyon & Hartmann, 1995; de Zeeuw et al., 1999; Straizys et al., 1996). The stellar luminosity is found by converting the absolute K magnitude to a V magnitude adopting a V–K color and a bolometric correction appropriate to a late-type dwarf having our derived effective temperature (Table A5, Kenyon et al., 1993). Using the photometric luminosities and spectroscopic effective temperatures, these objects are plotted on an observational H-R diagram, and show a spread in Teff and luminosity (Fig. 14). This stellar luminosity should be representative of the PMS star and not include any accretion luminosity.
The flux measured within a photometric aperture toward a Class I object contains contributions from sources other than the direct light from the extincted stellar photosphere. These other sources of emission include the surrounding accretion disk, hot dust in the inner envelope and scattered light from holes or cavities in the envelope. Indeed, observed high polarizations of many Class I sources in Taurus suggest that the observed fluxes are dominated by scattered light (Kenyon et al., 1993; Whitney et al., 1997). In this case extinction estimates based only on de-reddened colors are underestimates since they represent the extinction to the scattering surface and not the protostellar object itself. In some cases this could lead to severe underestimates in the source luminosity. We compare our derived extinction estimates to those derived by Whitney et al. (1997) from a more careful analysis using polarimetric observations and radiative transfer models of Class I envelopes to derive more realistic extinctions to individual protostellar objects in the Taurus cloud. Seven of those objects are also in our sample, and we find that the Whitney et al. (1997) K-band extinctions are 0.88 magnitudes higher (mean value) than the extinctions we compute from the H–K colors of those same objects. Therefore in an attempt to account for the extinction produced by the presence of scattered light, we increase the derived extinctions in all of our Class I and flat-spectrum sources by 0.88 magnitudes.
The luminosity error bars depicted in Figure 14 are the quadrature sum of uncertainties due to distance to the cloud, observed photometry, slope of the extinction power law, the (assumed) intrinsic (H–K) color, and the presence of scattered light. The last two quantities are highly uncertain due to the complexities of the circumstellar environments typical of Class I objects. The largest uncertainty in our luminosity calculation arises from the intrinsic colors of protostars (H–K = 0.6 ) which may not resemble those of dwarfs. To quantify the luminosity uncertainty due to scattered light, we examine the uncertainty of the 0.88 magnitude offset of the K band extinction values, the mean difference between the extinctions derived by Whitney et al. (1997) and us for the seven objects in Taurus that we had in common. We determine the uncertainty of this offset from the standard deviation of the mean (0.39 magnitudes in AK). Ascertaining appropriate extinctions and disentangling the effects of scattering, source geometry and veiling from disks and envelopes likely requires detailed modeling of the envelopes of individual sources in order to derive meaningful luminosities for the central embryonic stars. In the absence of such modeling one must regard our derived luminosities of Class I objects as being highly uncertain.
4 Discussion
4.1 H-R Diagrams
The placement of Class I and flat-spectrum sources in H-R diagrams is one of the main goals of this study. Coupling our determinations of Teff and with estimates of individual source luminosities derived from existing photometric observations, we are able to place our object sample on the H-R diagram. We present the individual H-R diagrams for Ophiuchus, Taurus and Serpens in Figure 14. For comparison we also plot one set of theoretical PMS evolutionary tracks Baraffe et al. (1998) on an accompanying H-R diagram. We find the flat-spectrum / Class I stars to lie in a relatively broad band, parallel to and well above the main-sequence, but below the expected birth-line for YSOs (Stahler, 1994). In Figure 15 we show the locations on the H-R diagram of Class II sources from the same clouds. Comparison of the two plots shows that Class I and flat-spectrum central stars span a very similar range of luminosity and effective temperature as Class II sources. For both types of sources there is a relatively large scatter in their positions on the H-R diagrams. These findings are similar to those derived from optical spectroscopy of Class I sources in Taurus (Kenyon et al., 1998; White & Hillenbrand, 2004).
Classical PMS theory would suggest that Class I sources should appear at or near the birth-line, however PMS models that include the effects of accretion indicate that accreting stars evolve more quickly down Hayashi tracks than non-accreting stars and should appear at lower luminosities than non-accreting stars of the same age (Tout et al., 1999; Siess et al., 1999). Thus the locations of Class I sources below the birthline are consistent with expectations for accreting stars. However, because Class I sources should be systematically younger than Class II objects the Class I stars should on average be more luminous than the Class II sources which does not appear to be the case for the objects we observed. However as discussed below large uncertainties in both derived source luminosities and the locations of theoretical tracks on the H-R diagram may mask such an effect.
In Figure 16, we plot the surface gravities vs effective temperatures for Class I and flat-spectrum sources in the same clouds along with the predictions of theoretical models of PMS evolution. The surface gravities we derive from spectroscopy are correlated with the photometrically determined luminosities using evolutionary model tracks to infer the stellar mass. We find that our protostellar sample are characterized by sub-giant surface gravities that are significantly lower than those of main-sequence dwarfs. There is a relatively large scatter in distribution of the Class I and flat-spectrum surface gravities.
If we compare the positions of our YSOs on the H-R diagram and on the surface gravity plots with the predictions of classical PMS theory we find these YSOs appear to span an age range of 107 years, similar to that of Class II objects. This is almost certainly an unphysical result. For example from statistical arguments the Class I phase is thought to be only about 105 years in duration, considerably shorter than the spread of sources on the H-R and surface gravity diagrams would suggest. Moreover, the observed color-magnitude diagrams of slightly older ( Myr) young clusters exhibit very well-defined pre-main sequences with nearly coeval age spreads of typically less than 2–3 Myr (Moitinho et al., 2001; Preibisch et al., 2002). Together these facts suggest that the observed spreads on the H-R diagrams for a very young stellar population ( 1–3 Myr) are a result of factors other than age, factors that introduce systematic uncertainties in the locations of stars on the H-R diagram. These factors include intrinsic source variability, uncertainty in extinction corrections, binarity (e.g., Preibisch & Zinnecker, 1999) as well as effects of accretion on the positions of accreting stellar objects on the H-R diagram (Tout et al., 1999; Siess et al., 1999).
Protostellar luminosities are dominated by scattering and disk accretion and thus determination of the stellar component of the luminosity from observed photometry is likely one of the largest sources of uncertainty in the vertical positions of Class I and flat-spectrum objects on the H-R diagram. Errors in stellar luminosities derived from near-IR photometry in our sources are dominated by uncertainties in judging the intrinsic near-IR colors of these embedded sources ( 3.8). Relying on the assumption that these objects are radiating isotropically is problematic since the stellar light can be partially blocked by disks or scattered through cavities. Kenyon & Hartmann (1990) find that the stellar luminosity in T-Tauri stars can be underestimated by up to 50% (factor 2 in age) due to occultation by opaque disks at various inclination angles. Luminosities of Class I sources in Taurus report uncertainties of 33% - 50% for objects whose optical spectra are seen only in scattered light (Kenyon et al., 1998). The geometry of protostellar disks is clearly important to making accurate measurements of the luminosity emanating from an embedded source, and overestimates in the apparent age can result if this is not accounted for. This effect has been seen by others as well; the H-R diagrams of White & Hillenbrand (2004) show that Class I YSOs and YSOs driving Herbig-Haro flows in Taurus-Auriga which have edge-on disks have low luminosities making them to appear to have very high ages, on the order of 108 yr. Uncertainties in our spectroscopic measurements of gravity stem from our fits to key photospheric lines (see 3.5), whose shapes and depths are affected by combinations of physical parameters (i.e. Teff, , rK) that are difficult to completely separate in finite signal-to-noise data.
A theoretical uncertainty in using H-R diagrams to measure masses and ages lies in the reliability of the placement of evolutionary model tracks which permit us to convert observables into fundamental intrinsic properties. The presence of accretion delays the formation of a radiative core (Siess et al., 1997), which offsets the isochrones toward lower luminosities and higher gravities in cool (T 5800K) YSOs (Tout et al., 1999). Depending on the accretion history, and initial mass, overestimates in the ages vary between 30% and a factor of 5 when compared to models without accretion (i.e. Baraffe et al., 1998).
It is quite likely therefore that the large spreads in the stellar luminosities and gravities that we find for our Class I and flat-spectrum sources are not due to real spreads in age, but represent uncertainties in the intrinsic colors, extinctions, and emitting geometry of each star, along with observational uncertainties in their spectra. Therefore differences in the stellar luminosities of Class I / flat-spectrum and Class II sources are extremely difficult to detect in observational H-R diagrams and comparisons of derived luminosities and ages between these objects are not likely meaningful. Moreover, when the observational uncertainties are coupled with uncertainties in the PMS evolutionary tracks it is evident that Class I and flat-spectrum ages can not be confidently extracted from H-R diagrams.
4.2 CO Emission
Near-IR CO emission has been observed in a number of YSOs (Scoville et al., 1983; Geballe & Persson, 1987; Carr, 1989), although it is less common in low luminosity objects (e.g. Greene & Lada, 1996; Luhman et al., 1998). CO emission has been used as a probe to study the kinematics of the inner disk region around YSOs (Najita et al., 1996), since relatively warm (Tex = 2500K – 4500K) and dense (n cm-3) neutral gas is needed to collisionally excite CO, where the origin of the emission may likely be from a temperature inversion in the inner disk atmosphere. While another source of this emission could be outflows of neutral gas in winds (e.g. SVS 13, Carr & Tokunaga, 1992), most CO overtone emission fits profiles of rapid Keplerian rotation (up to 400 km s-1) originating from an inner disk (Dent & Geballe, 1991; Carr et al., 1993; Chandler et al., 1995).
The rotation profile of a disk is distinctly double peaked in velocity space (Carr et al., 1993) because different disk regions have different Keplerian velocities and different CO emission strengths. When this profile is convolved with the first overtone CO bandhead and R branch lines, the result is an asymmetric profile having a blue wing, a shoulder, and a peak redward of the bandhead rest velocity (Najita et al., 1996). In contrast, a stellar rotation profile (Gray, 1992) has a single symmetric peak centered at the rest velocity, with the higher velocity components contributing less as the projected emitting area decreases outward toward the limb.
We detect CO emission in 8 of our sources (15% of our sample), which is accompanied by Br emission in all cases, and Na emission at 2.2062 m & 2.2090 m in 5 cases. Except for 2 sources (EC 129 & EC 38, see Appendix A), the broadened CO emission ( 100 km s-1) shows a velocity structure that is consistent with spectral models of Keplerian rotation (Carr et al., 1993; Najita et al., 1996) from an optically thin disk. Two sources have both CO and Br absorption superposed on corresponding emission features in these two lines.
4.3 Brackett
We detect HI Br emission (2.1661 m) in 34 of 52 YSOs observed in our sample (65%, shown in Figs. 17 & 18). In general, the emission profiles are broad (95 – 320 km s-1, FWHM), consistent with what is seen in low luminosity embedded YSOs and active T-Tauri stars (Najita et al., 1996). In 4 cases (i.e. EC 129, GY 224, IRS 67, IRS 43), the emission is significantly blue-shifted relative to the stellar systemic velocity, indicative of an outflow. These sources are among those that are marked with dashed vertical line indicating the objects where we measure photospheric radial velocities (Figs. 17 & 18).
In 6 cases, there is accompanying Br absorption that is superposed near the peak of the emission profile (left panel of Fig. 17), but red-shifted by 15 – 65 km s-1(i.e. 04016+2610, EC 129, GY 21, EC 94, IRS 63, SVS 20A). Emission with blue-shifted absorption, which would be explained by an expanding wind (Najita et al., 1996), is absent in our sample. Instead, the red-shifted absorption minimum is characteristic of material in-falling from the disk onto the photosphere (Muzerolle et al., 1998a), perhaps along magnetic accretion columns in cases of greater velocity red-shifts where in-falling material can reach free fall velocities. Inverse P-Cygni profiles in classical T-Tauri stars indicative of in-fall are ubiquitous (Edwards et al., 1994), and have been explained by free falling gas along the magnetosphere (Hartmann, 1994; Hartmann et al., 1994). The modest red-shifts (v 65 km s-1) we observe in these Br absorption components (relative to the emission peak) suggests that accretion may be occurring through the inner disk in this stage before it could become disrupted and truncated in a later evolutionary stage (Bertout et al., 1988).
Four YSOs have Br absorption without the presence of any emission. The strongest and broadest of these is 03260+3111A, whose equivalent width (3.4 ) and broadened line wings are consistent with Br absorption we see in late G-type dwarf standards, confirming its relatively warm Teff (5600K) derived from spectral fits to photospheric lines in the Na and Mg/Al intervals. Only one other source is warm enough (SVS 20A, see Appendix A), to allow a photospheric origin for the absorption. For the other 3 sources that show only Br in absorption (EC 53, EC 92, EC 95), we see equivalent widths that are significantly greater than what is observed in the MK standards of comparable spectral-type. The likely explanation for this is that either the Br absorption arises from a non-photospheric mechanism (Muzerolle et al., 1998a), or else these are binary systems with both early and late-type components. If the latter is true, then the early-type star must cause significant veiling of the K-band photospheric features of the late-type star in each system, by nature of their relative temperatures and the larger radii of the early-type stars. This does not apply for EC 92 and EC 95 which have veiling rK = 0.0 and 0.1, respectively. In the case of EC 53 which has veiling rK = 1.8, an earlier spectral-type binary component that is warm enough to have photospheric Br absorption lines (i.e. Teff 4200K) would mask the lines (r) of the cooler star (Teff = 3400K). Therefore we conclude that the Br absorptions of EC 53, EC 92 and EC 95 most likely arise from another mechanism. The radial velocities of all the Br absorption lines lie at the stellar systemic velocity to within one resolution element of our observations (17 km s-1).
4.4 Excess Continuum Emission
K-band veiling traces thermal emission from circumstellar material. Moderate amounts of veiling () can be produced by circumstellar disks, depending on their structures, activities, and geometries. Circumstellar envelopes are usually responsible for larger amounts of veiling (see Greene & Lada, 1996). Young stars with large rK values have more warm circumstellar material than less veiled ones. K-band veiling may also be a good indicator of mass accretion because matter close to a young star is attracted to it by gravity.
We now use rK measurements to investigate whether the Class I and flat-spectrum objects in our sample have more warm circumstellar material than Class II and T-Tauri stars. We start by compiling mean veiling values for each of the 3 major star forming regions which we have studied. We compute these values from the rK results presented in Table 3, but we also correct for the objects for which we were not able to determine physical parameters. Eight of these objects (2 in Tau-Aur, 3 in Oph, and 3 in Serpens) were observed with high signal-to-noise, so we assign them the value rK = 4.0. We determined this value to be their likely lower limits using our observed veiling / rotation completeness limit assuming a typical rotation velocity = 35 km s-1 (see Fig. 12). The other 2 objects (CRBR 85 in Oph and EC 89 in Ser) show weak Na and CO absorption features (too weak for analysis) in moderate signal-to-noise spectra, so we assign them both rK = 1.5, typical for the object sample.
With these corrections, our entire Class I and flat-spectrum object sample has a mean veiling = 1.83. The objects in Tau-Aur and Ser both have = 1.54 (1.21 for Tau-Aur and 1.49 for Ser), while the Oph objects are characterized by = 2.21 1.35. We evaluated the likelihood that objects in these different regions have statistically significant veiling differences by performing KS tests on their rK values. We found that the Ser and Tau-Aur objects are likely to be drawn from the same veiling distribution (88% probability), while the Tau-Aur and Oph probability was 18% and the Ser and Oph probability was 24%. Thus all the objects in the 3 major star forming regions have similar veiling values, with Oph and Tau-Aur showing some evidence for being different (at the 1.3 level). We infer similar conclusions about the similarity of circumstellar material around these objects.
Next we compare these results to the veilings of Class II YSOs in order to evaluate whether objects in our study have significantly more circumstellar material. Of the 3 major star formation regions in our study, only the Oph region has a significant number of Class II YSOs for which rK values have been determined. We compute that the mean veiling of Class II objects in Oph is = 0.94 1.03 from data presented by Doppmann, Jaffe, & White (2003) (10 objects) and Luhman & Rieke (1999) (15 objects). This is about half that of the Oph objects in our Class I and flat-spectrum sample. Furthermore, the KS test reveals that the rK values of the Class I / flat-spectrum and the Class II samples in Oph have less than a 1% chance of being drawn from the same parent population. Therefore we conclude that Class I and flat-spectrum objects have significantly more veiling than Class II YSOs. The Class I and flat-spectrum objects must have more warm circumstellar material, making it likely that they are in a more embedded and younger evolutionary state.
Muzerolle et al. (1998b) have shown that HI Br emission is well-correlated with mass accretion in T-Tauri stars, and we now evaluate whether rK and Br emission are correlated in our Class I and flat-spectrum sample. In Figure 19 we plot Br line luminosity (after correcting for extinction and distance) for sources where we also were able to measure rK. These two parameters are positively correlated, but Fig. 19 shows too much scatter (perhaps due to uncertain extinction corrections or asymmetrically distributed circumstellar material) to confirm that both rK and Br emission are reliable mass accretion diagnostics for Class I and flat-spectrum YSOs. Using our measured Br luminosities, the Muzerolle et al. (1998b) relation suggests that our Oph sources have accretion luminosities 10, while Taurus and Serpens have about an order of magnitude less. However, we note that many of the objects in our sample have been observed to have significantly higher bolometric (accretion) luminosities (Wilking et al., 1989), and the Muzerolle et al. (1998b) relation was derived for Class II objects with low accretion luminosities. Therefore the absolute accretion luminosities derived from Br fluxes are likely to be underestimates, although the relative difference between Oph and the other regions is interesting and may be real.
4.5 The Natures of Class I and Flat-Spectrum Sources
The above discussion has demonstrated that analysis of spectroscopic features provides much more detailed information on the natures of YSOs than can be ascertained from SED shapes alone. We now examine the extent to which the aggregate of information derived from our spectra provides insight into the true physical natures and evolutionary status of Class I and flat-spectrum YSOs. As part of this effort, we also assess whether this new information supports the established paradigm that Class I objects are protostars near the ends of their bulk mass accretion phases that then evolve to Class II or Class III YSOs.
Our analysis has shown that Class I and flat-spectrum YSOs have some astrophysical properties which are similar and some which are considerably different from Class II and III YSOs. As noted in 4.1, our Class I and flat-spectrum sample have effective temperatures, surface gravities, and stellar luminosities which are similar to those of Class II PMS stars. This is not completely unexpected given the relatively large uncertainties in stellar luminosities determined for Class I and flat-spectrum objects ( 3.8; see also Figure 14), and the stellar cores of steadily accreting protostars are expected to be in near hydrostatic equilibrium with radii and central temperatures similar to T-Tauri stars (Stahler et al., 1980).
However, other intrinsic astrophysical properties of Class I and flat-spectrum objects do differ significantly from Class II or Class III PMS stars. In 4.4, we determined that the K-band veilings of Oph Class I and flat-spectrum YSOs are significantly higher than those of Oph Class II objects, indicating more circumstellar material and higher mass accretion in Class I and flat-spectrum objects. Also, our Class I and flat-spectrum sample has significantly higher sin rotation velocities and angular momenta than Class II and T-Tauri PMS stars the Tau-Aur and Oph regions. If a young star is magnetically locked to its disk via its magnetic field, popular magnetospheric accretion models predict that the disk coupling radius is proportional to , where is the mass accretion rate onto the star (Koenigl, 1991; Shu et al., 1994). This means that YSOs with higher accretion rates should be rotating faster than low accretion rate objects, with angular velocities (for a full discussion see Covey et al., 2005a).
In summary, all fundamental astrophysical properties derived in this study appear to support the paradigm that Class I and flat-spectrum YSOs are accreting protostars. In this respect our results appear to differ from those of White & Hillenbrand (2004) who found that most optically-selected Class I YSOs in Tau-Aur have mass accretion rates, accretion luminosities, and rotation velocities that are not significantly different from Class II and T-Tauri stars in the same region. Furthermore, White & Hillenbrand (2004) conclude that the similarity of Class I and Class II / T-Tauri spectral-types and stellar luminosities imply that these objects have similar ages and masses. Therefore White & Hillenbrand (2004) argue that Class I and II YSOs are not in different evolutionary states and that Class I objects are no longer in their main mass accretion phases of evolution. We note that we argued in 4.1 that conventional PMS models cannot yield ages of Class I and flat-spectrum YSOs because they lack accretion physics.
In an attempt to reconcile these results, we first investigate whether the optical spectroscopy analysis technique of White & Hillenbrand (2004) yields the same parameters as our analysis for objects observed in both studies. Eight objects were observed in both studies, and we derive astrophysical parameters for all of them. The six sources with astrophysical properties derived in both studies are 04016+2610, 04158+2805, DG Tau, GV Tau, Haro 6-28, and 04489+3042. Both studies derive similar effective temperatures (within 350K; converted from the spectral-type designations of White & Hillenbrand, 2004) for all 6 objects except DG Tau, which White & Hillenbrand (2004) find to be significantly earlier (about 650K warmer) than we do (Table 3). The high optical and IR veilings of this object may contribute to uncertainties in the spectral-type and effective temperature derived for this object. The rotation velocities of 5 of these 6 objects also agree well (to several km s-1), with the exception of 04016+2610. White & Hillenbrand (2004) derive km s-1 for this object, while we report 46 km s-1. We suggest that the very low signal-to-noise in the optical spectrum (S/N 2) may be responsible for this discrepancy, and it is likely that our higher signal-to-noise spectrum (S/N 240) yields the less uncertain value. Overall it appears that both studies yield similar astrophysical parameters for common sources.
The differences in the conclusions between the two studies may be due to differences in the underlying physical properties of the IR and optically-selected samples that were analyzed. White & Hillenbrand (2004) find that Class I YSOs do not have higher rotation velocities or higher mass accretion rates (as inferred from veiling and luminosity measurements) than Class II objects. They do not derive astrophysical parameters for two of the eight objects common in both studies, L1551 IRS5 and 04295+2251. Interestingly, we find that the rotation velocities of these objects are 31 and 51 km s-1, considerably higher than the median rotation velocity of 19.8 km s-1 of the White & Hillenbrand (2004) Class I sample (see their Table 3). The five Class I or flat-spectrum Tau-Aur YSOs in our sample which were not observed by White & Hillenbrand (2004) are not optically visible, and we find 4 of the 5 to be highly veiled r, with 2 of those veiled to the point where they have no discernible absorption features (r; see Figure 12). This suggests that optically-selected Class I YSOs may have less veiling and less accretion luminosity than IR-selected ones. Also, Tau-Aur YSOs have been known to have lower bolometric luminosities (Kenyon et al., 1990), and presumably lower mass accretion luminosities and rates than those in the Oph star forming region (Wilking et al., 1989). Finally, we note that White & Hillenbrand (2004) did not account for the fact that several of their Class I objects (and a few of their Class II ones) were too veiled to determine their astrophysical parameters, so they did not compute mass accretion rates or rotation velocities for these objects. Therefore the median mass accretion rates and rotation velocities computed in that study are likely biased by these omissions.
The above discussion suggests that Class I sources span a wide range of stellar and circumstellar properties, from actively accreting to relatively quiescent objects. We do believe that our large sample of IR-selected Class I and flat-spectrum YSOs from several star forming regions does give the most accurate picture to date of their true natures as accreting protostars.
5 Summary
We have acquired high resolution near-IR spectra of a sample of 52 Class I and flat-spectrum YSOs located in the Tau-Aur, Oph, Ser, and other nearby dark clouds. We have derived their fundamental astrophysical properties via fitting their spectra to theoretical spectra synthesized from the NEXTGEN (Hauschildt et al., 1999) PMS models and make the following conclusions:
-
1.
We detect absorption lines in 41 of the 52 objects. This is a much higher number and fraction than earlier studies because of the high sensitivity and spectral resolution of the Keck II telescope and its NIRSPEC spectrograph. Twenty-three of the objects show 2.2235 m H2 emission lines.
-
2.
Thirty-four objects show HI Br emission lines, and 6 of these show Br absorption as well. The absorptions are modestly red-shifted in all cases, indicating accretion in those objects.
-
3.
CO emission is seen in 15% of the objects, indicating that CO emission and active circumstellar disks are more common than expected from earlier studies.
-
4.
The absorption spectra are fit well by the synthetic spectra, indicating that the objects have effective temperatures and surface gravities which are consistent with PMS stars. The spectral fitting procedure also yields rotation velocities, radial velocities, and K-band veilings.
-
5.
The objects show a wide range of effective temperatures and stellar luminosities, and these values overlap with those of Class II and T-Tauri stars when placed in H-R diagrams. The Class I and flat-spectrum objects have low masses which span the same range as Class II and T-Tauri stars, but significant observational and theoretical uncertainties preclude deriving meaningful and accurate luminosities and ages for protostellar sources from placement on the H-R diagram and comparison with conventional PMS models.
-
6.
We find that the mean K-band veiling of Class I and flat-spectrum YSOs in Oph is significantly higher than for Class II objects in this region. This indicates that the Class I and flat-spectrum objects are accreting at higher rates, which is bolstered by an analysis of their angular momentum properties in a companion paper (Covey et al., 2005a). We also find that K-band veilings vary somewhat between Class I and flat-spectrum YSOs in different regions, with the Oph objects having the highest veiling values, .
-
7.
We conclude that Class I and flat-spectrum YSOs are indeed actively accreting protostars, although they span a wide range of accretion activity. High resolution near-IR spectra provide sufficiently detailed information to diagnose the stellar and circumstellar properties of nearly any Class I or flat-spectrum YSO.
Appendix A Notes on Individual Sources
EC 38:
Of all our sources which show CO overtone emission, EC 38 is the only one with an extremely narrow CO emission profile (30 km s-1), perhaps the most narrow observed CO overtone emission profile seen in any embedded source. Furthermore, there are two resolved bandhead peaks (separated by 64 km s-1), with evidence of beating in the R branch lines. A conical high velocity neutral wind in the plane of the sky viewed at low inclination angles (Chandler et al., 1995) might explain the well-separated blue and red-shifted bandhead components. However, narrow CO disk emission lines (40–50 km s-1 wide) have only been observed in one other YSO (SVS 13), but are too narrow to fit emission models for either a circumstellar disk or outflow (Carr & Tokunaga, 1992), unless there is rotational coupling between the star and inner disk or if CO originates from a lower velocity flow. Strong Br emission is also observed in this source. A model that includes in-falling material from a truncated disk accompanied by a outflowing wind might best describe these observations.
SVS 20A:
We detect broad Br and CO emission, along with Br absorption. A marginal detection of weak CO absorption may also be present with the CO emission. The relatively warm Teff (5900K) we derive from photospheric lines in the Na and Mg/Al intervals and the presence of Br absorption at the same radial velocity, argues that the origin of the Br absorption is photospheric. If CO absorption is also present, it must originate in a disk or a wind, since photospheric CO is dissociated in warmer stars. If the CO feature is due to emission only, then its broadened double peaked profile suggests that it may originate in a wind at a high inclination angle (Chandler et al., 1995). The radial velocity of CO is blue-shifted (70 km s-1) relative to the systemic stellar velocity, in support of an outflow origin for the CO emission. This object is the warmest and most luminous protostar that we measure stellar properties for. Without making a correction for scattered light (see 3.8), we derive a stellar luminosity of 24.7 L⊙, based on the apparent flux at K from the North component (mk=8.7, Eiroa et al., 1987), adopting an H–K color of 2.16 observed in the total SVS 20 system (Kaas, 1999).
EC 129:
This source displays emission and absorption components in both CO and Br lines. EC 129 is cool enough (Teff= 4400K) for CO to exist in the photosphere, though the blue-shifted radial velocity (55 km s-1) relative to the systemic velocity of the star, argues against the presence of photospheric CO. Alternatively, CO can exist in absorption in the disk if the effective temperature of the disk increases faster than the surface temperature, favored in cases of high mass accretion (Calvet et al., 1991). The CO emission (blue-shifted even more than the absorption) could then be formed in an outflow wind, while the red-shifted (50 km s-1) Br absorption line indicates in-falling material and accretion.
DG Tau:
We do not detect any sign of CO overtone emission in our Nov. 2001 spectrum, as has been reported in the past (e.g. Chandler et al., 1995), though this source is known to have variable emission on week long time scales (reported in private communication). We find a good fit to the absorption lines, deriving an effective temperature of 4000K and = 4.0, with little rotation (24 km s-1), but significant veiling (rK = 2.0).
L1551 IRS5:
This prototypical bipolar molecular outflow has been well-studied for over 20 years (see review by Fridlund, Huldtgren, & Liseau, 1997). Though we did not detect HI Br emission or absorption in November 2001, this source has displayed a P-Cygni H profile early-on, suggesting that it is an FU Orionis class YSO (Mundt et al., 1985). We detect strong H2 emission with a complex velocity structure at 2.2235 m, indicating kinematically active shocked molecular gas. Based on K-band absorption lines of Na, Mg, and Al, we derive an effective temperature of 4800K, consistent with earlier estimates of its spectral type from spectroscopy and photometry (Carr, Harvey, & Lester, 1987; Kenyon & Hartmann, 1995). We also derive a slow rotation rate ( = 31 km s-1) and moderate veiling (rK = 1.0) in this embedded binary source.
Appendix B Atlas of Spectra


References
- Adams et al. (1987) Adams, F. C., Lada, C. J., & Shu, F. H. 1987, ApJ, 312, 788
- André et al. (1993) André, P., Ward-Thompson, D., & Barsony, M. 1993, ApJ, 406, 122
- Baldwin et al. (1973) Baldwin, J.R., Frogel, J.A., & Persson, S.E. 1973, ApJ, 184, 427
- Baraffe et al. (1997) Baraffe, I., Chabrier, G., Allard, F., & Hauschildt, P. H. 1997, A&A, 327, 1054
- Baraffe et al. (1998) Baraffe, I., Chabrier, G., Allard, F., & Hauschildt, P. H. 1998, A&A, 337, 403
- Barsony et al. (1997) Barsony, M., Kenyon, S.J., Lada, E.A., & Teuben P.J. 1997, ApJS, 112, 109
- Bertout et al. (1988) Bertout, C., Basri, G., & Bouvier, J. 1988, ApJ, 330, 350
- Calvet et al. (1991) Calvet, N., Patino, A., Magris, G. C., & D’Alessio, P. 1991, ApJ, 380, 617
- Carr, Harvey, & Lester (1987) Carr, J. S., Harvey, P. M., & Lester, D. F. 1987, ApJ, 321, L71
- Carr (1989) Carr, J. S. 1989, ApJ, 345, 522
- Carr & Tokunaga (1992) Carr, J. S. & Tokunaga, A. T. 1992, ApJ, 393, L67
- Carr et al. (1993) Carr, J. S., Tokunaga, A. T., Najita, J., Shu, F. H., & Glassgold, A. E. 1993, ApJ, 411, L37
- Casali & Matthews (1992) Casali, M. M. & Matthews, H. E. 1992, MNRAS, 258, 399
- Chandler et al. (1995) Chandler, C. J., Carlstrom, J. E., & Scoville, N. Z. 1995, ApJ, 446, 793
- Covey et al. (2005a) Covey, K. R., Greene, T. P., Doppmann, G. W., & Lada, C. J. 2005a, AJ, in press
- Covey et al. (2005b) Covey, K. R., Greene, T. P., Doppmann, G. W., & Lada, C. J. 2005b, in preparation
- de Jager & Nieuwenhuijzen (1987) de Jager, C. & Nieuwenhuijzen, H. 1987, A&A, 177, 217
- de Medeiros & Mayor (1999) de Medeiros, J. R. & Mayor, M. 1999, VizieR Online Data Catalog, 413, 990433
- de Zeeuw et al. (1999) de Zeeuw, P. T., Hoogerwerf, R., de Bruijne, J. H. J., Brown, A. G. A., & Blaauw, A. 1999, AJ, 117, 354
- Dent & Geballe (1991) Dent, W. R. F. & Geballe, T. R. 1991, A&A, 252, 775
- Doppmann & Jaffe (2003) Doppmann, G. W. & Jaffe, D. T. 2003, AJ, 126, 3030 (DJ03)
- Doppmann, Jaffe, & White (2003) Doppmann, G. W., Jaffe, D. T., White, R. J. 2003 AJ, 126, 3043
- Edwards et al. (1994) Edwards, S., Hartigan, P., Ghandour, L., & Andrulis, C. 1994, AJ, 108, 1056
- Eiroa et al. (1987) Eiroa, C., Lenzen, R., Leinert, C., & Hodapp, K.-W. 1987, A&A, 179, 171
- Eiroa & Casali (1992) Eiroa, C. & Casali, M. M. 1992, A&A, 262, 468
- Fridlund, Huldtgren, & Liseau (1997) Fridlund, M., Huldtgren, M., & Liseau, R. 1997, IAU Symp. 182: Herbig-Haro Flows and the Birth of Stars, 182, 19
- Geballe & Persson (1987) Geballe, T. R. & Persson, S. E. 1987, ApJ, 312, 297
- Gizis et al. (2002) Gizis, J. E., Reid, I. N., & Hawley, S. L. 2002, AJ, 123, 3356
- Goorvitch & Chackerian (1994) Goorvitch, D. & Chackerian, C. Jr. 1994, ApJS, 91, 483
- Gray (1992) Gray, D. F. 1992, The Observation and Analysis of Stellar Photospheres, (New York, Cambridge Univ. Press)
- Greene & Young (1992) Greene, T.P., & Young, E.T. 1992, ApJ, 395, 516
- Greene et al. (1994) Greene, T. P., Wilking, B. A., Andre, P., Young, E. T., & Lada, C. J. 1994, ApJ, 434, 614
- Greene & Meyer (1995) Greene, T. P. & Meyer, M. R. 1995, ApJ, 450, 233
- Greene & Lada (1996) Greene, T. P. & Lada, C. J. 1996, ApJ, 461, 345
- Greene & Lada (1997) Greene, T. P. & Lada, C. J. 1997, ApJ, 114, 2157
- Greene & Lada (2000) Greene, T. P. & Lada, C. J. 2000, ApJ, 120, 430
- Greene & Lada (2002) Greene, T. P. & Lada, C. J. 2002, AJ, 124, 2185
- Haisch et al. (2002) Haisch, K. E., Barsony, M., Greene, T. P., & Ressler, M. E. 2002, AJ, 124, 2841
- Hartmann (1994) Hartmann, L. 1994, NATO ASIC Proc. 417: Theory of Accretion Disks - 2, 19
- Hartmann et al. (1994) Hartmann, L., Hewett, R., & Calvet, N. 1994, ApJ, 426, 669
- Hauschildt et al. (1999) Hauschildt P. H., Allard, F. & Baron, E. 1999, ApJ, 512, 377
- Johns–Krull et al. (1999) Johns–Krull, C. M., Valenti, J. A., & Koresko, C. 1999, ApJ, 516, 900
- Johns–Krull et al. (2001) Johns–Krull, C. M., Valenti, J. A., Piskunov, N. E., Saar, S. H., & Hatzes, A. P. 2001, Magnetic Fields Across the Hertzsprung–Russell Diagram, ASP Conference Proceedings Vol. 248. Edited by G. Mathys, S. K. Solanki, and D. T. Wickramasinghe. ISBN: 1-58381-088-9. San Francisco: Astronomical Society of the Pacific, 2001., p.527, 527
- Kaas (1999) Kaas, A. A. 1999, AJ, 118, 558
- Kaas et al. (2004) Kaas, A. A., et al. 2004, A&A, 421, 623
- Kenyon & Hartmann (1990) Kenyon, S. J. & Hartmann, L. W. 1990, ApJ, 349, 197
- Kenyon et al. (1990) Kenyon, S. J., Hartmann, L. W., Strom, K. M., & Strom, S. E. 1990, AJ, 99, 869
- Kenyon et al. (1993) Kenyon, S. J., Whitney, B. A., Gomez, M., & Hartmann, L. 1993, ApJ, 414, 773
- Kenyon & Hartmann (1995) Kenyon, S. J. & Hartmann, L. 1995, ApJS, 101, 117
- Kenyon et al. (1998) Kenyon, S. J., Brown, D. I., Tout, C. A., & Berlind, P. 1998, ApJ, 115, 2491
- Kleinmann & Hall (1986) Kleinmann, S. G., & Hall, D. N. B. 1986, ApJS, 62, 501
- Koenigl (1991) Koenigl, A. 1991, ApJ, 370, L39
- Kurucz (1994) Kurucz, R. L. 1994, Atomic Data for Opacity Calculations, Kurucz CD–ROM No. 1
- Lada (1987) Lada, C. J. 1987, IAU Symp. 115: Star Forming Regions,115, 1
- Ladd, Lada, & Myers (1993) Ladd, E. F., Lada, E. A., & Myers, P. C. 1993, ApJ, 410, 168
- Lancon & Rocca–Volmerange (1992) Lancon, A., & Rocca–Volmerange, B. 1992, A&AS, 96, 593
- Larson (1969) Larson, R. B. 1969, MNRAS, 145, 297
- Luhman et al. (1998) Luhman, K. L., Rieke, G. H., Lada, C. J., & Lada, E. A. 1998, ApJ, 508, 347
- Luhman & Rieke (1999) Luhman. K. L. & Rieke, G. H. 1999, ApJ, 525, 440
- Martin & Whittet (1990) Martin, P. G. & Whittet, D. C. B. 1990,ApJ, 357, 113
- Massey (1997) Massey, P. 1997 A User’s Guide to CCD reductions with IRAF, National Optical Astronomy Observatory
- Massey et al. (1992) Massey, P., Valdes, F., Barnes, J. 1992 A Users’s Guide to Reducing Slit Spectra with IRAF, National Optical Astronomy Observatory
- McLean et al. (1998) McLean, I. S. et al. 1998, Proc. SPIE, 3354, 566
- Meyer et al. (1997) Meyer, M. R., Calvet, N., & Hillenbrand, L. A. 1997, AJ, 114, 288
- Mohanty & Basri (2003) Mohanty, S. & Basri, G. 2003, ApJ, 583, 451
- Moitinho et al. (2001) Moitinho, A., Alves, J., Huélamo, N., & Lada, C. J. 2001, ApJ, 563, L73
- Mundt et al. (1985) Mundt, R., Stocke, J., Strom, S. E., Strom, K. M., & Anderson, E. R. 1985, ApJ, 297, L41
- Muzerolle et al. (1998a) Muzerolle, J., Calvet, N., & Hartmann, L. 1998a, ApJ, 492, 743
- Muzerolle et al. (1998b) Muzerolle, J., Hartmann, L., & Calvet, N. 1998b, AJ, 116, 2965
- Najita et al. (1996) Najita, J., Carr, J. S., Glassgold, A. E., Shu, F. H., & Tokunaga, A. T. 1996, ApJ, 462, 919
- Nidever et al. (2002) Nidever, D. L., Marcy, G. W., Butler, R. P., Fischer, D. A., & Vogt, S. S. 2002, ApJS, 141, 503
- Ochsenbein et al. (2000) Ochsenbein, F., Bauer, P., & Marcout, J. 2000, A&AS, 143, 23
- Padgett (1996) Padgett, D. L. 1996, ApJ, 471, 847
- Preibisch & Zinnecker (1999) Preibisch, T. & Zinnecker, H. 1999, AJ, 117, 2381
- Preibisch et al. (2002) Preibisch, T., Brown, A. G. A., Bridges, T., Guenther, E., & Zinnecker, H. 2002, AJ, 124, 404
- Ramírez et al. (1997) Ramírez, S.V., DePoy, D.L., Frogel, J.A., Sellgren, K., & Blum, R.D. 1997, AJ, 113, 1411
- Scoville et al. (1983) Scoville, N., Kleinmann, S. G., Hall, D. N. B., & Ridgway, S. T. 1983, ApJ, 275, 201
- Shu et al. (1987) Shu, F. H., Adams, F. C., & Lizano, S. 1987, ARA&A, 25, 23
- Shu et al. (1994) Shu, F., Najita, J., Ostriker, E., Wilkin, F., Ruden, S., & Lizano, S. 1994, ApJ, 429, 781
- Siess et al. (1997) Siess, L., Forestini, M., & Dougados, C. 1997, A&A, 324, 556
- Siess et al. (1999) Siess, L., Forestini, M., & Bertout, C. 1999, A&A, 342, 480
- Slesnick et al. (2004) Slesnick, C. L., Hillenbrand, L. A., & Carpenter, J. M. 2004, ApJ, 610, 1045
- Sneden (1973) Sneden, C. 1973 PhD Thesis, University of Texas at Austin
- Spitzer (1948) Spitzer, L. J. 1948, ApJ, 108, 276
- Stahler (1994) Stahler, S. W. 1994, PASP, 106, 337
- Stahler et al. (1980) Stahler, S. W., Shu, F. H., & Taam, R. E. 1980, ApJ, 242, 226
- Straizys et al. (1996) Straizys, V., Cernis, K., & Bartasiute, S. 1996, Baltic Astronomy, 5, 125
- Strom et al. (1995) Strom, K. M., Kepner, J., & Strom, S. E. 1995, ApJ, 438, 813
- Tout et al. (1999) Tout, C. A., Livio, M., & Bonnell, I. A. 1999, MNRAS, 310, 360
- Vacca et al. (2003) Vacca, W. D., Cushing, M. C., & Rayner, J. T. 2003, PASP, 115, 389
- Whitney et al. (1997) Whitney, B. A., Kenyon, S. J., & Gomez, M. 1997, ApJ, 485, 703
- White & Hillenbrand (2004) White, R. J., & Hillenbrand, L. A. 2004, ApJ, 616, 998
- Wilking & Lada (1983) Wilking, B. A. & Lada, C. J. 1983, ApJ, 274, 698
- Wilking et al. (1989) Wilking, B. A., Lada, C. J., & Young, E. T. 1989, ApJ, 340, 823
- Wilking et al. (1992) Wilking, B. A., Greene, T. P., Lada, C. J., Meyer, M. R., & Young, E. T. 1992, ApJ, 397, 520
- Wynn-Williams (1982) Wynn-Williams, C. G. 1982, ARA&A, 20, 587


| Source | Region or | (J2000) | (J2000) | UT Date | Int. Time | S/N | Photospheric |
|---|---|---|---|---|---|---|---|
| Sp Type | hh mm ss.ss | (minutes) | Lines? | ||||
| 04016+2610 | Tau | 4 4 43.10 | 26 18 57.9 | 4-Nov-01 | 25.0 | 240 | yes |
| 04108+2803B | Tau | 4 13 54.89 | 28 11 30.5 | 6-Nov-01 | 20.0 | 110 | yes |
| 04158+2805 | Tau | 4 18 58.17 | 28 12 23.7 | 6-Nov-01 | 40.0 | 70 | yes |
| 04181+2655 | Tau | 4 21 10.94 | 27 2 5.9 | 6-Nov-01 | 30.0 | 120 | yes |
| DG Tau | Tau | 4 27 4.77 | 26 6 17.4 | 6-Nov-01 | 4.0 | 240 | yes |
| GV Tau S | Tau | 4 29 23.66 | 24 33 2.0 | 6-Nov-01 | 16.0 | 220 | yes |
| 04264+2433 | Tau | 4 29 30.01 | 24 39 55.6 | 6-Nov-01 | 48.0 | 190 | yes |
| L1551 IRS5 | Tau | 4 31 34.10 | 8 8 8.0 | 6-Nov-01 | 20.0 | 100 | yes |
| 04295+2251 | Tau | 4 32 32.07 | 22 57 30.3 | 5-Nov-01 | 33.3 | 205 | yes |
| Haro 6-28 | Tau | 4 35 56.77 | 22 54 36.5 | 5-Nov-01 | 20.0 | 110 | yes |
| 04361+2547 | Tau | 4 39 13.43 | 25 53 19.2 | 5-Nov-01 | 44.0 | 230 | no |
| 04365+2535 | Tau | 4 39 34.99 | 25 41 46.7 | 4-Nov-01 | 60.0 | 210 | no |
| 04489+3042 | Tau | 4 52 6.87 | 30 47 17.2 | 4-Nov-01 | 16.7 | 120 | yes |
| CRBR 12 | Oph | 16 26 17.23 | -24 23 44.6 | 20-Jun-03 | 50.0 | 50 | yes |
| CRBR 85 | Oph | 16 26 17.23 | -24 23 44.6 | 20-Jun-03 | 120.0 | 15 | noaaCO and Na line absorption is marginally detected in this source, but at too low a signal to noise needed for us to apply our standard fitting technique. |
| GSS 30 | Oph | 16 26 21.42 | -24 23 6.3 | 8-Jul-01 | 30.0 | 395 | no |
| GY 21 | Oph | 16 26 23.56 | -24 24 38.2 | 10-Jul-01 | 16.7 | 170 | yes |
| 162636 | Oph | 16 26 36.90 | -24 15 54.0 | 10-Jul-01 | 15.0 | 100 | yes |
| GY 91 | Oph | 16 26 40.43 | -24 27 15.1 | 21-Jun-03 | 40.0 | 55 | yes |
| WL 12bbSource was observed on multiple nights. The final spectrum is the noise weighted sum of spectra obtained on each individual night. No shifting of the spectra was required as radial velocity differences were less than 1 pixel (4.5 km s-1). | Oph | 16 26 44.10 | -24 34 47.8 | 7-Jul-01,8-Jul-01 | 87.3 | 215 | yes |
| WL 1 | Oph | 16 27 3.98 | -24 28 27.5 | 30-May-00 | 30.0 | 35 | yes |
| WL 17 | Oph | 16 27 6.69 | -24 38 15.3 | 10-Jul-01 | 30.0 | 140 | yes |
| GY 224 | Oph | 16 27 11.25 | -24 40 47.0 | 10-Jul-01 | 50.0 | 150 | yes |
| WL 19 | Oph | 16 27 11.60 | -24 38 32.0 | 30-May-00 | 20.0 | 85 | yes |
| WL 3 | Oph | 16 27 19.20 | -24 28 40.5 | 10-Jul-01 | 40.0 | 95 | yes |
| WL 6 | Oph | 16 27 21.62 | -24 29 51.3 | 19-Jun-03 | 40.0 | 150 | no |
| IRS 43 | Oph | 16 27 26.96 | -24 40 50.0 | 7-Jul-01 | 73.3 | 330 | yes |
| YLW 16AbbSource was observed on multiple nights. The final spectrum is the noise weighted sum of spectra obtained on each individual night. No shifting of the spectra was required as radial velocity differences were less than 1 pixel (4.5 km s-1). | Oph | 16 27 27.84 | -24 39 31.9 | 8-Jul-01,9-Jul-01 | 38.0 | 170 | yes |
| YLW 16B | Oph | 16 27 29.29 | -24 39 15.8 | 30-May-00 | 20.0 | 180 | no |
| VSSG 17 | Oph | 16 27 30.39 | -24 27 43.7 | 10-Jul-01 | 6.0 | 160 | yes |
| IRS 51ccThe final spectrum is the noise weighted sum of spectra obtained on both nights. The 8 July observation exhibits slightly broader and asymmetric lines suggesting the presence of a cooler ( 3900 K) binary companion with a marginal velocity separation ( 2 resolution elements). | Oph | 16 27 39.53 | -24 43 14.1 | 8-Jul-01,20-Jun-03 | 50.0 | 330 | yes |
| IRS 63 | Oph | 16 31 35.53 | -24 1 28.3 | 30-May-00 | 30.0 | 140 | yes |
| IRS 67bbSource was observed on multiple nights. The final spectrum is the noise weighted sum of spectra obtained on each individual night. No shifting of the spectra was required as radial velocity differences were less than 1 pixel (4.5 km s-1). | Oph | 16 32 1.05 | -24 56 44.6 | 7-Jul-01,8-Jul-01 | 80.0 | 330 | yes |
| EC 38 | Ser | 18 29 49.50 | 1 17 7.0 | 20-Jun-03 | 90.0 | 70 | yes |
| EC 53bbSource was observed on multiple nights. The final spectrum is the noise weighted sum of spectra obtained on each individual night. No shifting of the spectra was required as radial velocity differences were less than 1 pixel (4.5 km s-1). | Ser | 18 29 51.20 | 1 16 42.0 | 7-Jul-01,19-Jun-03 | 104.0 | 120 | yes |
| SVS 2 | Ser | 18 29 56.79 | 1 14 46.1 | 29-May-00 | 12.0 | 150 | no |
| EC 89 | Ser | 18 29 57.50 | 1 12 59.0 | 8-Jul-01 | 40 | 40 | noaaCO and Na line absorption is marginally detected in this source, but at too low a signal to noise needed for us to apply our standard fitting technique. |
| EC 88 | Ser | 18 29 57.50 | 1 12 59.0 | 21-Jun-03 | 60.0 | 60 | no |
| EC 91 | Ser | 18 29 57.70 | 1 12 28.0 | 20-Jun-03 | 60.0 | 50 | yes |
| EC 92 | Ser | 18 29 57.70 | 1 12 52.0 | 7-Jul-01 | 46.0 | 195 | yes |
| SVS 20A | Ser | 18 29 57.77 | 1 14 7.2 | 30-May-00 | 4.0 | 120 | yes |
| EC 94 | Ser | 18 29 57.80 | 1 12 37.0 | 19-Jun-03 | 60.0 | 80 | yes |
| EC 95 | Ser | 18 29 57.90 | 1 12 47.2 | 30-May-00 | 20.0 | 140 | yes |
| EC 103 | Ser | 18 29 58.70 | 1 14 26.0 | 8-Jul-01 | 40.0 | 145 | no |
| EC 125 | Ser | 18 30 1.90 | 1 14 1.0 | 21-Jun-03 | 30.0 | 45 | yes |
| EC 129 | Ser | 18 30 2.80 | 1 12 28.0 | 8-Jul-01 | 38.7 | 210 | yes |
| TS 13.1 | CrA | 19 1 41.40 | -36 58 34.0 | 29-May-00 | 8.0 | 180 | yes |
| RCrA IRS5 | CrA | 19 1 48.00 | -36 57 19.0 | 21-Jun-03 | 10.0 | 70 | yes |
| TS 2.6 | CrA | 19 1 49.78 | -36 58 12.0 | 29-May-00 | 4.0 | 190 | no |
| RCrA IRS9 | CrA | 19 1 53.10 | -36 57 4.0 | 21-Jun-03 | 53.3 | 90 | yes |
| 03260+3111A | Per | 3 29 10.49 | 31 21 51.2 | 5-Nov-01 | 6.0 | 205 | yes |
| 03260+3111B | Per | 3 29 10.49 | 31 21 51.2 | 5-Nov-01 | 20.0 | 70 | yes |
| MK Standards | |||||||
| GL 15A | M2 V | 0 18 18.70 | 44 1 23.3 | 29-May-00 | 1.0 | 110 | yes |
| GL 28 | K2 V | 0 40 48.40 | 40 11 14.7 | 29-May-00 | 2.0 | 115 | yes |
| GL 338B | K7 V | 9 14 26.50 | 52 41 15.9 | 30-May-00 | 0.7 | 200 | yes |
| GL 338A | M0 V | 9 14 28.70 | 52 41 15.3 | 29-May-00 | 2.0 | 185 | yes |
| GJ 402 | M4 V | 10 50 52.40 | 6 48 31.6 | 30-May-00 | 5.0 | 110 | yes |
| GJ 406 | M6 V | 10 56 29.10 | 7 0 56.1 | 30-May-00 | 4.0 | 75 | yes |
| HR 4358 | K3 III | 11 14 1.80 | 8 3 38.0 | 30-May-00 | 1.3 | 180 | yes |
| HR 4496 | G8 V | 11 41 3.20 | 34 12 5.7 | 29-May-00 | 1.0 | 215 | yes |
| HR 5150 | M1.5 III | 13 41 36.70 | -8 42 11.0 | 30-May-00 | 0.2 | 130 | yes |
| LHS 2924 | M9 V | 14 28 43.22 | 33 10 35.3 | 20-Jun-03 | 30.0 | 300 | yes |
| GJ 569B | M8.5 V | 14 54 28.97 | 16 6 4.8 | 19-Jun-03 | 16.0 | 265 | yes |
| GJ 569A | M3 V | 14 54 29.31 | 16 6 3.4 | 19-Jun-03 | 0.7 | 265 | yes |
| HD 131976 | M1 V | 14 57 26.79 | -21 24 26.8 | 21-Jun-03 | 0.4 | 450 | yes |
| HR 5568 | K4 V | 14 57 27.90 | -21 24 56.0 | 29-May-00 | 1.0 | 240 | yes |
| VB 8 | M7 V | 16 55 35.16 | -8 23 45.4 | 21-Jun-03 | 6.0 | 260 | yes |
| HD 157881 | K7 V | 17 25 45.10 | 2 6 37.0 | 21-Jun-03 | 0.6 | 350 | yes |
| HD 166620 | K2 V | 18 9 37.32 | 38 27 26.3 | 21-Jun-03 | 0.5 | 315 | yes |
| HD 168387 | K2 III | 18 19 9.53 | 7 15 35.1 | 21-Jun-03 | 0.1 | 250 | yes |
| HD 175225 | K1 IV | 18 51 34.88 | 52 58 30.0 | 21-Jun-03 | 0.2 | 220 | yes |
| VB 10 | M8 V | 19 16 57.53 | 5 8 55.5 | 20-Jun-03 | 10.0 | 295 | yes |
| HD 182572 | G8 IV | 19 24 58.22 | 11 56 40.2 | 20-Jun-03 | 0.1 | 360 | yes |
| HD 184489 | M0 V | 19 34 39.96 | 4 34 58.1 | 20-Jun-03 | 0.8 | 400 | yes |
| GJ 1245A | M5.5 V | 19 53 54.58 | 44 24 49.8 | 19-Jun-03 | 2.7 | 360 | yes |
| GJ 791.2 | M4.5 V | 20 29 48.57 | 9 41 19.6 | 20-Jun-03 | 3.0 | 255 | yes |
| GJ 806 | M2 V | 20 45 4.24 | 44 29 57.6 | 19-Jun-03 | 2.0 | 175 | yes |
| HD 201091 | K5 V | 21 6 55.19 | 38 45 9.3 | 21-Jun-03 | 0.1 | 250 | yes |
| GJ 4281 | M6.5 V | 22 28 54.52 | -13 25 25.0 | 21-Jun-03 | 16.0 | 240 | yes |
| HD 219134 | K3 V | 23 13 17.87 | 57 10 7.1 | 21-Jun-03 | 0.4 | 433 | yes |
| Spectral Lines | Tau | Oph | Ser | CrA | Per | Total |
|---|---|---|---|---|---|---|
| Mg/Al, Na, or 12CO (absorption)aaCO emission and absorption components were present in 2 sources (EC 129 & SVS 20A) and are included here. | 11/13 | 16/20 | 9/13 | 3/4 | 2/2 | 41/52 |
| Br (absorption)bbSix sources showed both Br emission and absorption, and are included in here. | 1/13 | 2/20 | 6/13 | 0/4 | 1/2 | 10/52 |
| Br (emission)bbSix sources showed both Br emission and absorption, and are included in here. | 9/13 | 13/20 | 9/13 | 3/4 | 0/2 | 34/52 |
| 12CO (emission)aaCO emission and absorption components were present in 2 sources (EC 129 & SVS 20A) and are included here. | 2/13 | 1/20 | 3/13 | 2/4 | 0/2 | 8/52 |
| H2 1-0 S(0) (emission) | 10/13 | 8/20 | 3/13 | 1/4 | 1/2 | 23/52 |
| Source | Teff | error | error | error | rK | error | vlsraaA systematic shift of +1.8 km s-1 has been applied to these values, consistent with our radial velocity measurements measured in MK standards with published values (Fig. 13). | L∗bbStellar luminosities are based on derived K-band extinctions which have been elevated by 0.88 magnitudes to account for the effects of scattered light (see 3.8). | ||
|---|---|---|---|---|---|---|---|---|---|---|
| (K) | (cm s-2) | (km s-1) | (km s-1) | (L/L⊙) | ||||||
| 04016+2610 | 4500 | 68 | 3.5 | 0.05 | 46 | 2.7 | 0.9 | 0.02 | -12.8 | 4.9 |
| 04108+2803B | 3500 | 22 | 3.5 | 0.03 | 14 | 3.3 | 1.1 | 0.08 | 5.4 | 0.4 |
| 04158+2805 | 3500 | +213, -124 | 3.8 | +0.40, -0.11 | 26 | 1.2 | 1.3 | +0.21, -0.19 | 5.9 | 0.1 |
| 04181+2655 | 4000 | +202, -301 | 4.2 | +0.30, -0.50 | 33 | +1.3, -0.9 | 0.2 | 0.004 | 5.6 | 1.8 |
| DG Tau | 4000 | +105, -33 | 4.0 | +0.12, -0.06 | 24 | 2.0 | 2.0 | 0.10 | 7.1 | 5.5 |
| GV Tau S | 4500 | 25 | 4.4 | 0.06 | 27 | 1.6 | 1.8 | 0.003 | -7.2 | 3.3 |
| 04264+2433 | 4000 | 41 | 3.9 | 0.12 | 32 | 2.4 | 1.4 | 0.03 | 4.3 | 0.9 |
| L1551 IRS5 | 4800 | 154 | 4.0 | 0.14 | 31 | 2.4 | 1.0 | 0.30 | 1.2 | 2.6 |
| 04295+2251 | 3400 | 40 | 3.5 | 0.02 | 51 | 1.9 | 0.3 | 0.01 | 3.7 | 1.2 |
| Haro 6-28 | 3400 | +35, -106 | 4.1 | +0.06, -0.31 | 17 | +2.2, -2.4 | 0.6 | +0.11, -0.04 | 3.5 | 0.4 |
| 04489+3042 | 3100 | 19 | 3.5 | 0.07 | 17 | 2.2 | 1.4 | 0.11 | -17.5 | 0.3 |
| CRBR 12 | 3600 | +89, -313 | 4.5 | +0.09, -0.71 | 40 | 3.7 | 2.0 | +0.64, -0.57 | -8.5 | 1.0 |
| GY 21 | 3900 | 37 | 3.8 | 0.09 | 24 | 2.4 | 1.4 | 0.03 | 1.5 | 0.8 |
| 162636 | 3700 | 56 | 4.3 | 0.09 | 27 | 4.7 | 1.9 | 0.06 | 3.7 | 0.4 |
| GY 91 | 3300 | 30 | 3.7 | 0.03 | 12 | 0.9 | 0.3 | 0.01 | 3.5 | 1.7 |
| WL 12 | 4000 | +403, -46 | 3.6 | +0.71, -0.12 | 35 | 3.4 | 2.8 | +0.71, -0.12 | 1.2 | 2.1 |
| WL 1 | 3300 | 12 | 3.5 | 0.02 | 14 | 0.8 | 0.8 | 0.004 | -12.7 | 0.7 |
| WL 17 | 3400 | +203, -34 | 3.7 | +0.4, -0.05 | 12 | +4.3, -4.4 | 3.9 | +0.77, -0.80 | 4.4 | 1.8 |
| GY 224 | 3500 | +306, -116 | 3.7 | +0.50, -0.21 | 10 | 5.1 | 4.4 | 0.75 | 2.2 | 0.7 |
| WL 19 | 4200 | +143, -246 | 4.6 | +0.19, -0.44 | 19 | +3.5, -3.6 | 3.7 | +0.31, -0.37 | -16.6 | 10.3 |
| WL 3 | 3300 | +202, -28 | 3.7 | +0.41, -0.08 | 37 | 2.1 | 0.5 | +0.04, -0.11 | -2.3 | 2.3 |
| IRS 43 | 4400 | +118, -405 | 4.2 | +0.32, -0.61 | 48 | +3.5, -3.9 | 1.8 | +0.11, -0.20 | 1.8 | 19.0 |
| YLW 16A | 4400 | +62, -118 | 4.5 | +0.10, -0.22 | 29 | 3.5 | 2.2 | +0.23, -0.25 | 3.7 | 9.8 |
| VSSG 17 | 3500 | 42 | 3.5 | 0.08 | 43 | 1.7 | 0.5 | 0.005 | 1.0 | 9.7 |
| IRS 51 | 4200 | +208, -116 | 3.7 | +0.30, -0.11 | 44 | 2.8 | 1.8 | +0.10, -0.01 | 9.1 | 21.7 |
| IRS 63 | 4200 | +144, -103 | 3.5 | +0.13, -0.08 | 45 | +3.1, -2.9 | 1.7 | +0.32, -0.34 | -26.5 | 3.8 |
| IRS 67 | 4300 | 91 | 3.5 | 0.10 | 55 | 3.0 | 1.0 | 0.02 | -0.7 | 11.6 |
| EC 38 | 3400 | +107, -37 | 3.5 | +0.22, -0.10 | 34 | +2.5, -2.7 | 0.9 | +0.10, -0.006 | 10.8 | 1.9 |
| EC 53 | 3400 | +304, -47 | 3.5 | +0.41, -0.08 | 24 | 4.3 | 1.8 | +0.40, -0.26 | 4.3 | 0.4 |
| EC 91 | 3600 | 74 | 3.8 | 0.14 | 17 | 0.9 | 1.1 | 0.07 | 4.8 | 1.0 |
| EC 92 | 4200 | 17 | 3.5 | 0.02 | 47 | 0.9 | 0.0 | +0.002 | 9.4 | 6.5 |
| SVS 20A | 5900 | +205, -228 | 3.5 | 0.23 | 52 | +6.0, -6.1 | 0.7 | +0.1, -0.007 | -8.3 | 55.6 |
| EC 94 | 4000 | +301, - 24 | 3.6 | +0.30, -0.05 | 36 | 1.6 | 0.5 | 0.004 | 5.8 | 4.3 |
| EC 95 | 4400 | +115, -57 | 3.5 | +0.10, -0.03 | 56 | 1.1 | 0.1 | 0.002 | -14.5 | 22.8 |
| EC 125 | 3000 | 26 | 4.0 | 0.26 | 30 | 2.4 | 0.8 | 0.09 | 5.7 | 0.2 |
| EC 129 | 4400 | 74 | 3.5 | 0.06 | 35 | 2.2 | 0.6 | 0.004 | 10.0 | 5.2 |
| TS 13.1 | 4400 | +69, -212 | 4.5 | +0.14, -0.42 | 34 | +2.6, -2.8 | 2.7 | +0.03, -0.2 | 14.5 | … |
| RCrA IRS5 | 3700 | +203, -107 | 3.7 | +0.31, -0.21 | 36 | 1.1 | 0.3 | 0.01 | 1.6 | … |
| RCrA IRS9 | 3800 | +100, -9 | 4.1 | +0.2, -0.01 | 5 | +1.9, -1.6 | 0.0 | 0.01 | 5.3 | … |
| 03260+3111A | 5600 | 112 | 3.5 | 0.13 | 76 | 4.6 | 0.0 | 0.01 | 6.2 | … |
| 03260+3111B | 3400 | +39, -204 | 3.9 | +0.05, -0.30 | 23 | 1.6 | 0.3 | 0.04 | 3.9 | … |