C and N Abundances in Stars At the Base of the Red Giant Branch in M15 11affiliation: Based on observations obtained at the W.M. Keck Observatory, which is operated jointly by the California Institute of Technology, the University of California and the National Aeronautics and Space Administration
Abstract
We present an analysis of a large sample of moderate resolution Keck LRIS spectra of subgiants and stars at the base of the RGB in the Galactic globular cluster M15 (NGC 7078), most within the range , with the goal of deriving C abundances (from the G band of CH) and N abundances (from the NH band at 3360 Å). Star-to-star stochastic variations with significant range in both [C/Fe] and [N/Fe] are found at all luminosities extending to the subgiants at .
The C and N abundances appear anti-correlated, as would be expected from the CN-cycle processing of stellar material. Yet these M15 stars are considerably fainter than the RGB bump, the point at which deep mixing is believed to set in. On this basis, while the observed abundance pattern is consistent with proton capture nucleosynthesis, we infer that the site of the reactions is likely not within the present sample. The range of variation of the N abundances is very large and the sum of C+N increases as C decreases. To reproduce this requires the incorporation not only of CN but also of ON-processed material.
Combining our work with that of Trefzger et al. (1983) for the brighter giants in M15, we find strong evidence for additional depletion of C among the most luminous giants. This presumably represents the first dredge up (with enhanced deep mixing) expected for such luminous cluster RGB stars in the course of normal stellar evolution as they cross the RGB bump.
We compare the behavior of these patterns for C and N in globular clusters covering a wide range of metallicity and of current mass. While all clusters studied show strong anti-correlated variations of C and N at all luminosities probed, the metal rich clusters (M71, 47 Tuc and M5) do not show evidence for the first dredge up among their most luminous giants, while the metal poor ones (M5, M13, M92 and M15) do. Conversely, the metal poor clusters do not show evidence for the bimodality in CH and CN line strengths seen in the metal rich clusters.
The collected data on C and N abundances in low luminosity GC stars cannot be explained by the commonly invoked models for the chemical evolution of GC stars; in particular “pollution” of existing low mass stars by ejecta from intermediate mass AGB stars can be ruled out. Pollution of cluster gas by such stars prior to the formation of the lower mass stars we observe today can also be ruled out unless current models of nucleosynthesis and dredge up into the surface layers of AGB stars are flawed; such models agree qualitatively but disagree quantitatively with our data. We are forced to assume that there was an extended period of star formation in GCs, and that a previous generation of more massive stars evolved, ejected mass, and “polluted” with light elements the GC gas; the low mass stars we see today formed afterwards. A tentative scenario is developed involving a initial phase of star formation heavily biased towards high mass stars, with subsequent formation of intermediate, then low mass stars.
1 Introduction
By virtue of their large populations of coeval stars, the Galactic globular clusters present us with a unique laboratory for the study of the evolution of low mass stars. The combination of their extreme ages, compositions and dynamics also allows us a glimpse at the early history of the Milky Way and the processes operating during its formation. These aspects become even more significant in the context of the star-to-star light element inhomogeneities found among red giants in every cluster studied to date. The large differences in the surface abundances of C, N, O, and often Na, Mg, and Al have defied a comprehensive explanation in the three decades since their discovery.
Proposed origins of the inhomogeneities typically break down into two scenarios: 1) As C, N, O, Na, Mg, and Al are related to proton capture processes at CN and CNO-burning temperatures, material cycled through a region in the upper layers of the H-burning shell in evolving cluster giants may be brought to the surface with accompanying changes in composition; see Sweigart & Mengel (1979) and Charbonnel (1994) for an introduction to the relevant theory of mixing. There is ample observational evidence that deep mixing takes place during the red giant branch (RGB) ascent of metal-poor cluster stars (see the reviews of Kraft 1994, Pinsonneault 1997, & Gratton, Sneden & Carretta 2004 and references therein). 2) It has also become apparent that at least some component of these abundance variations must be in place before some cluster stars reach the giant branch. Spectroscopic observations of main sequence turn-off stars in 47 Tuc (beginning with Hesser 1978, see Cannon et al. 1998, Briley et al. 2004a and references therein) demonstrate this. Our own work with large samples of low luminosity stars in M71 (Cohen 1999, Briley & Cohen 2001, Ramírez & Cohen 2002) and in M13 (Briley, Cohen & Stetson 2002, 2004b and Cohen & Melendez 2004) have shown variations in CN and CH-band, O and Na line strengths among subgiants and main sequence stars consistent with patterns found among the evolved giants of these clusters. The low mass cluster stars we observe are, however, incapable of both deep dredge-up and significant CNO nucleosynthesis while on the main sequence. Hence the early cluster material must have been at least partially inhomogeneous in these elements or some form of modification of these elements took place within the cluster. Suggested culprits include mass-loss from intermediate mass asymptotic giant branch stars and supernovae ejecta. Cannon et al. (1998) present an excellent discussion of these possibilities.
Thus the observed light element inhomogeneities imply that there is some aspect of the structure of the evolving cluster giants which remains poorly understood (the deep mixing mechanism), that the early proto-clusters may have been far less homogeneous, that intermediate mass stars may have played a greater role in setting the composition of the present day low mass stars than previously thought, etc. It is this set of issues that we explore in the present series of papers. In our earlier work we studied the C and N abundances for large samples of stars in the globular clusters M71 (Cohen, 1999; Briley & Cohen, 2001), M5 (Cohen, Briley & Stetson, 2004) and M13 (Briley, Cohen & Stetson, 2002, 2004b) (collectively denoted GC–CN). We consider here the extremely metal poor globular cluster M15. In this range of metallicity and luminosity (i.e. ), the CN bands at 3880 and at 4220 Å in the spectra of the M15 stars are too weak to be useful, so we rely on the CH and NH band strengths to derive C and N abundances for a large sample of stars in M15. We adopt values from the on-line database of Harris (1996) for the apparent distance modulus of M15 at of 15.31 mag with a reddening of E(B–V) = 0.09 mag, supported by analysis of deep HST photometry by Recio-Blanco et al. (2004). We adopt the metallicity [Fe/H] = 2.2 dex, also from Harris (1996); Sneden et al. (1991) in a high dispersion abundance analysis of a large sample of stars on the upper giant branch of M15 found a somewhat lower value.
We describe the sample in §2 and 3. We outline our measurement of the molecular band indices and their interpretation in §4. With an assumption about the O abundance, these are converted into C and N abundances, from which we find an anti-correlation between C and N in §5. A consideration of the need for ON burning follows in §7. A discussion of our results together with a comparison with the trends seen among the red giants in M15 with our earlier work, which now covers four globular clusters spanning a wide range of metallicity, combined with data from the literature, is given in §8, while §9 discusses the implications of our results for the mechanism producing the C and N differences. Inferences we can draw from this for the formation and early chemical history of globular clusters are given in §10. A brief summary concludes the paper.
2 Photometric Databases
The optical photometry of M15 employed here was carried out as part of a larger program to provide homogeneous photometry for star clusters and nearby resolved galaxies (Stetson, 2000). The general characteristics of the photometric database are described in detail in Cohen, Briley & Stetson (2004) for the case of M5; the case of M15 is similar. At the time the present photometry for M15 was derived, the corpus of M15 images in Stetson’s database included some 307 images in , 340 images in , and 181 in . The images did not all cover the same region of sky, of course, and any given star fell within no more than 235 images, 239 images, or 179 images. A network of local standards supported appropriate transformations for those images taken under non-photometric conditions. In our experience, photometry from datasets such as those employed here typically display an external accuracy of order 0.02 mag per observation; this level of observation-to-observation scatter is probably dominated by temporal and spatial fluctuations in the instantaneous atmospheric extinction, and probably also by the difficulty of obtaining truly appropriate flat-field corrections in the presence of such effects as scattered light, ghosts, fringing and spectral mismatch between the flat-field illumination and the astronomical scene. The fundamental system is that of Landolt (1992).
The absolute astrometry of our catalog is based upon the United States Naval Observatory Guide Star Catalogue I (A V2.0; henceforth USNOGSC, Monet et al. 1998), access to which is obtained by PBS through the services of the Canadian Astronomy Data Centre. Throughout the region of our field that is well populated by USNOGSC stars (including essentially all of the stars in our present spectroscopic sample), we expect systematic errors of our right ascensions and declinations on the system of the USNOGSC to be arcsec. Individual random errors in our coordinate measurements are probably not much better than 0.02 arcsec on a star-by-star basis, the errors becoming somewhat worse than this for the fainter and more crowded stars in our photometric/astrometric sample.
The alignment images for the slitmasks used with the Low Resolution Imaging Spectrometer (LRIS) (Oke et al., 1995) were taken with or filters. Although these exposures were short (1 sec typically), they were used to determine mags for the faintest stars, particularly those that were somewhat crowded, in our sample in M15.
To broaden the wavelength range of our photometry, we attempted to obtain infrared colors from the 2MASS database (Skrutskie et al., 1997; Cutri et al., 2003) for the stars in our sample. However, many of them are too faint to be included therein. Thus in Sep. 2004 we observed the fields of our M15 sample with the Wide Field Infrared Camera (Wilson et al., 2003) at the 5-m Hale Telescope for the purpose of establishing reliable J,K magnitudes for the fainter stars in our sample. The 2MASS colors of nearby isolated somewhat brighter stars were used to calibrate our WIRC photometry. Total integrations of 10 min to 30 min for each of the two filters in each of the two fields were obtained. These images were reduced using Figaro (Shortridge, 1993) and DAOPHOT (Stetson, 1987).
Most other recent photometric studies of M15 (Buonanno, Corsi & Fusi Pecci, 1987; DaCosta & Armandroff, 1990) do not reach as faint as the bulk of our sample. The deep CMD study of Durrell & Harris (1992), which focuses on the age of the cluster, its distance, and its luminosity function along the main sequence, does not cover the full sample of our stars.
Stars are identified in this paper by a name derived from their J2000 coordinates, so that star C12345_5432 has coordinates 21 12 34.5 +12 54 32.
3 Spectroscopic Observations
The initial sample of stars consisted of those from the photometric database located more than 180 arcsec from the center of M15 (to avoid crowding) with and with within 0.06 mag of the cluster locus, which we take as mag. The main sequence turnoff of M15 is at mag, so these stars include subgiants as well as low luminosity giants near the base of the RGB. (A preliminary version of the photometric catalog described in §2 was used for this purpose.) From this list, two slitmasks containing about 25 slitlets each were designed using JGC’s software. The center of the first field was roughly 3.2 arcmin E and 0.7 arcmin N of the center of M15, while the center of the second field was located roughly 2.8 arcmin W and 2.9 arcmin S of the cluster center.
These slitmasks were used with LRIS at the Keck Observatory in June 2003. Three 1200 sec exposures were obtained for the second mask and two 1200 sec exposures for the first slitmask. The airmass was less than 1.06 for all exposures, so differential refraction did not play a role even at 3200 Å. The exposures were dithered by moving the stars along the length of the slitlets by 2 arcsec between each exposure. Because of the crowded fields, there was often more than one suitably bright object in each slitlet. The width of the slitlets was 0.8 arcsec, narrower than normal to enhance the spectral resolution. LRIS-B (McCarthy et al., 1998) was used with a 400 line grism giving a dispersion of 1.0 Å/pixel (4.0 Å resolution for a 0.8 arcsec wide slit). This gave good coverage of the region from 3000 to 5000 Å, including the key NH band at 3360 Å and the G band of CH at 4300 Å. The CN bands at 3880 and 4200 Å, while included within the spectral range covered, are for most of these low luminosity very metal-poor stars too weak to be measured with precision; they were not used at all. The red side of LRIS was configured to use a 1200 g/mm grating centered at H with the intention of providing higher accuracy radial velocities. The dispersion is then 0.64 Å/pixel (29 km s-1/pixel) or 1.9 Å/spectral resolution element. Figaro (Shortridge, 1993) scripts were used for the data reduction.
The original detector of LRIS-B was upgraded to a new one with much higher UV sensitivity prior to these observations. This was crucial to the success of our effort. However, there were some unexpectedly severe reflection problems in our blue-channel spectra. These were perhaps exacerbated by the many bright stars in the field. The reflections were non-dispersed, aligned along the slit, and several times the height of a stellar image. They were removed partially by sky subtraction, but the resulting spectra had to be hand checked, with additional corrections applied as necessary. This was done for each individual exposure, then the resulting spectra for each star were summed. In addition, the LRIS-B images were not flattened, as there is no suitably bright featureless UV calibration lamp at the Keck Observatory. The pixel-to-pixel variation is small in these detectors, and each spectrum is the sum of several exposures which fell in different locations on the detector array. Furthermore, the projected image size of a point source along the slit has a FWHM of 3 to 4 pixels, so many pixels are sampled in forming the final 1D spectrum for each star. We therefore are confident that the lack of flat fielding does not introduce spurious small scale features.
The final spectrum summed over the three 1200 sec exposures of a M15 star in our sample with mag has roughly 9000 detected electrons per spectral pixel (1.0 Å) in the region of the G band of CH, and roughly 1100 detected electrons per spectral pixel in the blue continuum bandpass for the NH feature. For a mag star in the slitmask with only two 1200 sec exposures (stars numbered C30…), there are roughly 6000 detected electrons per spectral pixel (1.0 Å) in the region of the G band of CH, and roughly 500 detected electrons per spectral pixel in the blue continuum bandpass for the NH feature. Thus the uncertainties in the measured CH and NH indices are not dominated by Poisson statistics, even for the faintest stars in our sample in M15, but rather by the various instrumental issues described above.
In addition to the primary sample described above, since these fields are rather crowded, other stars sometimes serendipitously fell into the slitlets. If they were bright enough, their spectra were also reduced. We refer to the latter as the secondary sample. As might be expected from the luminosity function, most of the secondary sample consists of stars at or just below the main sequence turnoff.
3.1 Membership
The galactic latitude of M15 is only . Even though our fields are as close to the center of the cluster as possible, the cluster is more distant than ones we previously studied, and our sample consists of faint stars. Establishing membership is a concern. The primary basis for determining membership is through the spectra. M15 is a very metal poor cluster, so that these moderate resolution spectra are in themselves capable of confirming membership. Table 1 gives the photometry for the 68 sample stars we believe to be members of M15. Three non-members were culled from our sample as their spectra show absorption features much stronger than expected; they are listed at the end of this table.
The CMD diagrams can also be used to eliminate non-members. colors were used to select the primary sample, but they (and other colors) can provide constraints for the secondary stars. Fig. 1 shows the and CMD diagrams for our sample in M15 with a 12 Gyr isochrone with [Fe/H] dex from Yi et al. (2001) superposed in each case. The star at the lower left is a hot horizontal branch star; it is part of the secondary sample. The spectroscopic non-members are indicated by large open circles; they all line on the cluster isochrone in the CMD, and two do for the CMD, with the third only slightly off it. Thus photometry alone, while it can eliminate many non-members of M15 from our sample selected for spectroscopy, is not sufficient in itself.
The magnitude of the radial velocity of M15 is sufficiently high to establish membership through measurements on the red spectra, which are of higher spectral resolution than those from LRIS-B with the adopted instrument configuration. Given the extreme metal deficiency of the stars and the foreground reddening, which produces easily detectable interstellar NaD lines, we rely exclusively on H for this purpose. Thus these measurements are not of high accuracy, with typical uncertainty of km s-1. A histogram of the radial velocities for 50 stars from our sample is shown in Fig. 2. The three spectroscopic non-members culled from our sample are indicated. This figure demonstrates that the vast majority of the stars in our sample are members of M15.
The spectra of star C29445_0952 (V=16.88) in our sample are more extended along the slit than that of a point source and clearly indicate that there are two different stars contributing. The photometric database and the LRIS alignment images were checked; this object turns out to be a close pair of separation 0.8 arcsec with a brightness difference of 2 mag. It was not possible to separate the contributions of each to the spectra, so data for this object is included in the tables, but it is not shown in any of the figures.
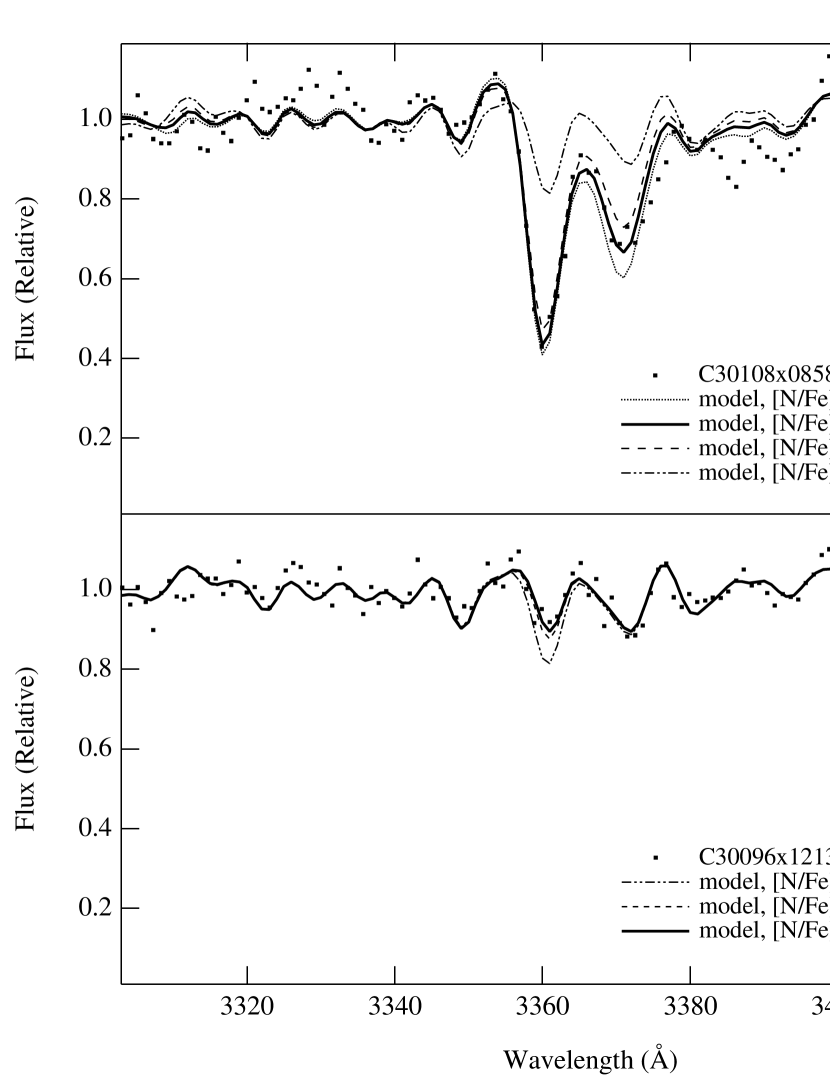
Figure 3 shows the region of the 3360 Å band of NH in the spectra of two of the stars in the primary sample in M15. These stars have essentially the same stellar parameters ( K and log() 2.8 dex) lying at about the same place in the cluster CMD, yet their NH bands differ strongly. From this figure alone, we can anticipate one of the key results of our work, the large scatter in C and N abundance we will find among M15 members at the base of the red giant branch (RGB) at mag.
4 Measurement of CH and CN Indices
For each spectrum, indices sensitive to absorption by the 4300 Å CH band were measured as described in Briley & Cohen (2001). While for the NH band we could have used the double-sided index described in Briley & Smith (1993) and used by us for our small sample of spectra of M13 subgiants described in Briley, Cohen & Stetson (2004b), we were concerned with the decline of the apparent continuum level towards bluer wavelengths in the UV for these LRIS-B/Keck spectra. This is presumably due to the wavelength dependence of both the stellar flux and the instrumental efficiency. It is extremely difficult to flux spectra taken through slitmasks because of the varying slit losses and the possibility of atmospheric dispersion affecting the spectra, although the latter was, as discussed earlier, not a concern here. Carrying out the observations with the length of the slit set to the parallactic angle, which is the usual method for eliminating atmospheric dispersion for single slit observations, cannot be used for multislit observations as the position angle is fixed by the design of the slitmask. It is for these reasons that no attempt was made to flux the spectra.
Since the stars are so metal poor, there are relatively few detected features in the region between 3300 and 3430 Å besides the desired NH band. Thus we decided to normalize the stellar continuum in the spectrum of each star, then find the absorption within the NH feature bandpass. The continuum fitting approach adopted here allows for a direct comparison between indices measured from the spectra and those computed from theoretical spectral synthesis without the need for any slope corrections. The feature bandpass for NH adopted here was 3354 to 3375 Å (in the rest frame of M15). This was done by fitting a second order polynomial to the bandpass 3300 to 3430 Å, masking out the region of the NH band. The polynomial fitting used a 6 high and 3 low clipping, running over a 5 pixel average. There was little change in the measured NH indices as compared to simply applying the two-sided continuum and feature bandpasses. This reflects our educated guess for choice of the continuum bandpasses, which are more or less symmetrically distributed about the center of the feature bandpass.
The measured indices are listed in Table 3 and plotted in Fig. 4. The upper axis of these figures is , and the RGB bump in M15 occurs at mag (Zoccali et al., 1999). Approaching the MSTO, suddenly increases, and the molecular bands we study here become much weaker; they are effectively undetectable in the present spectra. This produces the sharp drop in measured indices apparent at in Fig. 4. It is not until 2.5 mag below the MSTO that as cool as 5600 K is again reached, at which point molecular bands can again be expected to be detectable in M15 main sequence stars with similar quality spectra to those presented here for its subgiants.
The error bars given in Table 3 (drawn in Fig. 4 at 2) have been calculated strictly from Poisson statistics based on the signal present in the feature and continuum bandpasses. The CH index, in particular, is very robust; independent measurements by each of the first two authors using both a double-sided index and continuum fitting as described above always agreed to within 2% for each star in the sample in M15. Every star in the sample has a measurement of I(CH). I(CH) is positive for all the stars in the sample, and exceeds 1% for all stars except C29424_0729 on the extended BHB and one star near the main sequence turnoff at mag. We do not expect to see any CH for the extreme BHB star nor for the stars just at the turnoff. The measured I(CH) values for them range from 0 to 4%, with most having I(CH) 2%. These include the faintest stars in the sample, and their I(CH) measurements appear valid, again suggesting that the measurements of the CH indices at all luminosities considered here are robust. As can be seen in Figure 4, substantial star-to-star differences occur among the I(CH) indices for the stars in our M15 sample, even if one considers only stars in similar evolutionary states.
Obtaining high quality spectra in the region of the NH band at 3360 Å for such faint stars is not easy. There are five stars with poor quality spectra in the NH region for which no measurement of the NH index was attempted. These arose as a result of low signal level, the location of the spectra with respect to the edges of the slit (a problem more common among the secondary stars), or a bright reflection falling on or very near the NH feature. There are 10 additional stars with low signal level, but measured I(NH), which are marked by open circles instead of filled circles in the figures; only one of these is brighter than . Among the stars brighter than with measured , there are five with negative . Of these, three have I(NH) % while the smallest is %. Fig. 4 demonstrates that a very substantial range exists in I(NH) among stars of similar evolutionary state for mag.
In examining Fig. 4, aside from the extreme BHB star, there are no obvious anomalous stars in our sample in M15. Furthermore, there is no obvious bimodality among either the CH or NH indices. Over a small range in , there appears to be an anti-correlation of the strength of the CH and NH bands. The correlation is not perfect, but given the weakness of the molecular features in these low luminosity stars in M15, is reasonably convincing. We return to this issue in §6 once C and N abundances are derived for the stars in our M15 sample.
The large range in C abundances which we suspect to be present in the M15 subgiant sample creates an unusual situation with regard to the expected strength of the CN features. Normally, since there is more carbon than nitrogen, the N abundance controls the amount of CN. However, if C is highly depleted, there can be fewer carbon atoms per unit volume than nitrogen atoms, and C will control the formation of CN, as suggested by Langer (1985). Since we are using the NH band to deduce N abundances, this is not an issue here.
5 Comparisons with Synthetic Spectra
Clearly the pattern of abundances underlying the CH and CN band indices of Fig. 4 cannot be interpreted on the basis of band strengths alone - we must turn to models. The technique employed is similar to that of Briley & Cohen (2001), where the region of the CMD of interest is fit by a series of models whose parameters are taken from (in the present case) a Y2 (Demarque et al., 2004) 12 Gyr isochrone with Z = 0.000400, Y = 0.230800, and [/Fe] = 0.6. The set of representative model points are listed in Table 2a. Model stellar atmospheres were then generated using the Marcs model atmosphere program (Gustafsson, Bell, Eriksson, & Nordlund, 1975) at the , log() of these points. Logarithmic solar abundances of Fe, C, N, and O are assumed to be 7.52, 8.62, 8.00, and 8.86 dex, respectively, on a scale of H = 12. These are somewhat higher than the latest solar abundances inferred from 3D hydrodynamic models by Asplund, Grevesse & Sauval (2005), but we continue to use them for consistency with our previously published papers in this series. Furthermore, our molecular transition probabilities were scaled to fit the solar spectrum with our adopted solar abundances when they were first adopted (e.g., Bell, Paltoglou, & Tripicco (1994)). From each model, synthetic spectra were calculated using the SSG program (Bell & Gustafsson 1978; Gustafsson & Bell 1979; Bell & Gustafsson 1989; Bell, Paltoglou, & Tripicco 1994) and the line list of Tripicco & Bell (1995). The spectra were calculated from 3,200 to 5,500 Å in 0.05 Å steps with a microturbulent velocity of 2 km/s, an [O/Fe] abundance of +0.20 dex, C12/C13= 10, but with differing C and N abundances. The resulting spectra were then smoothed to the resolution of the observed spectra and the corresponding I(CH) and I(NH) indices measured. By construction, no zero point shifts were necessary.
The values of I(CH) from 18 sets of models with [C/Fe] from to +0.4 dex in steps of 0.2 dex are plotted with the observed indices in Figure 5. I(NH) was computed from the same set of models for [N/Fe] from to +2.0 dex in steps of 0.2 dex. The corresponding I(NH) values are also shown in this figure. The spread in [C/Fe] and [N/Fe] among the M15 SGB stars appears well represented by this range. Clearly the star-to-star spread in N abundances of the stars at the base of the RGB in M15 approaches a factor of 10.
6 Inferred C and N Abundances Among the Subgiants
To disentangle the underlying C and N abundances from the CH and NH band strengths, we have fit the [C/Fe] and [N/Fe] abundances corresponding to the observed I(CH) and I(NH) indices of the SGB stars in M15. Since we are using the NH band instead of a CN band, the coupling between the assumed abundance of C and the deduced abundance of N is minimal and we employ here the same technique of Briley et al. 2002, 2004b (our M13 analysis): the model isoabundance curves of Table 3 were interpolated to the of each program star using cubic splines, and the observed index converted into the corresponding abundance based on the synthetic indices at that . The resulting C and N abundances are plotted in Figure 6 and listed in Table 3.
The error bars were determined by repeating the process while including shifts in the observed indices of twice the average error among the SGB indices as derived from Poisson statistics (0.005 in I(CH) and 0.02 in I(NH)). The shifts were included in opposing directions (e.g., +0.005 in I(CH) and –0.02 in I(NH), followed by –0.005 in I(CH) and +0.02 in I(NH)) and reflect likely errors in the abundances due to noise in the spectra.
Plotted in Figure 3 we show synthetic spectra corresponding to two SGB stars (one NH strong, the other NH weak) and a variety of N abundances. Also shown are the abundances resulting from index matching, which agree well with what one would obtain from visual matching between observed and calculated spectra.
The sensitivity of the derived C and N abundances to our assumptions was also evaluated. We chose four representative stars near the base of the RGB and again repeated the fitting of the CN and CH band strengths with different values of [Fe/H], [O/Fe], C12/C13, etc. These results are presented in Table 4, where it may be seen that the sensitivity of the derived C and N abundances to the choice of model parameters is remarkably small (well under 0.2 dex for reasonably chosen values), as would be expected from these weak molecular features. We have also plotted the C and N abundances of our M15 sample as both functions of (Fig 6) and colors (not shown) to evaluate possible systematic effects with luminosity and temperature; none appear to be present.
C and N abundances were not calculated for the stars at or below the MSTO, as all abundance sensitivity is lost due to the high and resulting weakness of the molecular bands. For the six stars in our sample with I(NH) %, essentially all of which have I(NH)+1, we assign upper limits to [N/Fe], which are shown in Fig. 6. This figure immediately confirms the very large range in C and N abundances from star to star at similar evolutionary stages in M15 previously deduced from the appearance of the I(CH) and I(NH) - V mag plots (Fig. 4).
We next consider whether our data show any correlation between the C and N abundances we derive for M15 subgiants and lower RGB stars. Fig. 7 shows a plot of [N/Fe] versus [C/Fe] for the entire M15 sample. An anti-correlation, with considerable scatter, is apparent. The scatter is consistent with the observational errors, but there are a few outliers. In a sample of 70 objects with Gaussian errors, one outlier at the 2.5 level might be expected. One of these, C30123_1138 (V=18.27) is among the stars with low signal in the continuum near the NH band, hence I(NH) with a high uncertainty, indicated in the figures by an open circle. The deviation of star C29413_1023 (V=17.32), with extremely enhanced C and N, from the mean relation shown by the M15 sample in Fig. 7 is of higher statistical significance. This star will be discussed in Cohen & Melendez (2005), where additional relevant data will be presented. We thus conclude, with the caveat of a very small number of probable outliers, that an anti-correlation between C and N is indeed found among the low luminosity sample of 68 stars in M15 studied here.
Evaluating the accuracy of our absolute abundance scale is more difficult as external comparisons are limited. For the main sequence stars in 47 Tuc, we can compare the results of Briley et al. (1991, 1994), carried out in a manner fairly similar to the present work, with the independent analysis of a different sample of stars by Cannon et al. (1998). This suggests we may be systematically underestimating the absolute C abundance by about 0.15 dex, and overestimating the N abundance by about 0.2 dex. A second comparison is possible in M13. We obtained C abundances using our procedures as described here from newly obtained spectra for previously studied bright giants in M13 precisely to address this issue. The mean differences in [C/Fe] for our results as compared with literature values was 0.03 dex for four stars in common with Smith et al. (1996) and 0.14 dex for stars also observed by Suntzeff (1981) (if one extreme case is removed) (see Briley et al. 2002 for details). This is very reasonable agreement. It is clear that shifts in the absolute abundance scale cannot account for the large range in C and N abundances apparent in Figure 7. We therefore conclude that the C versus N anti-correlation among the low luminosity M15 stars in Figure 7 is indeed real.
6.1 From the RGB Tip to the Main Sequence Turnoff
Trefzger et al. (1983) carried out an extensive analysis of C and N abundances for the most luminous stars in M15. We now combine our results with theirs, thus sampling the [C/Fe] and [N/Fe] ratio over the full range of luminosity from the RGB tip to the main sequence turnoff in M15 in the two panels of Fig. 8.
With the confidence that our absolute abundance scale is reasonably secure and the hope that the same holds for the work of Trefzger et al. (1983), we assert that Fig. 8 shows a large range in [C/Fe] at low luminosities, accompanied by a decrease in the mean [C/Fe] at about 15 mag, which is essentially the location of the RGB bump in this globular cluster. We take this as evidence of two separate mechanisms contributing to the spread in the abundance of C and N in globular clusters. At high luminosities near the RGB tip, we see evidence of the first dredge up, as expected from normal stellar evolution, plus the extra-mixing common among metal-poor cluster giants, with a decline in the mean C abundance of about a factor of 5 (0.8 dex); the large uncertainty reflects the possibility that the absolute abundance scale of Trefzger et al. (1983) is different from ours, a matter we plan to investigate in the near future. In metal-poor field giants (Gratton et al., 2000; Spite et al., 2004) a similar drop of about a factor of 2.5 is seen in the C abundance at about the luminosity of the RGB bump.
These studies of field giants show an increase in N abundance of about a factor of 4 at (RGB bump), a drop in the Li abundance, and a decrease in the 12C/13C ratio as well. There is some suggestion of an increase in the mean N abundance for stars in M15 more luminous than (RGB bump) (Fig. 8), but it is less clear cut than the drop in mean [C/Fe] there. There is also a potential concern of bias, in that Trefzger et al. (1983) could not reliably detect NH bands weaker than those included here; their paper contains several non-detections which were not plotted in Fig. 8.
This is the same phenomenon we identified earlier in M13 (Briley, Cohen & Stetson, 2002, 2004b), where the mean C/Fe and spread about that value were constant from the subgiants to below the main sequence turn off, but stars near the RGB tip showed lower surface C abundance. In that case, due to the limited data from the literature for the luminous RGB stars, we could not identify the luminosity at which the transition occurred. In M15, as is shown in Fig. 8, that transition luminosity is reasonably well defined, and it is (RGB bump)
7 ON Burning
We next examine whether converting C to N, presumably via the CN cycle, is sufficient to reproduce the behavior we have found for our M15 sample, or whether burning of the even more abundant element O is also required. Figure 9 shows the sum of the C and N abundance as a function of the C abundance of the sample of M15 subgiants. The solid dot shows the predicted location assuming the initial C and N abundances (C0, N0) are the Solar values reduced by the metallicity of M15 ([Fe/H] = dex). Thus this is the initial location for no burning and for a Solar C/N ratio. If the present stars incorporated material in which just C was burned into N, then the locus of the observed points representing the M15 sample of low luminosity stars should consist of a single horizontal line, with the initial point, the presence of no CN-cycle exposed material, at the right end of the line (the maximum C abundance) and the left end of the line corresponding to a substantial fraction of the star’s mass (i.e. the atmosphere plus surface convection zone) including C-poor, N-rich material. Furthermore, if the initial C/N ratio of the cluster is not Solar, then the locus should still be a horizontal line, but located at a different vertical height in this figure.
The maximum possible N enhancement for a cluster SGB star with these assumptions occurs if the star formed entirely from material in which all C has been converted into N. For initial values (C0, N0) (not expressed as logarithms), this maximum N enhancement would be (C0 + N0)/N0. If the initial value was the Solar ratio, C0/N, the resulting maximum N enhancement is a factor of 4.2, while for an unrealistic initial C0/N0 of 10, the maximum N enhancement is a factor of 11.
Now we examine the behavior of the C and N abundances among the M15 subgiant sample as inferred from our observations. It is clear that the assumption that the only thing happening is inclusion of material in which C was burned into N must be incorrect. The sum of C+N seems to systematically increase by a factor of 5 between the most C rich star and most C deficient star. The discussion of the errors, both internal and systematic, in §6 suggests maximum systematic errors of dex for log(C/H) and +0.2 for log(N/H). This is completely insufficient to explain such a large trend as errors.
Thus the sum of C+N was not constant as C was burned into N, wherever that might have occurred. Furthermore the observed range in N abundances is very large. The most obvious way to reproduce this is to include O burning as well as C burning. If we adopt Solar ratios as our initial values, then a substantial amount of O burning is required.
Figure 9 suggests that the initial ratio of C/N is close to Solar. Adopting the Solar value as the initial C/N ratio, we calculate the minimum amount of O which must be burned at the base of the AGB envelopes to reproduce the locus observed in the figure (under the arguable assumption of the most extreme of our stars having formed largely from such material - this will, however, provide us with at least an estimate of the minimum burning required). We need to produce a N enhancement of at least a factor of 10. The Solar ratio is C/N/O = 3.2/1/7.6, so if all the C and 50% of the O were converted, we have an enhancement of N of a factor of 8 available to the present stars. Oxygen is typically found to be overabundant with respect to Fe in old metal-poor systems (see Meléndez, Barbuy & Spite 2001, Gratton et al. 2001, Ramírez & Cohen 2002, and references therein); we assume [O/Fe] dex, a typical value. Then the initial C/N/O ratios will be 3.2/1/15.2. Note that the same amount of O has to be burned to produce the observed distribution of C and N abundances, but in this case it is a considerably smaller fraction of the initial O.
8 Comparison With C and N Studies in Other Globular Clusters
We have now analyzed four galactic globular clusters covering a wide range in metallicity, M71, M5, M13 (see GC–CN), and the present study of M15. In each case, large samples of stars, all well below the luminosity of the RGB bump, were used. In M13 and M71, we had large samples below the main sequence turn off. In this section we attempt to assemble, compare, and integrate the results of these efforts, adding in relevant other work from the literature. The following section will seek to interpret these results.
The nearby globular cluster 47 Tuc has been studied in great detail by Cannon et al. (1998) (see this paper for references to many earlier studies), while Briley et al. (2004a) extend their results by pushing several magnitudes below the MSTO of this very nearby cluster. 47 Tuc and the four clusters we have studied (see GC–CN) are the only globular clusters for which suitable data exists for the low luminosity range probed here.
In each of these five globular clusters, there are large differences in star-to-star C and N abundances among the low luminosity stars. Fig. 10 and Fig. 11 show histograms for the samples of stars in each of these five globular clusters of the derived C and N abundances. From these we estimate the range of variation among these stars for both C and N for each cluster, ignoring a few obvious outliers in some cases. The field star C and N values for unmixed stars (low luminosity metal-poor field giants, presumably these are unmixed stars) from Gratton et al. (2000) ([C/Fe] , [N/Fe] dex) roughly coincide with the maximum C/Fe ratio and with the minimum N/Fe ratio.
Our most important new result derives from Fig. 10 and Fig. 11. This figure clearly shows that the range of the spread in both C and N is about the same when expressed as [C/Fe] and [N/Fe] values in each of the five clusters.
An anti-correlation between C and N has been found in each of these clusters. This anti-correlation is most easily seen in the metal rich clusters as there the observational errors are a smaller fraction of the signal. However, it is seen even in M15. This anti-correlation takes a particular form, illustrated in Fig. 9, where the [C/Fe] – [N/Fe] relationship we earlier demonstrated to prevail in M5 (the dashed curve) is superposed on the results presented here for M15. The length of the curve covers the full range of our M5 stellar data. The agreement of the mean relations we have determined in M5 and in M15, both their form and their extent, is very good.
In the metal-rich GCs M71 and 47 Tuc, the CN and the CH indices appears bimodal, with a preferred high and low value, each varying with luminosity, but few stars occupying the middle ground. However, the more metal poor GCs, M5, M13 and M15 show no sign of bimodality for either the CH or the CN (or NH) line strengths. While an upper limit to band strengths in the metal-rich clusters might arise as the bands saturate, the general appearance of the distribution of line indices (see, for example, Fig. 4 of Cannon et al. 1998) does not support this as an important mechanism here. The bimodality more likely reflect the underlying abundance distributions of C and of N.
By adding in samples of much more luminous stars on the upper giant branch with C and N abundances from the literature, we have been able to show that for M13 and for M15, the most luminous stars have a mean C/Fe ratio about a factor of 3 to 5 lower than than those on the lower giant branch. A similar behavior is present in the large sample of luminous stars in M92 studied by Carbon et al. (1982), where C and N abundances were assigned to 43 giants with , by Langer et al. (1986), and in the more recent work on C along the lower RGB of M92 by Bellman et al. (2001). The latter suggest that C depletion begins at to 1.0 mag, while Zoccali et al. (1999) find the RGB bump to be at mag in M15 based on HST CMDs. Previous studies of the C and N abundances of stars in M5, summarized in Cohen, Briley & Stetson (2004), combined with our low luminosity large sample in this globular cluster, suggest that any difference in the mean [C/H] between the tip and the base of the RGB in M5 must be less than 0.3 dex; further observations to refine this are underway. For M71, we can compare our main sequence C abundances with those for the 75 RGB giants found by Briley, Smith & Claver (2001) from DDO photometry. There is no evidence for any additional C depletion near the RGB tip in M71, but the uncertainties are large. The situation in 47 Tuc is comical. This globular cluster is so nearby, hence its stars are relatively bright, that large surveys of the luminous giants (see, e.g. Norris, Freeman & Da Costa 1984) were carried out before the development of molecular band synthesis techniques, and hence they compared CH and CN molecular band indices as a function of luminosity, but did not derive C and N abundances. We have been unable to put together a sample from the literature of stars in 47 Tuc with C abundances that encompasses the necessary luminosity range in spite of the multitude of published analyses.
This drop in C/Fe near the RGB tip is in agreement with the behavior of field stars (Gratton et al., 2000). Thus, as was suggested in Briley, Cohen & Stetson (2002), there appear to be two distinct abundance altering mechanisms that affect globular cluster stars. One produces strong star-to-star scatter at all luminosities, and another, most effective in the metal-poor GCs, produces the drop in C abundance which starts at (RGB bump). Only the latter is seen among field stars, and only the latter is at present understood, by enhanced (“deep”) mixing at the first dredge up once stars evolve to luminosities exceeding (RGB bump).
9 Implications for Stellar Evolution
In the previous section, we reviewed the observational results accumulated thus far regarding the C and N abundances of stars in galactic globular clusters. We note that the sample of well studied GCs covers a wide range in metallicity, and, especially at the metal rich end, a wide range of present cluster mass and central stellar density. In this section we discuss the implications of the collected observational results for stellar evolution of metal-poor globular cluster stars. We found that there appear to be two distinct mixing mechanisms. First we address the extra C-depletion found on the upper RGB beginning approximately at (RGB bump). This mechanism is, to first order at least, understood.
A classical review of post-main sequence stellar evolution can be found in Iben & Renzini (1983). Their description of the consequences of the first dredge up phase, the only dredge up phase to occur prior to the He flash, indicates that a doubling of the surface 14N and a 30% reduction in the surface 12C can be expected, together with a drop in the ratio of 12C/13C from the solar value of 89 to 20, as well as a drop in surface Li and B by several orders of magnitude. Observations of metal-poor field stars over a wide range of luminosities conform fairly well to this picture, see e.g. Shetrone et al. (1993), Gratton et al. (2000), although additional mixing of Li and lower than predicted ratios of 12C/13C seem to occur even among field stars (Do Nascimento et al., 2000).
Additional physics was introduced into calculations of dredge up in old metal poor stars to better reproduce the observations via “deep mixing”. Specific improvements include meridional mixing as described by Sweigart & Mengel (1979) as well as turbulent diffusion (see Charbonnel 1994, 1995) and the insights of Denissenkov & Denissenkova (1990) concerning the importance of the 22Ne(Na reaction as a way to produce p-burning nuclei. The clear prediction of the most recent calculations of this type by Denissenkov & Weiss (1996), Cavallo, Sweigart & Bell (1998) and Weiss, Denissenkov & Charbonnel (2000) is that the earliest that deep mixing can begin is at the location of the bump in the luminosity function of the RGB which occurs when the H-burning shell crosses a sharp molecular weight discontinuity.
The observations of C and N abundances in globular cluster stars (and in field stars, see, e.g. Gratton et al. 2000) are in reasonable agreement with the predictions of the latest such models with regard to the key points: at what luminosity the first dredge up begins, the amplitude of the decline in C abundance, and the general shape of the C depletion as a function of luminosity. The observational situation is not yet adequate to verify the predicted increase of the N abundance in GC RGB stars above the bump luminosity. The models also predict, in agreement with the observations, that this phenomenon is more efficient at low metallicities, as the thickness of the H-burning shell decreases rapidly and the shell burning timescale also decreases as the metallicity rises (see Fig. 7 and 6b of Cavallo et al., 1998). The models of Cavallo et al. (1998) and others can predict the strong O-Na correlation seen among giants close to the RGB tip in some globular clusters, particularly the metal poor ones, as another consequence of p-burning in the H-burning shell.
We therefore regard this aspect of the behavior of the C and N abundances in globular cluster stars as having a reasonable explanation. It is the very large star-to-star differences in C and N abundances found at all luminosities in all globular clusters studied with sufficient data to date which are not easily explained. The range of variation of [C/Fe] and of [N/Fe] is to first order constant, irrespective of the metallicity of the GC and independent of stellar luminosity, with C and N anti-correlated, and with maximum C depletions of a factor of 3 to 5 accompanying maximum N enhancement of more than a factor of 10. The very high N enhancements require not only CN burning but ON burning as well. The range of luminosity over which these C and N variations (and also O and Na variations as well, see, e.g. Cohen & Melendez 2005 or Gratton et al. (2001) and references therein) occur in globular clusters has by now ruled out any scenario which invokes dredge up and mixing intrinsic to the star itself. We must now regard the fundamental origin of the star-to-star variations in C and N abundance we see in GCs as arising outside the stars whose spectra we have studied here.
The strong anti-correlation between C and N, however, does suggest that CN-cycle material must be involved, and that this material has somehow reached the surface of these low luminosity GC stars. Since we know it cannot come from inside these stars, it must come from some external source. As reviewed by Lattanzio, Charbonnel & Forestini (1999), CN and ON cycling is known to occur in intermediate mass AGB stars, and such stars are also known to have sufficient dredge up to bring such material to their surfaces. Recent detailed computations, including both nucleosynthesis with a large set of isotopes and nuclear reaction pathways, have been carried out by Karakas (2003) for very metal poor intermediate mass stars. Herwig (2004) has also added in detailed mixing to the stellar surface. These calculations can qualitatively reproduce essentially all of the observational data.
We thus might speculate that the site of the proton exposure could be more rapidly evolving higher mass AGB stars, which then suffered extensive mass loss (either in or outside of binary systems) and polluted the generation of lower-mass stars we currently observe, while the higher mass stars are now defunct. Considerable effort to develop this scenario of AGB pollution of the lower mass stars we observe today has been made by Ventura, D’Antona, Mazzitelli, & Gratton (2001), D’Antona et al. (2002), and most recently (and most completely) by Fenner et al. (2004).
However, the recent observational facts summarized above have in our view rendered this scenario not viable either. One problem with any “pollution” scenario is that these abundance inhomogeneities cannot simply be surface contaminations as they would be diluted by the increasing depth of the convective envelope during RGB ascent. Thus the amount of accreted mass required to explain the observed C and N variations becomes very large. It must be significant fraction of the total stellar mass, given that a fraction of the star much larger than just the surface convection zone of a luminous RGB star must be contaminated to maintain a constant range of C and of N at all luminosities. This seems to us unrealistic and contrived, but we note the recent calculations of Thoul et al. (2002) which demonstrate that large accumulations may be possible with some assumptions about stellar orbits, particularly in clusters with small core radii. They estimate that for stars in the core of 47 Tuc as much as 80% of the mass of a 1 M⊙ star in that cluster could be accreted material. Unfortunately, the core radii of some of the GCs we have studied are considerably larger. Even with generous assumptions regarding orbital anisotropy, similar calculations for them yield a much smaller expected accretion (10%), which is not sufficient for present purposes.
Another problem arises because of the tight anti-correlation between C and N (see Fig. 9). Any external mechanism for producing these variations will involve an efficiency factor for the incorporation of material. This might be a cross section if accretion from the cluster gas is involved, or some property of the accretion disk if binaries are involved. We expect this factor to depend on the mass of the star itself, how much additional mass is incorporated (), and the initial C and N abundances in the star itself and within . Since these properties of might be expected to fluctuate wildly depending on the mass of the evolved star producing the N rich ejecta, this process therefore should show a lot of stochastic random variability. “Pollution” of a low mass star by ejecta from intermediate mass AGB stars is just too chaotic and unpredictable to be able to reproduce such well behaved trends.
We now turn to the implications of Fig. 10 and 11, which display the ranges of [C/Fe] and [N/Fe] found among low luminosity stars (stars at the base of the RGB, subgiants, and/or on the main sequence) in five GCs spanning a range in metallicity of a factor of 40. This figure illustrates our most important new result. We see that the maximum and minimum for each of these is approximately the same (to within a factor of 3) for each of the clusters. Note that the maxima and minima expressed as log[(C)] and log[(N)] are not constant. Furthermore the maximum in [C/Fe] corresponds reasonably well to that of the field stars, while the minimum in [N/Fe] corresponds to that of the field stars.
Thus it seems reasonable that, as is commonly assumed, the high C, low N stars represent the nominal chemical inventory, while the abnormal ones are those with low C and high N. 12C is produced by the triple- process and destroyed by CN burning, while 14N is produced via CN and “hot bottom” burning. We therefore expect N to behave as a primary element, while the behavior of C may be more complex. The observations, however, demand that the additional material dumped onto the low C/high N stars is not from some primary process in which a fixed amount of N per gm is produced, dispersed into the GC, and mixed into the GC gas. Instead the chemical inventory of C and N behaves like a secondary process, increasing as [Fe/H] increases.
The modeling of the production and dredge up of elements such as C and N in AGB stars, while still very uncertain, is rapidly advancing. Detailed models, such as those of Karakas (2003) of yields and of abundances for various species at the surfaces of such stars after dredge up are now available. So we must ask what are the surface ratios of the species of interest in intermediate mass AGB stars after dredge up and what are the relevant mass loss rates, which will drive the processed material into the cluster gas. Mass loss in AGB stars is primarily driven by radiation pressure on dust grains (Vasiliadis & Wood, 1998). While there is still some uncertainty, recent comparisons of heavily obscured AGB stars in the SMC, the LMC and the Milky Way by van Loon (2000) suggest that the total mass loss rate for a star of fixed luminosity is only weakly dependent on metallicity.
Chemical yields for intermediate mass stars have been given by Marigo (2001), Ventura, D’Antona & Mazzitelli (2002) and Karakas (2003). We examine the ratio of initial to final C and N in models of different initial metallicity to determine how closely the behavior of 12C and of 14N in the ejecta of such stars matches the extreme range of the observations in globular clusters over a wide range in metallicity. Table 5 presents this comparison in detail for the models of Ventura, D’Antona & Mazzitelli (2002); those of Karakas (2003) and of Gavilan, Buell & Molla (2004) do not cover a sufficient range in metallicity to be useful for our purpose, while the results of Marigo (2001) were not given in tabular form.
We find that, while correct in sign, the models of Ventura, D’Antona & Mazzitelli (2002) fail to reproduce the observations by factors of up 10, depending on which of the three ratios presented in the table is examined. The worst discrepancy is in the final ratio C/N after dredge up in the most metal poor GCs. There the extent of both the depletion of C and the enhancement of N are badly underestimated by the models. Fenner et al. (2004) also finds that ejecta from intermediate mass AGB stars cannot reproduce details of the abundance distributions of the Mg isotope ratios in NGC 6752 (see also Denissenkov & Herwig, 2003). AGB ejecta can be observed directly by studying them in situ, i.e. in planetary nebulae. An independent verification comparison for the predicted yields can be attempted via abundance analyses of the planetary nebulae in the SMC. Stranghellini, Shaw & Gilmore (2004) discuss the planetary nebulae in the LMC, whose metallicity is higher than that of any GC considered here. The SMC PN are not as well studied, and with the demise of STIS/HST, future progress in this area will be at best very slow.
Although the predictions of Ventura, D’Antona & Mazzitelli (2002) and of Karakas (2003) for the behavior of C and N after dredge up of intermediate mass AGB stars are reasonably consistent with each other, the uncertainty in these calculations must be large. Whether it is large enough to accommodate discrepancies of a factor of 10 in C/N ratios is not clear. An optimist would say that this level of (dis)-agreement is satisfactory, given the difficulties and complexity of the modeling effort required, while a pessimist would say that these discrepancies are larger than can be reasonably expected from the models and from the data. A very recent paper, Ventura & D’Antona (2005), discusses the modeling uncertainties arising from just one issue, the description of convection adopted. They find changes of a factor of two in predicted C and N surface abundances in intermediate mass metal poor AGB stars are easily achieved by this means. We choose to be optimists. More such modeling efforts, even though they require many assumptions, will be very valuable.
10 Implications for Globular Cluster Formation and Chemical Evolution
In addition to the accumulated evidence regarding C and N abundances presented above, there is one other key fact that must figure in any model of the chemical evolution of globular clusters. This is that the abundances of the heavy elements, particularly those between Ca and the Fe-peak, are constant for all stars in a globular cluster. Extensive efforts (see, for example, Cohen & Melendez 2005) have failed to detect any dispersion larger than the observational errors. The abundance spreads are confined to the light elements111There is increasing evidence there may be some variation of the heavy and very rare and -process elements in globular clusters. We ignore this here..
We suggest that a viable scenario for the chemical evolution of GCs can only be constructed if globular cluster stars are not all coeval, and more than one epoch of star formation in GCs must have occurred, albeit all within a relatively short timescale. During the early stages, a variation in C and N abundances satisfying the above observational data was imprinted on the proto-cluster gas before the present generation of stars we now observe were formed. The low mass stars we currently observe formed from the “polluted” gas some time later during the extended period of star formation in GCs. Furthermore, if one is a pessimist, one must rule out some previous generation intermediate mass AGB stars as the the source of this “pollution” because of problems in the predicted C/N ratios. If one is an optimist, then one ascribes these problems to modeling difficulties, mass loss rates increase dramatically with increasing metallicity, which is not supported by observations (van Loon, 2000), or some other such factor, and assumes that these AGB stars did generate the C and N variations seen today in low luminosity GC stars.
A tentative scenario which fits most of the facts might be that the first stars to form in the proto-cluster gas were very massive. Since this gas might have had very low metallicity, theoretical support for an IMF heavily biased towards high mass stars under these conditions can be found in the review of Bromm & Larson (2004). The SNII from these stars produced the heavy elements through the Fe-peak seen in globular cluster stars. The violent explosions ejected energy into the cluster gas which kept it well mixed. This is crucial to maintaining constant abundances of the heavy elements in the stars within a particular GC. SNII explosions may also have acted to disrupt the lowest mass proto-clusters, which became halo field stars.
The lifetimes of high mass stars are very short, and so would be the duration of this phase of evolution of the GC. After some (short) time, no more massive stars were formed. Intermediate mass stars began to form with metallicity that of the GC as seen today. Such stars have typical lifetimes of 2 Gyr. During the course of their evolution, in their interiors they produced material that went through the CN process (and the ON process to some extent). This material was subsequently ejected, but the gas was no longer mixed globally over the cluster volume, and local pockets of substantial or negligible enrichment of the light elements developed. Since GC CMD diagrams do not permit an age range of 2 Gyr among the low mass GC stars, no low mass stars could have formed until the near the end of this second phase. At this point, the low mass stars that we see today formed, with variable light element ratios, but fixed heavy element abundances.
It is now possible to include the formation of globular clusters in cosmological simulation (Kratsov & Gendin, 2004). However, the level of detail needed here to follow their chemical evolution with regard to the light elements is still beyond our capabilities. Although the overall picture sketched above seems reasonable, current models for nucleosynthesis and dredge up for intermediate mass AGB stars fail to reproduce in detail the observed C and N variations in GC stars, in the sense that the C depletions and N enhancements observed in low metallicity globular clusters are considerably larger than theory predicts. Unless those models are flawed, the relatively short lived stellar source for the second phase of this scenario, when the cluster gas is no longer well mixed throughout its volume, is unknown.
In evaluating such a scenario, it is important to remember that the present mass of a GC may be much lower than its initial mass as a proto-cluster; stars are lost from the cluster through many processes (see, e.g. Mashchencko & Sills, 2004). Thus the absence of a relation between the present mass (or central density) of a GC and its [Fe/H] should not be surprising. It would be of interest to test to even greater accuracy the constancy of the Fe-peak elements within a particular GC.
11 Summary
We present moderate resolution spectroscopy and photometry for a large sample of subgiants and stars at the base of the RGB in the extremely metal poor Galactic globular cluster M15 (NGC 7078), with the goal of deriving C abundances (from the G band of CH) and N abundances (from the NH band at 3360 Å). Star-to-star stochastic variations with significant range in both [C/Fe] and especially [N/Fe] are found at all luminosities extending to the subgiants at .
An analysis of these LRIS/Keck spectra with theoretical synthetic spectra reveals that these star-to-star variations between C and N abundances are anti-correlated, as would be expected from the presence of proton-capture exposed material in our sample stars. The evolutionary states of these stars are such that the currently proposed mechanisms for in situ modifications of C, N, O, etc. have yet to take place. On this basis, we infer that the source of proton exposure lies not within the present stars, but more likely in a population of more massive stars which have “polluted” our sample.
The range of variation of the N abundances is very large and the sum of C+N increases as C decreases. To reproduce this requires the incorporation not only of CN but also of ON-processed material, as we also found earlier for M5 (see GC–CN).
We combine our work with that of Trefzger et al. (1983) for the brighter giants in M15 to extend coverage to a larger luminosity range reaching from the RGB tip to the main sequence turnoff. We then find strong evidence for additional depletion of C among the most luminous giants. This presumably represents the first dredge up (with enhanced deep mixing) expected for such luminous RGB stars in the course of normal stellar evolution as they cross the RGB bump.
Our work now covers four GCs (M15, M13, M5 and M71, see GC–CN) spanning a metallicity range of a factor of 40. We look at the trends of C and N abundances common to all the GCs studied to date, including (from the literature) 47 Tuc. While all clusters studied show strong anti-correlated variations of C and N at all luminosities probed, the metal rich clusters (M71, 47 Tuc and M5) do not show evidence for the first dredge up among their most luminous giants, while the metal poor ones (M5, M13, M92 and M15) do. This is predicted by the models of the first dredge up on the RGB, which can reproduce essentially all the key features of the associated changes in C abundance, including the luminosity at which it begins and the amplitude of the decline in [C/Fe] as a function of metallicity. The metal poor clusters do not show evidence for the bimodality in CH and CN line strengths seen in the metal rich clusters. The origin of the bimodality is unclear.
It is the star-to-star variations in C and in N seen at low luminosity in all these GCs that is more difficult to explain. Having eliminated in situ CN processing, “pollution” by material from intermediate mass AGB stars is the most popular current scenario to produce this. However, we rule out this suggestion, at least as far as accretion onto existing stars is concerned.
Our most important new result is that the range of [C/Fe] and of [N/Fe] seen in these five GCs is approximately constant (see Fig. 10 and 11), i.e. C and N are behaving as though they were produced via a secondary, not a primary, nucleosynthesis process. A detailed comparison of our results with the models for nucleosynthesis and dredge up of low metallicity intermediate mass AGB stars by Ventura, D’Antona & Mazzitelli (2002) fails to explain the details of the C and N abundances, predicting key ratios incorrectly by a factor of up to 10. Thus pollution of cluster gas by such stars can also be ruled out unless current models of surface N abundances after dredge up are flawed, which seems possible given the complexity of the modeling and the many assumptions required.
The behavior of the C and N abundances among low luminosity stars in GCs, while [Fe/H] is constant to high precision within each GC, force us to assume that there was an extended period of star formation in GCs. The first stars were exclusively of high mass, and their SNII ejecta produced the heavy metals seen in the GC. A second generation of short-lived stars of an unknown type (not intermediate mass AGB stars, unless current models are flawed) evolved, ejected mass, and “polluted” with light elements the GC gas; the low mass stars we see today formed afterwards.
References
- Asplund, Grevesse & Sauval (2005) Asplund, M., Grevesse,N. & Sauval, A. J., 2005, in Cosmic Abundances as Records of Stellar Evolution and Nucleosynthesis, ed. F. N. Bash & T. G. Barnes, ASP Conf. Series, Vol. 30
- Bell & Gustafsson (1978) Bell, R. A. & Gustafsson, B. 1978, A&AS, 34, 229
- Bell & Gustafsson (1989) Bell, R. A. & Gustafsson, B. 1989, MNRAS, 236, 653
- Bell, Paltoglou, & Tripicco (1994) Bell, R. A., Paltoglou, G., & Tripicco, M. J. 1994, MNRAS, 268, 771
- Bellman et al. (2001) Bellman, S., Briley, M.M., Smith, G.H. & Claver, C.F., 2001, PASP, 113, 326
- Briley & Smith (1993) Briley, M. M. & Smith, G. H. 1993, PASP, 105, 1260
- Briley & Cohen (2001) Briley, M. M. & Cohen, J. G. 2001, AJ, 122, 242
- Briley, Smith & Claver (2001) Briley, M. M., Smith, G. H. & Claver, C. F., 2001, AJ, 122, 2561
- Briley, Cohen & Stetson (2002) Briley, M. M., Cohen, J. G. & Stetson, P. B., 2002, ApJ, 579, L17
- Briley et al. (2004a) Briley, M. M., Harbeck, D., Smith G. H. & Grebel, E. K., 2004a, AJ, 127, 1588
- Briley, Cohen & Stetson (2004b) Briley, M. M., Cohen, J. G. & Stetson, P. B., 2004b, AJ, 127, 1579
- Bromm & Larson (2004) Bromm, V. & Larson, R. B., 2004, ARA&A, 42, 79
- Buonanno, Corsi & Fusi Pecci (1987) Buonanno, R., Corsi, C. E. & Fusi Pecci, F., 1987, A&A, 145, 97
- Cannon et al. (1998) Cannon, R.D., Croke, B.F.W., Bell, R.A., Hesser, J.E. & Stathakis, R.A., 1998, MNRAS, 298, 601
- Carbon et al. (1982) Carbon, D.F., Langer, G.E., Butler, D., Kraft, R., Suntzeff, N., Kemper, E., Trefzger, C. & Romanishin, W., 1982, ApJS, 49, 207
- Cavallo et al. (1998) Cavallo, R. M., Sweigart, A. V. & Bell, R. A., 1998, ApJ, 492, 575
- Charbonnel (1994) Charbonnel, C., 1994, A&A, 282, 811
- Cohen (1999) Cohen, J. G., 1999, AJ, 117, 2434
- Cohen, Briley & Stetson (2004) Cohen, J. G., Briley, M. M. & Stetson, P. B., 2002, AJ, 123, 2525
- Cohen & Melendez (2005) Cohen, J. G. & Melendez, J., 2005, AJ, 129, 303
- Cutri et al. (2003) Cutri, R. M. et al., 2003, “Explanatory Supplement to the 2MASS All-Sky Data Release, http://www.ipac.caltech.edu/2mass/releases/allsky/doc/explsup.html
- DaCosta & Armandroff (1990) DaCosta, G. S. & Armandroff, T. E., 1990, AJ, 100, 162
- D’Antona et al. (2002) D’Antona, F., Caloi, V., Montalban, J. Ventura, P. & Gratton, R. 2002, A&A,
- Demarque et al. (2004) Demarque, P., Woo, J., Kim, Y., & Yi, S. K., 2004, ApJS, 155, 667
- Denissenkov & Denissenkova (1990) Denissenkov, P. A. & Denissenkova, S. N., 1990, SvAL, 16, 275
- Denissenkov & Weiss (1996) Denissenkov, P. A. & Weiss, A., 1996, A&A, 308, 773
- Denissenkov & Herwig (2003) Denissenkov, P. A. & Herwig, F., 2003, ApJ, 590, L99
- Do Nascimento et al. (2000) Do Nascimento Jr., J. D., Charbonnel, C., Lèbre, A., de Laverny, P. & De Medeiros, J. R., 2000, A&A, 357, 931
- Durrell & Harris (1992) Durell, P.B. & Harris, W.E., 1992, AJ, 105 1420
- Fenner et al. (2004) Fenner, Y., Campbell, S., Karakas, A.I., Lattanzio, J.C. & Gibson, B.K., 2004, MNRAS, 353, 789
- Gavilan, Buell & Molla (2004) Gavilan, M., Buell, J. F. & Molla, 2004, A&A (in press) (Astro-ph/0411746)
- Gratton et al. (2000) Gratton, R.G., Sneden, C., Carretta, E. & Bragaglia, A., 2000, A&A, 354, 169
- Gratton et al. (2001) Gratton, R. G. et al., 2001, A&A, 369, 87
- Gratton, Sneden & Carretta (2004) Gratton, R. G., Sneden, C. & Carretta, E., 2004, ARA&A, 42, 385
- Gustafsson, Bell, Eriksson, & Nordlund (1975) Gustafsson, B., Bell, R. A., Eriksson, K., & Nordlund, Å. 1975, A&A, 42, 407
- Gustafsson & Bell (1979) Gustafsson, B. & Bell, R. A. 1979, A&A, 74, 313
- Harris (1996) Harris, W. E. 1996, AJ, 112, 1487
- Herwig (2004) Herwig, F., 2004, ApJS, 155, 651
- Hesser (1978) Hesser, J. E., 1978, ApJ, 223, L117
- Houdashelt (2000) Houdashelt, M. L., Bell, R. A. & Sweigart, A. V., 2000, AJ, 119, 1448
- Iben & Renzini (1983) Iben, I. Jr. & Renzini, A., 1983, ARA&A, 21, 271
- Karakas (2003) Karakas, A.I., 2003, PhD thesis, Monash University
- Kraft (1994) Kraft, R. P. 1994, PASP, 106, 553
- Kratsov & Gendin (2004) Kravtsov, A. V. & Gendin, O. Y., 2003, ApJ (in press)
- Landolt (1992) Landolt, A. R., 1992, AJ, 104, 340
- Langer (1985) Langer, G. E., 1985, PASP, 97, 382
- Langer et al. (1986) Langer, G. E., Kraft, R.P., Carbon, D.F., Friel, E. & Oke, J.B., 1986, PASP, 98, 473
- Lattanzio, Charbonnel & Forestini (199) Lattanzio, J., Charbonnel, C. & Forestini, M., 1999, in The Changes in Abundances in AGB Stars, (Astro-ph/9912298)
- Marigo (2001) Marigo, P., 2001, A&A, 370, 194
- Mashchencko & Sills (2004) Mashchencko, S. & Sills, A.,2004, ApJ (in press)
- McCarthy et al. (1998) McCarthy, J. K. et al., 1998, Proceedings SPIE, 3355, 81
- Meléndez, Barbuy & Spite (2001) Meléndez, J., Barbuy, B., & Spite, F., 2001, ApJ, 556, 858
- Monet et al. (1998) Monet, D.G. et al., 1998, USNO-A2.0 Catalog (on CD-ROM) (Flagstaff:USNO)
- Norris, Freeman & Da Costa (1984) Norris, J.E., Freeman, K.C. & DaCosta, G.S., 1984, ApJ, 277, 615
- Oke et al. (1995) Oke, J. B., Cohen, J. G., Carr, M., Cromer, J., Dingizian, A., Harris, F. H., Labrecque, S., Lucinio, R., Schaal, W., Epps, H., & Miller, J., 1995, PASP, 107, 307
- Pinsonneault (1997) Pinsonneault, M., 1997, ARA&A, 35, 557
- Pryor & Meylan (1993) Pryor, C. & Meylan, G., 1993, in Structure and Dynamics of Globular Clusters, ed. S. Djorgovski & G. Meylan, ASP, pg. 357
- Ramírez et al. (2002a) Ramírez, S. V. & Cohen, J. G., 2002a, AJ, 123, 3277
- Ramírez et al. (2002b) Ramírez, S. V. & Cohen, J. G., 2002b, AJ, 125, 224
- Recio-Blanco et al. (2004) Recio-Blanco, A., Piotto, G., De Angeli, F., Cassisi, S., Fiello, M., Saralis, M., Pietrinferni, A., Zoccali, M. & Aparicio, A., 2004, A&A
- Shetrone et al. (1993) Shetrone, M. D., Sneden, C. & Pilachowski, C. A., 1993, PASP, 105, 337
- Shortridge (1993) Shortridge, K. 1993, in Astronomical Data Analysis Software and Systems II, A.S.P. Conf. Ser., Vol 52, eds. R.J. Hannisch, R.J.V. Brissenden & J. Barnes, 219
- Skrutskie et al. (1997) Skrutskie, M. F., Schneider, S.E., Stiening, R., Strom, S.E., Weinberg, M.D., Beichman, C., Chester, T. et al., 1997, in The Impact of Large Scale Near-IR Sky Surveys, ed. F.Garzon et al. (Dordrecht: Kluwer), p. 187
- Smith et al. (1996) Smith, G.H., Shetrone, M.D., Bell, R.A., Churchill, C.W. & Briley, M.M., 1996, AJ, 112, 1511
- Sneden et al. (1991) Sneden, C., Kraft, R. P., Shetrone, M. D., Smith, G. H., Langer, G. E. & Prosser, C., 1991, AJ, 114, 1964
- Spite et al. (2004) Spite, M. et al. 2004, A&A, 430, 655
- Stetson (1987) Stetson, P. B., 1987, PASP, 99, 191
- Stetson (2000) Stetson, P.B., 2000, PASP, 112, 925
- Stranghellini, Shaw & Gilmore (2004) Stranghellini, L, Shaw, R. A. & Gilmore, D., 2004, ApJ (in press) (Astro-ph/0411631)
- Suntzeff (1981) Suntzeff, N. B., 1981, ApJS, 47, 1
- Sweigart & Mengel (1979) Sweigart, A. V. & Mengel, J. G., 1979, ApJ, 229, 624
- Thoul et al. (2002) Thoul, A., Jorissen, A., Goriely, S., Jehin, E., Magain, P., Noels, A. & Parmentier, G. 2002, A&A, 383, 491
- Trefzger et al. (1983) Trefzger, C.F., Carbon, D.F., Langer. G.E., Suntzeff, N.B. & Kraft, R.P., 1983, ApJ, 266, 144
- Tripicco & Bell (1995) Tripicco, M. J. & Bell, R. A., 1995, AJ, 110, 3035
- van Loon (2000) van Loon, Th., 2000, A&A, 354, 125
- Vasiliadis & Wood (1998) Vasiliadis, E. & Wood, P. R., 1998, ApJ, 413, 641
- Ventura, D’Antona, Mazzitelli, & Gratton (2001) Ventura, P., D’Antona, F., Mazzitelli, I., & Gratton, R., 2001, ApJ, 550, L65
- Ventura, D’Antona & Mazzitelli (2002) Ventura, P., D’Antona, F. & Mazzitelli, I., 2002, A&A, 393, 215
- Ventura & D’Antona (2005) Ventura, P. & D’Antona, F., 2005, A&A (in press)
- Weiss et al. (2000) Weiss, A., Denissenkov, P. A., & Charbonnel, C., 2000, A&A, 356, 181
- Wilson et al. (2003) Wilson, W. C. et al., 2003, SPIE, 484, 4157
- Yi et al. (2001) Yi, S., Demarque, P., Kim, Y.-C. , Lee, Y.-W., Ree, C. Lejeune, Th. & Barnes, S., 2001, ApJS, 136, 417
- Zoccali et al. (1999) Zoccali, M., Cassisi, G., Piotto, G., Bono, G. & Salaris, M., 1999, ApJ, 518, L49


| IDaaThe star names are derived from their J2000 coordinates. Star C12345_5432 has coordinates 21 12 34.5 +12 54 32 (J2000). | ||||
|---|---|---|---|---|
| (mag) | (mag) | (mag) | (mag)cc from multiple measurements indicated if it exceeds 0.05 mag. | |
| C29363_0823 | 18.03 | 17.17 | 16.61 | 16.05 |
| C29387_0716 | 18.27 | 17.40 | ||
| C29388_0634 | 16.74 | 15.77 | 15.16 | 14.58 |
| C29396_0843 | 17.51 | 16.61 | 16.01 | 15.49 |
| C29401_0908 | 17.70 | 16.81 | 16.21 | 15.68 |
| C29408_1003 | 18.00 | 17.15 | 16.52 | 16.07 |
| C29413_1023 | 17.32 | 16.46 | 15.81 | 15.34 |
| C29417_0953 | 18.32 | 17.50 | 16.08 | 16.41 |
| C29413_1021 | 18.92 | 18.33 | 14.10 | 13.55 |
| C29424_0729eeThis star is on the extended BHB. | 17.83 | 17.97 | ||
| C29426_0727 | 16.99 | 16.03 | 15.46 | 14.92 |
| C29429_0801 | 16.86 | 15.94 | 15.37 | 14.84 |
| C29442_0710 | 17.32 | 16.41 | 15.86 | 15.37 |
| C29443_0958 | 20.83 | 20.00 | ||
| C29444_0618 | 18.60 | 17.85 | 17.34 | 16.91 |
| C29445_0952ffThis object is actually a close pair. | 16.88 | 15.90 | 15.16 | 14.63 |
| C29448_0655 | 19.51 | |||
| C29448_0824 | 16.52 | 15.53 | 14.88 | 14.33 |
| C29455_0524 | 18.60 | 17.78 | 17.28 | |
| C29457_0518 | 19.27 | 18.68 | ||
| C29461_0905 | 19.13 | 18.60 | 18.13 | |
| C29464_0644 | 16.93 | 15.98 | 15.42 | 14.90 |
| C29465_0859 | 16.91 | 15.89 | 15.26 | 14.72 |
| C29475_0512 | 18.52 | 17.71 | 17.21 | 16.83 |
| C29485_0436 | 18.25 | 17.33 | 16.76 | 16.25 |
| C29485_0638ddCrowded. | 17.35 | 16.50 | 15.95 | 15.50 |
| C29491_0504 | 17.51 | 16.62 | 15.97 | 15.46 |
| C29504_0630 | 18.41 | 17.67 | 17.21 | 16.72 |
| C29523_0432 | 16.98 | 16.03 | 15.35 | 14.80 |
| C29533_0714 | 19.26 | 18.66 | ||
| C29534_0711 | 17.72 | 16.84 | 16.27 | 15.77 |
| C29549_0416 | 17.86 | 16.97 | 16.27 | 15.76 |
| C29560_0528 | 18.42 | 17.60 | 16.97 | 16.46 |
| C29573_0454 | 17.60 | 16.66 | 16.00 | 15.51 |
| C29582_0433 | 16.61 | 15.65 | 14.89 | 14.34 |
| C30029_1248 | 17.07 | 16.17 | 15.46 | 14.94 |
| C30048_1355 | 18.17 | 17.24 | 16.63 | 16.17 |
| C30051_1331 | 18.26 | 17.39 | 16.72 | 16.24 |
| C30054_1253 | 16.67 | 15.73 | 15.02 | 14.49 |
| C30056_1227 | 18.40 | 17.59 | 17.06 | 16.63 |
| C30069_1254 | 17.55 | 16.64 | 15.91 | 15.39 |
| C30076_1230 | 17.46 | 16.56 | 15.88 | 15.35 |
| C30093_1130 | 18.09 | 17.25 | 16.58 | 16.15 |
| C30095_1227 | 18.21 | 17.51 | 16.16 | |
| C30096_1213 | 16.92 | 16.00 | 15.26 | 14.70 |
| C30102_1201 | 17.75 | 16.90 | 16.21 | 15.74 (0.05) |
| C30108_0858 | 16.92 | 15.97 | 15.39 | 14.81 |
| C30108_1109 | 18.47 | 17.73 | 17.24 | 16.91 |
| C30114_1055 | 18.18 | 17.34 | 16.86 | 16.35 |
| C30116_1015 | 17.53 | 16.63 | 16.05 | 15.51 |
| C30116_1219 | 16.69 | 15.79 | 15.09 | 14.55 |
| C30123_1138 | 18.27 | 17.41 | 16.89 | 16.38 (0.06) |
| C30124_0922 | 18.39 | 17.67 | 17.26 | 16.84 |
| C30128_0840ddCrowded. | 17.85 | 17.63 | 17.65 (0.30) | |
| C30129_0946 | 18.05 | 17.22 | 16.61 | 16.08 |
| C30130_0945 | 19.53 | 19.00 | ||
| C30130_1008 | 18.10 | 17.25 | 16.61 | 16.16 |
| C30131_0800 | 17.02 | 16.11 | 15.44 | 14.86 |
| C30131_0829 | 16.70 | 15.79 | 15.10 | 14.50 |
| C30141_0819 | 18.17 | 17.33 | 16.72 | 16.18 |
| C30146_0829 | 18.28 | 17.47 | 16.85 | 16.35 |
| C30148_0825 | 15.37 | 14.37 | 13.62 | 12.97 |
| C30149_1010 | 18.74 | 17.53 | 16.94 | |
| C30159_1044 | 16.76 | 15.81 | 15.18 | 14.61 |
| C30165_0939 | 18.47 | 17.67 | 17.09 | 16.56 |
| C30179_0938 | 18.18 | 17.35 | 16.72 | 16.23 |
| C30199_0745 | 18.26 | 17.47 | 16.82 | 16.30 |
| C30215_0807 | 17.25 | 16.39 | 15.68 | 15.09 |
| C30247_0911 | 16.66 | 15.02 | 14.44 | |
| C30251_0915 | 16.72 | 15.08 | 14.50 | |
| Non-membersbbSpectrum appears too strong lined for M15 membership. | ||||
| C29393_0829 | 18.46 | 17.65 | 17.13 | 16.77 |
| C29419_0508 | 17.88 | 17.00 | 16.45 | 15.93 |
| C30162_0738 | 16.64 | 15.87 |
| Teff | log g | [C/Fe] | [C/Fe] | [C/Fe] | [C/Fe] | [C/Fe] | [C/Fe] | [C/Fe] | [C/Fe] | [C/Fe] | [C/Fe] | |
|---|---|---|---|---|---|---|---|---|---|---|---|---|
| +0.0 | +0.2 | +0.4 | ||||||||||
| (K) | (dex) | (dex) | (dex) | (dex) | (dex) | (dex) | (dex) | (dex) | (dex) | (dex) | (dex) | |
| 5159 | 2.57 | 1.031 | 0.045 | 0.047 | 0.051 | 0.057 | 0.066 | 0.080 | 0.100 | 0.126 | 0.162 | 0.199 |
| 5201 | 2.68 | 1.283 | 0.043 | 0.046 | 0.049 | 0.055 | 0.063 | 0.076 | 0.094 | 0.119 | 0.152 | 0.189 |
| 5229 | 2.76 | 1.452 | 0.043 | 0.045 | 0.048 | 0.053 | 0.061 | 0.073 | 0.090 | 0.114 | 0.146 | 0.182 |
| 5255 | 2.84 | 1.622 | 0.042 | 0.044 | 0.047 | 0.052 | 0.060 | 0.071 | 0.087 | 0.110 | 0.142 | 0.177 |
| 5297 | 2.96 | 1.878 | 0.041 | 0.042 | 0.045 | 0.050 | 0.057 | 0.067 | 0.082 | 0.104 | 0.134 | 0.169 |
| 5320 | 3.04 | 2.052 | 0.040 | 0.042 | 0.045 | 0.049 | 0.056 | 0.066 | 0.080 | 0.101 | 0.130 | 0.165 |
| 5346 | 3.12 | 2.225 | 0.039 | 0.041 | 0.043 | 0.048 | 0.054 | 0.064 | 0.078 | 0.097 | 0.126 | 0.160 |
| 5388 | 3.23 | 2.484 | 0.038 | 0.039 | 0.042 | 0.046 | 0.051 | 0.060 | 0.073 | 0.091 | 0.118 | 0.150 |
| 5418 | 3.31 | 2.654 | 0.037 | 0.038 | 0.041 | 0.044 | 0.050 | 0.058 | 0.070 | 0.088 | 0.113 | 0.144 |
| 5454 | 3.39 | 2.818 | 0.036 | 0.037 | 0.039 | 0.042 | 0.047 | 0.055 | 0.066 | 0.084 | 0.106 | 0.136 |
| 5532 | 3.51 | 3.033 | 0.034 | 0.035 | 0.036 | 0.039 | 0.043 | 0.049 | 0.058 | 0.071 | 0.091 | 0.117 |
| 5607 | 3.57 | 3.136 | 0.032 | 0.033 | 0.034 | 0.036 | 0.039 | 0.043 | 0.050 | 0.061 | 0.078 | 0.099 |
| 5739 | 3.66 | 3.229 | 0.029 | 0.029 | 0.030 | 0.031 | 0.033 | 0.036 | 0.040 | 0.047 | 0.059 | 0.074 |
| 5976 | 3.78 | 3.337 | 0.025 | 0.025 | 0.026 | 0.026 | 0.027 | 0.028 | 0.030 | 0.033 | 0.038 | 0.046 |
| 6217 | 3.91 | 3.461 | 0.022 | 0.022 | 0.022 | 0.022 | 0.023 | 0.023 | 0.024 | 0.026 | 0.028 | 0.031 |
| 6387 | 4.03 | 3.641 | 0.020 | 0.020 | 0.020 | 0.020 | 0.020 | 0.020 | 0.021 | 0.021 | 0.023 | 0.024 |
| 6437 | 4.13 | 3.864 | 0.020 | 0.020 | 0.020 | 0.020 | 0.020 | 0.021 | 0.021 | 0.022 | 0.023 | 0.024 |
| 6412 | 4.22 | 4.118 | 0.018 | 0.018 | 0.018 | 0.019 | 0.019 | 0.019 | 0.020 | 0.021 | 0.022 | 0.024 |
| [N/Fe] | ||||||||||||||
|---|---|---|---|---|---|---|---|---|---|---|---|---|---|---|
| +0.0 | +0.2 | +0.4 | +0.8 | +1.0 | +1.2 | +1.4 | +1.6 | +1.8 | +2.0 | |||||
| (dex) | ||||||||||||||
| 1.031 | 0.030 | 0.037 | 0.046 | 0.060 | 0.078 | 0.100 | 0.127 | 0.158 | 0.192 | 0.229 | 0.264 | 0.294 | 0.316 | 0.329 |
| 1.283 | 0.028 | 0.034 | 0.043 | 0.056 | 0.073 | 0.095 | 0.121 | 0.151 | 0.184 | 0.221 | 0.257 | 0.288 | 0.313 | 0.327 |
| 1.452 | 0.027 | 0.033 | 0.042 | 0.054 | 0.070 | 0.091 | 0.117 | 0.147 | 0.180 | 0.216 | 0.252 | 0.285 | 0.310 | 0.326 |
| 1.622 | 0.026 | 0.032 | 0.040 | 0.052 | 0.068 | 0.088 | 0.114 | 0.143 | 0.176 | 0.212 | 0.248 | 0.282 | 0.308 | 0.325 |
| 1.878 | 0.025 | 0.030 | 0.038 | 0.049 | 0.064 | 0.084 | 0.108 | 0.137 | 0.169 | 0.204 | 0.241 | 0.276 | 0.303 | 0.323 |
| 2.052 | 0.024 | 0.029 | 0.037 | 0.047 | 0.062 | 0.082 | 0.106 | 0.134 | 0.167 | 0.201 | 0.238 | 0.273 | 0.301 | 0.322 |
| 2.225 | 0.023 | 0.028 | 0.035 | 0.045 | 0.060 | 0.079 | 0.103 | 0.131 | 0.163 | 0.197 | 0.234 | 0.269 | 0.299 | 0.320 |
| 2.484 | 0.021 | 0.026 | 0.032 | 0.042 | 0.056 | 0.074 | 0.096 | 0.124 | 0.155 | 0.190 | 0.226 | 0.262 | 0.293 | 0.316 |
| 2.654 | 0.020 | 0.024 | 0.030 | 0.040 | 0.053 | 0.070 | 0.092 | 0.119 | 0.150 | 0.184 | 0.220 | 0.257 | 0.289 | 0.313 |
| 2.818 | 0.018 | 0.022 | 0.028 | 0.037 | 0.049 | 0.065 | 0.086 | 0.113 | 0.143 | 0.177 | 0.213 | 0.249 | 0.282 | 0.308 |
| 3.033 | 0.015 | 0.018 | 0.023 | 0.030 | 0.040 | 0.054 | 0.073 | 0.097 | 0.125 | 0.158 | 0.192 | 0.229 | 0.264 | 0.294 |
| 3.136 | 0.012 | 0.015 | 0.018 | 0.024 | 0.032 | 0.044 | 0.060 | 0.081 | 0.106 | 0.137 | 0.170 | 0.206 | 0.242 | 0.275 |
| 3.229 | 0.008 | 0.009 | 0.012 | 0.015 | 0.021 | 0.029 | 0.040 | 0.056 | 0.077 | 0.103 | 0.133 | 0.166 | 0.201 | 0.237 |
| 3.337 | 0.002 | 0.003 | 0.004 | 0.005 | 0.008 | 0.012 | 0.017 | 0.025 | 0.037 | 0.054 | 0.075 | 0.101 | 0.132 | 0.165 |
| 3.461 | -0.002 | -0.002 | -0.002 | -0.001 | 0.000 | 0.002 | 0.004 | 0.008 | 0.014 | 0.023 | 0.035 | 0.052 | 0.074 | 0.101 |
| 3.641 | -0.005 | -0.005 | -0.005 | -0.004 | -0.003 | -0.002 | -0.001 | 0.001 | 0.005 | 0.010 | 0.019 | 0.030 | 0.046 | 0.067 |
| 3.864 | -0.006 | -0.006 | -0.005 | -0.005 | -0.004 | -0.003 | -0.002 | 0.000 | 0.003 | 0.008 | 0.016 | 0.027 | 0.042 | 0.062 |
| 4.118 | -0.006 | -0.006 | -0.005 | -0.005 | -0.004 | -0.003 | -0.001 | 0.001 | 0.005 | 0.011 | 0.020 | 0.032 | 0.049 | 0.071 |
| Star | V | BV | MV | Teff | log g | CH | NH | [C/Fe] | [N/Fe] |
|---|---|---|---|---|---|---|---|---|---|
| (mag) | (mga) | (mag) | (K) | (dex) | (%) | (%) | (dex) | (dex) | |
| C30148_0825 | 15.37 | 0.81 | 0.06 | 4939 | 2.05 | 0.1230.008 | 0.2440.024 | ||
| C29448_0824 | 16.52 | 0.74 | 1.21 | 5143 | 2.60 | 0.1060.007 | 0.0130.010 | ||
| C29582_0433 | 16.61 | 0.74 | 1.30 | 5157 | 2.65 | 0.0990.008 | 0.1870.016 | ||
| C30247_0911 | 16.66 | 0.69 | 1.35 | 5166 | 2.67 | 0.0950.006 | 0.014 | ||
| C30054_1253 | 16.67 | 0.67 | 1.36 | 5167 | 2.67 | 0.1020.006 | 0.1900.018 | ||
| C30116_1219 | 16.69 | 0.74 | 1.38 | 5170 | 2.68 | 0.1010.006 | 0.0370.017 | ||
| C30131_0829 | 16.70 | 0.73 | 1.39 | 5172 | 2.68 | 0.1030.007 | 0.0410.015 | ||
| C29388_0634 | 16.74 | 0.70 | 1.43 | 5178 | 2.71 | 0.1040.004 | 0.1040.012 | ||
| C30159_1044 | 16.76 | 0.74 | 1.45 | 5181 | 2.72 | 0.1130.008 | 0.1150.028 | ||
| C29429_0801 | 16.86 | 0.69 | 1.55 | 5195 | 2.77 | 0.0820.005 | 0.0280.016 | ||
| C29445_0952bbThis object is a close pair. | 16.88 | 0.75 | 1.57 | 5198 | 2.78 | 0.0590.004 | 0.0710.024 | ||
| C29465_0859 | 16.91 | 0.68 | 1.60 | 5203 | 2.79 | 0.1000.006 | 0.2470.015 | ||
| C30108_0858 | 16.92 | 0.71 | 1.61 | 5205 | 2.79 | 0.0610.004 | 0.2590.017 | ||
| C30096_1213 | 16.92 | 0.63 | 1.61 | 5205 | 2.79 | 0.1240.009 | 0.0250.019 | ||
| C29464_0644 | 16.93 | 0.71 | 1.62 | 5207 | 2.80 | 0.0770.006 | 0.2130.016 | ||
| C29523_0432 | 16.98 | 0.69 | 1.67 | 5215 | 2.82 | 0.1160.009 | 0.0660.018 | ||
| C29426_0727 | 16.99 | 0.69 | 1.68 | 5216 | 2.82 | 0.0810.006 | 0.1730.014 | ||
| C30131_0800 | 17.02 | 0.72 | 1.71 | 5220 | 2.84 | 0.0870.003 | |||
| C30029_1248 | 17.07 | 0.68 | 1.76 | 5227 | 2.86 | 0.0890.004 | 0.1970.021 | ||
| C30215_0807 | 17.25 | 0.65 | 1.94 | 5256 | 2.95 | 0.1170.008 | 0.0810.017 | ||
| C29442_0710 | 17.32 | 0.68 | 2.01 | 5266 | 2.97 | 0.0560.004 | 0.2280.015 | ||
| C29413_1023 | 17.32 | 0.69 | 2.01 | 5266 | 2.97 | 0.1540.010 | 0.3170.016 | ||
| C29485_0638 | 17.35 | 0.61 | 2.04 | 5270 | 2.99 | 0.0650.004 | 0.1130.018 | ||
| C30076_1230 | 17.46 | 0.60 | 2.15 | 5288 | 3.04 | 0.0830.006 | 0.2570.025 | ||
| C29491_0504 | 17.51 | 0.64 | 2.20 | 5295 | 3.06 | 0.0980.008 | 0.0780.022 | ||
| C29396_0843 | 17.51 | 0.71 | 2.20 | 5295 | 3.06 | 0.0890.002 | 0.0080.019 | ||
| C30116_1015 | 17.53 | 0.71 | 2.22 | 5298 | 3.07 | 0.0800.006 | 0.0110.027 | ||
| C30069_1254 | 17.55 | 0.61 | 2.24 | 5301 | 3.08 | 0.0670.005 | 0.1160.021 | ||
| C29573_0454 | 17.60 | 0.68 | 2.29 | 5310 | 3.10 | 0.1150.009 | 0.3490.025 | ||
| C29401_0908 | 17.70 | 0.68 | 2.39 | 5327 | 3.15 | 0.0620.005 | 0.2200.019 | ||
| C29534_0711 | 17.72 | 0.66 | 2.41 | 5330 | 3.16 | 0.0700.005 | 0.029 | ||
| C30102_1201 | 17.75 | 0.62 | 2.44 | 5336 | 3.17 | 0.0460.004 | 0.2430.044 | ||
| C29424_0729aaHot star on extended HB in M15. | 17.85 | 2.54 | 0.0040.002 | ||||||
| C29549_0416 | 17.86 | 0.64 | 2.55 | 5356 | 3.23 | 0.0790.006 | 0.032 | ||
| C29408_1003 | 18.00 | 0.67 | 2.69 | 5388 | 3.30 | 0.0890.006 | 0.0310.018 | ||
| C29363_0823 | 18.03 | 0.67 | 2.72 | 5396 | 3.31 | 0.0750.006 | 0.0310.024 | ||
| C30129_0946 | 18.05 | 0.65 | 2.74 | 5401 | 3.32 | 0.0580.005 | 0.2970.046 | ||
| C30093_1130 | 18.09 | 0.58 | 2.78 | 5413 | 3.34 | 0.0690.005 | 0.0230.031 | ||
| C30130_1008 | 18.10 | 0.68 | 2.79 | 5416 | 3.34 | 0.0490.004 | 0.1460.035 | ||
| C30141_0819 | 18.17 | 0.65 | 2.86 | 5440 | 3.38 | 0.0670.007 | 0.0410.049 | ||
| C30048_1355 | 18.17 | 0.70 | 2.86 | 5440 | 3.38 | 0.0610.006 | 0.0450.041 | ||
| C30179_0938 | 18.18 | 0.64 | 2.87 | 5444 | 3.38 | 0.0440.004 | 0.1730.028 | ||
| C30114_1055 | 18.18 | 0.62 | 2.87 | 5444 | 3.38 | 0.0560.005 | 0.1510.028 | ||
| C30095_1227 | 18.21 | 0.57 | 2.90 | 5457 | 3.41 | 0.0740.006 | 0.034 | ||
| C29485_0436 | 18.25 | 0.65 | 2.94 | 5475 | 3.43 | 0.0810.007 | 0.0070.032 | ||
| C30199_0745 | 18.26 | 0.60 | 2.95 | 5480 | 3.44 | 0.0520.004 | 0.047 | ||
| C30051_1331 | 18.26 | 0.70 | 2.95 | 5480 | 3.44 | 0.0850.006 | 0.0190.035 | ||
| C30123_1138 | 18.27 | 0.57 | 2.96 | 5485 | 3.44 | 0.1090.008 | 0.2540.034 | ||
| C29387_0716 | 18.27 | 0.64 | 2.96 | 5485 | 3.44 | 0.0430.003 | 0.2340.022 | ||
| C30146_0829 | 18.28 | 0.64 | 2.97 | 5491 | 3.45 | 0.0580.004 | 0.0880.028 | ||
| C29417_0953 | 18.32 | 0.63 | 3.01 | 5515 | 3.47 | 0.0610.004 | 0.1090.019 | ||
| C30124_0922 | 18.39 | 0.52 | 3.08 | 5574 | 3.52 | 0.0240.002 | 0.032 | ||
| C30056_1227 | 18.40 | 0.56 | 3.09 | 5585 | 3.53 | 0.0240.005 | 0.2260.040 | ||
| C29504_0630 | 18.41 | 0.54 | 3.10 | 5596 | 3.53 | 0.0240.003 | 0.0990.024 | ||
| C29560_0528 | 18.42 | 0.62 | 3.11 | 5609 | 3.54 | 0.0490.004 | 0.1200.042 | ||
| C30165_0939 | 18.47 | 0.58 | 3.16 | 5690 | 3.59 | 0.0200.015 | 0.3450.059 | ||
| C30108_1109 | 18.47 | 0.54 | 3.16 | 5690 | 3.59 | 0.0170.003 | 0.0260.031 | ||
| C29475_0512 | 18.52 | 0.55 | 3.21 | 5802 | 3.65 | 0.0260.003 | 0.1310.028 | ||
| C29455_0524 | 18.60 | 0.56 | 3.29 | 6000 | 3.75 | 0.0400.003 | 0.0300.030 | ||
| C29444_0618 | 18.60 | 0.54 | 3.29 | 6000 | 3.75 | 0.0250.003 | 0.0810.028 | ||
| C29413_1021 | 18.92 | 0.45 | 3.61 | 6477 | 4.02 | 0.0280.003 | 0.0000.024 | ||
| C29461_0905 | 19.13 | 0.43 | 3.82 | 6569 | 4.12 | 0.0270.002 | |||
| C30149_1009 | 19.16 | 0.50 | 3.85 | 6575 | 4.14 | 0.0280.005 | 0.046 | ||
| C29533_0714 | 19.26 | 3.95 | 6575 | 4.17 | 0.0080.005 | ||||
| C29457_0518 | 19.27 | 0.44 | 3.96 | 6581 | 4.18 | 0.0220.003 | |||
| C29448_0655 | 19.51 | 0.44 | 4.20 | 6559 | 4.27 | 0.0100.004 | |||
| C30130_0945 | 19.53 | 0.45 | 4.22 | 6554 | 4.27 | 0.0150.005 | 0.049 | ||
| C29443_0958 | 20.83 | 0.60 | 5.52 | 5997 | 4.58 | 0.0270.004 | 0.038 |
| (m- M)V = –0.10 | [O/Fe] = +0.20 | C12/C13= 4aaReduced from the adopted value of C12/C13= 10. | [Fe/H] = –2.42bbReduced from the adopted value of [Fe/H] = dex. | Turb = 1.5 km/s | ||||||||
|---|---|---|---|---|---|---|---|---|---|---|---|---|
| Star | [C/Fe] | [N/Fe] | [C/ Fe] | [N/Fe] | [C/Fe] | [N/ Fe] | [C/Fe] | [N/Fe] | [C/Fe] | [N/Fe] | [C/ Fe] | [N/Fe] |
| C30215_0807 | 0.11 | 0.38 | 0.01 | 0.01 | 0.00 | 0.00 | 0.00 | 0.00 | 0.14 | 0.16 | 0.02 | 0.00 |
| C29442_0710 | –0.61 | 1.34 | 0.01 | 0.01 | –0.01 | 0.00 | 0.00 | 0.00 | 0.23 | 0.15 | 0.04 | 0.01 |
| C29387_0716 | –0.67 | 1.58 | 0.12 | 0.07 | –0.01 | 0.00 | –0.01 | 0.00 | 0.33 | 0.16 | 0.07 | 0.03 |
| C30146_0829 | –0.26 | 0.68 | 0.11 | 0.09 | 0.00 | 0.00 | 0.00 | 0.00 | 0.23 | 0.17 | 0.05 | 0.01 |
| Models | Obs. | |||||
|---|---|---|---|---|---|---|
| [Fe/H] | [] | [] | ||||
| (dex) | (dex) | |||||
| (M15) | 0.75 | 28 | +1.6 | 0.20 | 100 | +2.7 |
| (M71, 47 Tuc) | 0.11 | 7 | +1.8 | 0.25 | 15 | +1.8 |