XMM-Newton and VLT observations of the afterglow of GRB 040827††thanks: Based on observations with XMM-Newton, an ESA science mission with instruments and contributions directly funded by ESA member states and the USA (NASA), and on observations collected at the European Southern Observatory, Paranal, Chile, under proposal 073.D-0255.
The field of the Gamma-Ray Burst GRB 040827 was observed with XMM-Newton and with the ESO/VLT starting and hours after the burst, respectively. A fading X-ray afterglow is clearly detected with the XMM-Newton/EPIC instrument, with a time decay , with . Its spectrum is well described by a power law (photon index ) affected by an absorption largely exceeding (by a factor 5) the expected Galactic one, requiring the contribution of an intrinsic, redshifted absorber. In the optical/NIR range, the afterglow emission was observed in the band, as a weak source superimposed to the host galaxy, with magnitude (12 hours after the GRB, contribution from the host subtracted); in other bands the flux is dominated by the host galaxy. Coupling constraints derived from X-ray spectral fitting and from photometry of the host, we estimated a gas column density in the range (0.4-2.6) cm-2 in the GRB host galaxy, likely located at a redshift . GRB 040827 stands out as the best example of an X-ray afterglow with intrinsic absorption.
Key Words.:
Gamma rays: bursts – X-rays: general1 Introduction
The discovery of afterglow emission at X-ray, optical and radio wavelengths opened a new era in the study of the mysterious Gamma-Ray Burst (GRB) phenomenon. Afterglows’ observations yielded most of our current understanding of long (2 s) GRBs, from their energetics to the evidence of their association with the death of massive stars (see, e.g. van Paradijs et al., 2000; Hurley et al., 2003; Piran, 2004, for comprehensive reviews). A fast and accurate localization of GRBs is required for successful follow-up studies of their afterglows. After the end of the BeppoSAX mission, the INTEGRAL satellite proved to be very powerful in such task, thanks to the INTEGRAL Burst Alert System (IBAS, Mereghetti et al., 2003a), providing near real-time, precise () positioning of about one burst per month. This allows for follow-up observations of GRBs with the most sensitive facilities at different wavelengths. Here we report on the X-ray and optical/NIR studies of the afterglow of GRB 040827 as seen by the XMM-Newton observatory and the ESO very Large Telescope (VLT), respectively.
2 GRB 040827
GRB 040827 was discovered by the INTEGRAL Burst Alert System on 2004, August 27 at 11:50:48 UT. The burst, detected with the IBIS/ISGRI instrument in the 15-200 keV band at 15h16m59.8s, -16∘08′21′′, with an uncertainty of 2.5′, had a duration of 40 s (Mereghetti et al., 2004a, b). The peak flux in the 20-200 keV band was estimated to be 0.6 photons cm-2 s-1, corresponding to erg cm-2 s-1 (Götz & Mereghetti, 2004).
An XMM-Newton observation of the field of GRB 040827 started on August 27 at 18:07:56 UT, 6 h 18 min after the burst. Soon after the beginning of the observation, analysis of real-time data showed an X-ray source (XMMU J151701.3-160828, Rodriguez-Pascual & Gonzalez-Riestra, 2004) within the INTEGRAL error circle, with an offset of 1 arcmin with respect to the nominal aimpoint111See http://xmm.vilspa.esa.es/external/xmm_news/items/grb040827/ index.shtml. The telescope was therefore re-pointed 4300 s after the beginning of the observation. The overall observing time was of 53.2 ks. The source XMMU J151701.3-160828 was found to be variable (Rodriguez-Pascual & Juarez, 2004), and therefore likely associated to the afterglow of GRB 040827. Such an identification was strenghtened by the discovery of a fading NIR transient (see below).
Optical imaging of the INTEGRAL error box started immediately after the IBAS alert. Gladders & Berger (2004) and Tanvir et al. (2004a) reported the presence inside the XMM-Newton error circle of a faint, extended source with , named XMM 2, which was subsequently found to be variable (Kaplan & Berger, 2004; Tanvir et al., 2004b; Malesani et al., 2004a). No radio emission was detected from the source, with a upper limit of 70 Jy, 4.5 days after the GRB (Soderberg & Frail, 2004).
A preliminary report of the XMM-Newton observation was given by De Luca et al. (2004), but the results were affected by problems in the data possibly due to the satellite re-pointing. An improved attitude solution was then made available by the XMM-Newton SOC (Schartel, 2004). We present here a detailed study of the X-ray dataset, coupled to an analysis of the complete set of observations performed with the VLT.
3 XMM-Newton data analysis and results
We have analyzed data collected by the European Photon Imaging Camera (EPIC). It consists of a PN detector (Strüder et al., 2001), with a collecting area of cm2 at 1.5 keV, and of 2 MOS detectors (Turner et al., 2001), with a collecting area of cm2 each at 1.5 keV. All the cameras were operated in their full frame mode (providing imaging across the full 15′radius field of view, with a time resolution of 73 ms in the PN and 2.6 s in the MOS), with the thin optical filter.
The Observation Data Files (ODFs) were retrieved from the XMM-Newton Science Archive and were processed with the XMM-Newton Science Analysis Software (XMM-SASv6.0.0), using standard pipeline tasks (epchain and emchain for the PN and the MOS, respectively) to produce calibrated photon lists, with reconstructed energy, time of arrival and coordinates on the field of view for each detected event.
The X-ray afterglow of GRB 040827 is clearly detected in all the cameras. Cross-correlating several field sources’ positions with the USNO-B1 catalog improved the EPIC astrometry and yielded a source position at 15h17m0146, -16°08′272, with a 1 uncertainty of 15. The position is fully consistent with that of the fading NIR afterglow.
The surface brightness radial profile of the source, computed for each EPIC detector, was fitted with a King function. The best fitting parameters were found to be consistent with the instrumental Point Spread Function (Read, 2004). A claim of possible diffuse emission based on quick look data analysis (Rodriguez-Pascual & Gonzalez-Riestra, 2004) was clearly ascribable to problems in the events’ attitude correction.
Source photons were extracted from a circle of 35 arcsec radius, containing 85% of the events. Background events were selected from source-free regions of the same CCD chip where the target is imaged, following standard prescriptions from the calibration team (Kirsch, 2004): for the PN we used a circle of 50 arcsec radius, located at the same distance from the readout node as the source region; for the MOS we used an annulus centered on the source position with inner and outer radii of 90 and 200 arcsec.

The source is clearly seen to fade during the observation. The background-subtracted light curve extracted from combined MOS and PN data is shown in Fig. 1. The time evolution of the observed count rate is consistent with a power law decay, , with =1.410.10 (, 11 d.o.f.). A somewhat better description (, 9 d.o.f.) of the decay is obtained with a broken power law model, with , and break time ks after the burst. With a simple F-test we evaluated the fit improvement to be significant at level (well below ).
In order to perform the spectral analysis, we screened data from time intervals affected by high particle background episodes (soft proton flares), obtaining good exposure times of 30.0 ks, 38.8 ks and 37.3 ks for the PN, MOS1 and MOS2 cameras, respectively. Spectra for both source and background were extracted from the regions described above. Source spectra were rebinned in order to have at least 25 counts per channel. Ad-hoc response matrices and effective area files were computed with the SAS tasks rmfgen and arfgen222 Possibly owing to the change in pointing direction during the observation, to generate the effective area file it was necessary to describe the source region (in detector coordinates) using a larger number of bins than in standard cases (namely, arfgen parameters detxbins and detybins were set to 30 wrt. a default value of 5)..
The spectral analysis was performed using XSPEC v11.3. Spectra from the three detectors were fitted symultaneously in the range 0.2-9 keV. All the errors on spectral parameters reported in this section are at 90% confidence level for a single interesting parameter.
An absorbed power law model (i.e. , where the photoelectric cross sections are from Balucinska-Church & McCammon (1992), with updated He cross-sections, and keV) yields a reduced =1.35 (145 dof), with photon index 0.1 and column density . Since the expected Galactic absorption in this direction varies from (Schlegel et al., 1998) to (Dickey & Lockman, 1990), we conclude that our best fitting value is significantly higher than the Galactic one.
This is confirmed by the study of the brightest serendipitous source in the field, located at from the afterglow. Its spectrum is well fitted by an absorbed power law with =2.20.2 and . The position of such source was cross-correlated with multiwavelength catalogs, yielding (within 1′′) a USNO-B1 source with a magnitude , corresponding to a ratio , in the typical range of active galactic nuclei (Krautter et al., 1999). Moreover, a coincident radio source (NVSS J151717-160242) was found in the NED database. We conclude that such source is very likely an AGN and that the observed X-ray absorption is a reliable and independent estimate of the Galactic in this direction.
On the other hand, the Galactic value of the column density is totally uncompatible with the afterglow spectrum: forcing the value to we obtain of 3.86 (146 dof).
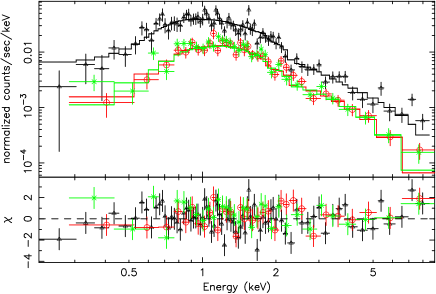
The best description of the afterglow data was obtained by adding to the Galactic () a redshifted neutral absorption component, . In this case the spectral shape is described as , where is fixed to the Galactic value of and represents the gas column density in the host. In the redshift interval , we obtained the best fit ( of 1.18 for 144 dof - see Fig. 2) for an intrinsic absorbing column cm-2 at a redshift , and a power law photon index . The observed 0.2-10 keV flux is erg cm-2 s-1; the corresponding unabsorbed flux is erg cm-2 s-1.
Both and are not well constrained towards large values, owing to their strong correlation. The contour plot for the redshifted absorber column density vs. the redshift , shown in Fig. 3, allows us to estimate that cm-2 and at 90% confidence level (for two parameters of interest).

To evaluate the statistical significance of the additional , we used the F-test, comparing the models with: (i) fixed to the Galactic value; (ii) allowed to vary; (iii) redshifted absorber added to the fixed Galactic . Results are reported in Table 1. The high significance of the intrinsic absorption is evident even in the pessimistic assumption of a Galactic 50% higher than expected, a value which could be marginally consistent with the absorption seen in the spectrum of the serendipitous AGN.
| Absorption models | F value | (F) |
|---|---|---|
| Gal. vs. free | 274 | |
| Gal. vs. | 167 | |
| Gal. +50% vs. free | 187 | |
| Gal. +50% vs. | 118 | |
| Free vs. | 21.5 |
We note that the residuals plotted in Fig 2 (lower panel) show several small wiggles. In order to search for possible emission lines in the afterglow’s spectrum, we tried to add gaussian lines, both single and multiple (up to 5 at a time). The width was fixed (smaller than the instrumental energy resolution); the central energy, together with the line flux, was allowed to vary in the range 0.5-5 keV, where most of the statistics is collected. No significant lines were detected in such range in the combined MOS/PN dataset. The upper limits () on the equivalent width of any emission line are 60 eV and 250 eV in the ranges 0.5-2 and 2-5 keV, respectively.
Thermal models (requiring, in any case, extra absorption wrt. the Galactic ) cannot fit the data equally well. A redshifted, optically thin plasma model (MEKAL in XSPEC), with linked to the redshift of the neutral cold absorber , yields rather poor results ( of 1.89 for 144 dof) when abundances are fixed to solar system values. If abundances are allowed to vary, better results can be obtained. However, in any case the resulting is worse (1.4) than for the simple power law model.
We tried also a composite model encompassing a power law as well as a plasma emission model, but the resulting is similar to that obtained using the simpler power law model.
We searched for a possible spectral evolution, using the power law plus redshifted absorber model. We divided the observation in two time intervals of and ks, in order to have approximately the same number of source photons in each subset, and extracted the corresponding spectra for each EPIC detector. In a symultaneous fit, a simple variation of the power law intensity yields a good description of the data ( of 1.0 for 180 dof). No significant evolution is seen for the absorbing column and the photon index. No significant deviations from the smooth continuum are seen in the time-resolved data.
4 VLT observations
| Date | Time since burst | Filter | Exposure time | Seeing | Instrument | Magnitude |
| (UT) | (days) | (s) | (″) | |||
| 2004 Aug 29.99 | 2.49 | 5120 | 1.2 | VLT+FORS 1 | ||
| 2004 Aug 30.04 | 2.54 | 10120 | 0.6 | VLT+FORS 2 | ||
| 2004 Aug 28.99 | 1.50 | 4180 | 1.4 | VLT+FORS 1 | ||
| 2004 Aug 30.01 | 2.52 | 5240 | 0.5 | VLT+FORS 2 | ||
| 2004 Sep 01.99 | 5.51 | 10180 | 0.6 | VLT+FORS 2 | ||
| 2004 Sep 09.01 | 12.51 | 6180 | 0.4 | VLT+FORS 2 | ||
| 2004 Sep 16.99 | 20.50 | 8180 | 0.6 | VLT+FORS 2 | ||
| 2004 Aug 28.06 | 0.57 | 1030 | 1.0 | VLT+ISAAC | ||
| 2004 Aug 27.97 | 0.47 | 1030 | 0.8 | VLT+ISAAC | ||
| 2004 Aug 27.96 | 0.47 | 1030 | 0.7 | VLT+ISAAC | ||
| 2004 Aug 28.01 | 0.51 | 1030 | 0.9 | VLT+ISAAC | ||
| 2004 Aug 28.98 | 1.48 | 6030 | 0.9 | VLT+ISAAC | ||
| 2004 Sep 16.02 | 19.52 | 3060 | 1.0 | VLT+ISAAC | ||
| 2004 Sep 24.01 | 27.52 | 4560 | 0.6 | VLT+ISAAC | ||
| 2004 Sep 28.00 | 31.50 | 4860 | 1.2 | VLT+ISAAC | ||
| 2004 Aug 30.05 | 2.54 | 300V | 41800 | 1.1 | VLT+FORS 1 | — |
Near-infrared (NIR) observations of the error box of GRB 040827 started as soon as possible after the notification of the trigger. We used the ISAAC camera installed at the Nasmyth focus of the ESO VLT–UT1 (Antu) located at Paranal (Chile). Since the field of view of ISAAC () is not large enough to image the whole INTEGRAL error box, a mosaic of four exposures was obtained. In the following nights, further optical and NIR observations were secured (Tab. 2). Optical data were acquired with the FORS 1 and FORS 2 instruments mounted at the Cassegrain focus of the VLT–UT2 and UT1 respectively. Data reduction was performed using the standard procedures. Both aperture and profile photometry (using DAOPHOT - Stetson, 1987) were adopted to extract instrumental magnitudes. Absolute calibration was achieved by observing standard fields (in the optical) and by using the 2MASS catalog (in the infrared). The consistency of the zeropoint was checked in different nights. In some cases the photometric errors are larger than usual, since the object could be observed just for a small part of the night, at a large airmass.
The source reported by Gladders & Berger (2004) and Tanvir et al. (2004a) was clearly detected in our images at the coordinates , (J2000, uncertainty, based on 9 nonsaturated USNO stars). Its magnitude was on Aug 27.98 (average of our first two measurements), and it showed a dimming by mag in the filter, between 2004 Aug 27.98 and 28.98 (0.49 and 1.48 days after the GRB, respectively), thus confirming the reported variation. Since the seeing was similar in the two epochs (), this result is robust even if in our best-seeing images there are hints that the object is slightly extended (with a size of ).
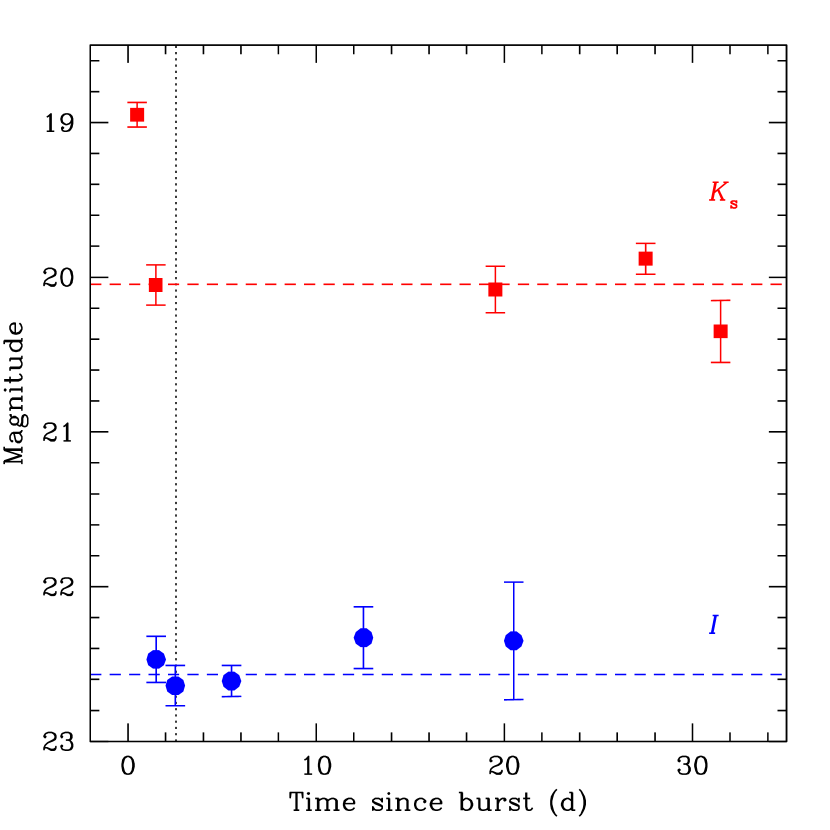
Long-term monitoring was performed in the and bands (see Fig. 4). No significant variation of the source was seen from up to days after the burst, indicating that the source was dominated by the host galaxy. This is consistent with the source being extended. In particular, there is no sign of afterglow emission in the and bands (for which we have not data during the first night). In our early and images, a contribution from the afterglow is likely present, but the host galaxy is contributing by a significant, unknown amount, hampering the determination of the intrinsic afterglow brightness. After averaging over the available measurements, we get for the host galaxy , and . Therefore, we can estimate the afterglow magnitude to be and (3) on 2004 Aug 27.98 and 2004 Aug 28.97 respectively. Assuming a power law decay (), the decay index is constrained to be (3). We caution that this value is computed from just two measurements, and may be influenced by local deviations from the regular decay and/or measurement errors. This limit is consistent with the X-ray decay index.
A spectrum of the host galaxy was acquired with FORS 1, starting on 2004 Aug 30.00 (2 hours exposure with the grism 300V). The observing conditions were not good, since the object was visible only at relatively large airmass () and with full (100%) Moon. The object was marginally detected in the range Å, characterized by a very weak continuum with no distinguishable features. Therefore, no redshift determination was possible. The 2- upper limit for any emission line is erg cm-2 s-1.
Costraints on the distance of the galaxy can be put using the photometric information. With just two colors, photometric redshift techniques are not very effective. The algorithm developed by Fernández-Soto at al. (1999) yields just loose constraints , with an additional permitted range (where the fit is worse).
However, we can use the apparent luminosity to get a rough estimate of the distance. To this extent, we have choosen several catalogs of galaxies providing for each object both the photometry and the redshift. From these data, we computed the redshift distribution of the sources which have a magnitude comparable to that of the host galaxy of GRB 040827. Data were collected from the VIMOS VLT deep survey (VVDS; Le Fèvre et al., 2004), the Hubble deep field (Fernández-Soto at al., 1999), the FORS deep field (Heidt et al., 2003; Noll et al., 2004) and the Caltech faint galaxy redshift survey (Cohen et al., 2000). We found that in the band the distribution is quite broad (peaking at ), and it doesn’t allow to put significant contraints. Tighter limits can be set by looking at the -band apparent luminosity; the distribution of 127 galaxies from the VVDS within 0.15 mag from the GRB host is well represented by a Gaussian centered at with a dispersion of . The VVDS is particularly suited for this kind of work, since it has a high completeness in redshift determination, and because it succesfully crosses the so-called redshift desert (Le Fèvre et al., 2004), where redshift determination is difficult due to the lack of clear features. Thus, based on a statistical analysis, we may put a 3 upper limit . The same procedure in the band provides an even narrower range (), however based on a smaller sample. We caution that our object, since it hosted a GRB, may not be a typical galaxy, therefore our indicator may be biased. It is anyway reassuring that the estimate from both the and bands are consistent. Thus, the different indications coming from both optical and X-ray data favor a redshift not far from unity. This is consistent with the redshift distribution of GRBs (e.g. Bloom et al., 2003).
Within the photometric errors, no late-time rebrightening is apparent in our data. However, even a bright supernova like SN 2003lw (Malesani et al., 2004b) peaked at (at ), which would translate to at (the observed band roughly corresponds to the at this redshift). Such a SN would be times fainter than the host galaxy, hence quite difficult to detect.
5 Discussion
XMM-Newton/EPIC data show unambiguously that the spectrum of the X-ray afterglow is affected by an absorption significantly higher than the Galactic value.
As shown in Sect. 3, assuming solar system abundances, the redshifted absorber model allows to estimate that at 90% confidence the local column density in the GRB host is higher than cm-2 and its redshift is larger than 0.5. Furthermore, optical photometry (Sect. 4) allow to estimate that the host redshift is likely lower than 1.7. When such constraint is used, it is possible to limit the allowed interval for the intrinsic to the range () cm-2.
We investigated the possible presence of optical extinction in the host, coupled to the observed large X-ray absorption. First, we computed the spectral energy distribution of the afterglow, taking advantage of our almost simultaneous VLT and XMM observations. The observed band flux falls about two orders of magnitude below the extrapolation of the X-ray power law. Then, we followed the approach of Price et al. (2002) in order to get constraints on the expected spectral shape. To calculate the “Closure” relations, we assumed the single power law decay described in Sect.3. The NIR decay is loosely constrained and is compatible with the X-ray one. The observed properties of the afterglow are consistent with an isotropic fireball expansion both into an homogeneous medium, as well as into a stellar wind density profile environment (see Table 3 and its caption for further details).
| Model | Closure () | Closure () |
|---|---|---|
| ISM | -0.040.18 | -0.540.18 |
| Wind | -0.040.18 | -1.040.18 |
| Jet | -1.190.22 | -2.190.22 |
Both cases require the electron cooling frequency to be lower than the X-ray range (namely, Hz), a constraint which may be easily fulfilled at the time of the X-ray observation. Incidentally, we note that such results agree with the “typical” X-ray afterglow behaviour derived by Piro (2004) from 36 BeppoSAX follow-up observations of GRBs. The possible presence of a spectral break between the X-rays and the band (if ) does not allow to conclude that the optical flux is affected by a high extinction; of course, such a possibility may not be ruled out, since could be lower than the NIR range. Both pictures can be easily accomodated within the constraints on the host redshift () and gas column density (0.6-2.6 cm-2), using standard extinction curves (Cardelli et al., 1989), both assuming the Galactic gas-to-dust mass ratio (Predehl & Schmitt, 1995) and assuming different gas/dust properties in the host (implying an extinction up to 10 times lower, as suggested by several studies, e.g. Galama & Wijers, 2001; Hjorth et al., 2003; Stratta et al., 2004).
X-ray absorption in excess wrt. the Galactic one has been already reported for a handful of GRB afterglows. Thus, to put our results in the right context, it is useful to review here the results on X-ray absorption in GRB afterglows (observed a few hours after the burst) obtained so far by BeppoSAX, Chandra and XMM-Newton. Stratta et al. (2004) present a systematic analysis of a sample of 13 bright afterglows observed with BeppoSAX narrow field instruments (within 5-20 hours from the prompt); a significant (99.9% confidence) detection of additional NH was found only in two cases (namely, GRB 990123 and GRB 010222), but, owing to the limited photon statistics, it could not be excluded that intrinsic X-ray absorption be present also in the other bursts. Chandra observations of GRB afterglows (starting, on average, day after the GRB), did not yield so far useful constraints on the presence of intrinsic X-ray absorption, apart from a marginal detection for GRB 020405 (see Stratta et al., 2004, and references therein).

To date, XMM-Newton has observed 9 GRB afterglows (including GRB 040827) within a few hours () from the burst333We exclude here the bright afterglow of GRB 030329, since it could be observed only two months after the burst (Tiengo et al., 2003), owing to satellite pointing constraints.. A detailed summary of XMM-Newton results is reported in Table 4 as well as in Fig. 5. Extra absorption has been found in 4 cases, namely GRB 020322, GRB 030227, GRB 040223 and GRB 040827 (the best case in such sample - note Fig. 5). On the contrary, absorption consistent with the Galactic one was observed for GRB 001025, GRB 010220, GRB 011211, GRB 031203 and GRB 040106 (the brightest afterglow observed by XMM-Newton so far).
| Absorbed afterglows | |||||
|---|---|---|---|---|---|
| GRB | Galactic | Observed | z range (method) | (z) | Reference |
| 020322 | 4.6 | (2.10.3) | 0.7-2.8 (abs) | 1.3 (1.8) | a |
| 030227 | 1.8 | (3.60.3) | 2.5-4.5 (abs) | 6.8 (3.9) | b |
| “ | “ | “ | 1.33-1.42 (lin) | 3.5 (1.39) | c |
| 040223 | 6.0 | (1.80.2) | … | 7 (1) | d |
| 040827 | 8 | (3.70.2) | 0.5-1.7 (abs,opt) | 1.0 (1) | this work |
| Unabsorbed afterglows | |||||
| GRB | Galactic | Observed | z range (method) | Reference | |
| 001025 | 6 | = | 0.50-0.55 (lin) | e | |
| 010220 | 8.6 | = | 0.97-1.07 (lin) | e | |
| 011211 | 4.2 | = | 2.14 (opt) | f | |
| 031203 | 5.9 | (8.80.5) | 0.105 (opt) | g,h | |
| 040106 | 8.6 | (8.80.8) | … | i | |
No firm conclusions about the presence of significant, intrinsic optical extinction may be drawn for the X-ray “absorbed” afterglows. The case of GRB 020322 (Watson et al., 2002a; Gendre et al., 2005) is very similar to GRB 040827. The lack of an optical afterglow for GRB 040223 (Simoncelli et al., 2004) could also be explained by intrinsic optical extinction within the same hypotheses (Gendre et al., 2005), although a large foreground extinction is possibly playing an important role for such burst, owing to its location, close to the Galactic plane. A complete optical dataset is available only for GRB 030227, including multicolor, multi-epoch photometry of the afterglow. Interestingly, in such case Castro-Tirado et al. (2003) found “not feasible” to connect the X-ray and optical flux distributions within the frame of standard afterglow models, even considering different extinction laws in the host; therefore, they invoke different emission mechanisms at optical and X-ray wavelengths.
In the X-ray “unabsorbed” sample, GRB 011221 (Jakobsson et al., 2003) and GRB 040106 (Gendre et al., 2004; Moran et al., 2005) show very little or no optical extinction. The case of GRB 031203 is more problematic: significant extinction is observed (Prochaska et al., 2004), although it is hard to discriminate the Galactic and host contributions. Moreover, Malesani et al. (2004b) show that the optical and the X-ray emission of the afterglow may have a different origin. No optical emission was detected for the cases of GRB 001025 (for which the trigger was not promptly communicated; Smith et al., 2000) and GRB 010220 (also lying towards the Galactic plane).
Thus, X-ray data provide now conclusive evidence that several GRBs do occur behind a large gas column density in their host galaxy. If long GRBs are associated to the death of massive stars, indications of a large intrinsic NH absorbing the X-ray afterglows’ emission would imply that their progenitors are located within dense environments in their host galaxies, most probably star-forming regions (see e.g. Owens et al., 1998; Galama & Wijers, 2001). In the same scenario, the possible low extinction and reddening for the optical afterglows could be explained invoking dust destruction by the early radiation of the GRB itself, implying that the bulk of the absorbing gas is confined in a compact cloud (10-30 pc) surrounding the GRB progenitor, as suggested by previous studies (see e.g. Galama & Wijers, 2001). Indeed, the gas column densities reported in Table 4 are fully consistent with values observed for inner, overdense regions of giant molecular clouds in our galaxy (see e.g. Lazzati & Perna, 2002, and references therein), where star formation is supposed to take place. The rather shallow constraints on the optical extinction are generally consistent with such a picture.
On the other hand, very little may be concluded about the sample of X-ray “unabsorbed” afterglows. Lack of statistics in their X-ray spectra coupled to the uncertainty on the expected Galactic absorption, together with the uncertainty affecting the host redshift (based in two cases on highly debated detections of X-ray emission lines) leave room for at least a few 1021 cm-2 of gas column density in their host galaxies. Moreover, such GRBs do not have any peculiar aspect of their phenomenology clearly distinguishing them wrt. the “absorbed” sample. Thus, apparently there are no reasons to invoke a different origin for the “unabsorbed” GRBs.
Alternatively, the intrinsic X-ray absorption could be mainly related to the large scale gas distribution in the GRB host. In this case, the X-ray phenomenology of the afterglow would depend on the location of the progenitor within the galaxy, on the structure of the host galaxy and on its orientation wrt. the observer, making it easier to account both for absorbed as well as unabsorbed afterglows. Under this hypothesis the low optical extinction and reddening could be explained by different dust-to-gas mass ratios and/or low metallicities in the GRB hosts wrt. our Galaxy (as suggested by different investigations, e.g. Hjorth et al., 2003; Stratta et al., 2004).
We note that the problem of inferring properties of the inner GRB environment from the afterglow’s absorption may be further complicated by the effects of photo-ionization by the GRB radiation itself (Lazzati & Perna, 2002); some evidence for such a process has been obtained from prompt soft X-ray observations with BeppoSAX (e.g. Frontera et al., 2004, and references therein).
6 Conclusions
Afterglow emission from GRB 040827 has been studied with XMM-Newton and with the VLT.
The observed spectral and temporal properties, when considered in the framework of different fireball models, are consistent with isotropic expansion into an homogeneous medium, or into a stellar-wind density profile environment. This is a somewhat typical behaviour for X-ray afterglows.
On the other hand, an outstanding peculiarity of GRB 040827 is the presence of very high intrinsic X-ray absorption, the best case observed so far, which may be attributed to a gas column density of (0.4-2.6) in the host galaxy, likely located at . Intrinsic absorption is possibly not an ubiquitous property of GRB X-ray afterglows, since it affects 50% of the XMM-Newton afterglow observations. The presence of high optical extinction accompanying the observed X-ray absorption cannot be firmly proved, neither for GRB 040827 nor for other X-ray absorbed afterglows.
Current X-ray observations do not allow to understand the nature of the ambient medium surrounding GRB progenitors. A major step forward could come only from a study of the evolution of the X-ray absorption (coupled to optical extinction) in the prompt emission and in the very early phases of the afterglow for a relatively large sample of events. This is now possible with the Swift satellite (Gehrels et al., 2004), thanks to its unprecedented capabilities of re-pointing its X-ray and optical telescopes in a few tens of seconds.
Acknowledgements.
The XMM-Newton data analysis is supported by the Italian Space Agency (ASI). ADL acknowledges an ASI fellowship.References
- Balucinska-Church & McCammon (1992) Balucinska-Church M. & McCammon, D., 1992, ApJ 400, 699
- Bloom et al. (2001) Bloom, J.S., Djorgowski, S.G., Kulkarni, S.R., 2001, ApJ 554, 678
- Bloom et al. (2003) Bloom, J.S., Frail, D.A., Kulkarni, S.R., 2003, ApJ 594, 674
- Cardelli et al. (1989) Cardelli, J.A., Clayton, G.C., Mathis, J.S., 1989, A&A 345, 245
- Castro-Tirado et al. (2003) Castro-Tirado, A.J., Gorosabel, J., Guziy, S., et al., 2003, A&A 411, L315
- Chevalier & Li (1999) Chevalier, R.A. & Li, Z.-Y., 1999, ApJ 520, L29
- Cohen et al. (2000) Cohen, J.G., Hogg, D.W., Blandford, R., Cowie, L.L., Hu, E., et al., 2000, ApJ 538, 29
- De Luca et al. (2004) De Luca A., Götz D., Campana S. 2004, GCN 2698
- Dickey & Lockman (1990) Dickey, J.M. & Lockman, F.J., 1990, ARA&A 28, 215
- Fernández-Soto at al. (1999) Fernández-Soto, A., Lanzetta, K.M., Yahil, A., 1999, ApJ 513, 34
- Frontera et al. (2004) Frontera, F., Amati, L., Lazzati, D., et al., 2004, ApJ 614, 301
- Fynbo et al. (2003) Fynbo, J.P.U., Jakobsson, P., Möller, P., Hjorth, J., Thomsen, B., et al. 2003, A&A406, L63
- Galama & Wijers (2001) Galama, T.J. & Wijers, R.A.M.J., 2001, ApJ 549, L209
- Gehrels et al. (2004) Gehrels, N., Chincarini, G., Giommi, P., et al., 2004, ApJ 611, 1005
- Gendre et al. (2004) Gendre, B., Piro, L., De Pasquale, M., 2004, A&A 424, L27
- Gendre et al. (2005) Gendre, B., Piro, L., De Pasquale, M., 2005, Adv.Sp.Res. in press, astro-ph/0412302
- Gladders & Berger (2004) Gladders M. & Berger E. 2004, GCN 2681
- Götz & Mereghetti (2004) Götz D., Mereghetti S. 2004, GCN 2671
- Heidt et al. (2003) Heidt, J., Appenzeller, I., Gabasch, A., Jäger, K., Seitz, S. et al., 2003, A&A 398, 49
- Hjorth et al. (2003) Hjorth, J., Moller, P., Gorosabel, J., et al., 2003, ApJ 597, 699
- Hurley et al. (2003) Hurley, K., Sari, R, Djorgowski, S.G., 2003, in “Compact Stellar X-ray Sources”, Cambridge University Press, astro-ph/0211620
- Jakobsson et al. (2003) Jakobsson, P., Hjorth, J., Fynbo, J.P.U., et al., 2003, A&A 408, 941
- Kaplan & Berger (2004) Kaplan D.L., Berger E. 2004, GCN 2683
- Kirsch (2004) Kirsch, M. (on behalf of the calibration team), EPIC status of calibration and data analysis, Document XMM-SOC-CAL-TN-0018-2-3, XMM Science Operation Centre, Villafranca del Castillo, 2004, available at http://xmm.vilspa.esa.es/docs/documents/CAL-TN-0018-2-3.pdf
- Krautter et al. (1999) Krautter, J., Zickgraf, F.-J., Appenzeller, I., et al., 1999, A&A 350, 743
- Lazzati & Perna (2002) Lazzati, D. & Perna, R., 2002, MNRAS 330, 383
- Le Fèvre et al. (2004) Le Fèvre, O., Vettolani, G., Paltani, et al., 2004, A&A 428, 1043
- Malesani et al. (2004a) Malesani D., D’Avanzo P., Melandri A. et al. 2004, GCN 2685
- Malesani et al. (2004b) Malesani D., Tagliaferri, G., Chincarini, G., et al., 2004, ApJ 609, L5
- Mereghetti et al. (2003a) Mereghetti, S., Götz, D., Tiengo, A., et al., 2003, ApJ 590, L73
- Mereghetti et al. (2003b) Mereghetti, S., Götz, D., Beckmann, V., et al., 2003, A&A 411, L291
- Mereghetti et al. (2004a) Mereghetti S., Götz D., Beck M. et al. 2004a, GCN 2670
- Mereghetti et al. (2004b) Mereghetti S., Götz D., Beck M. et al. 2004b, GCN 2672
- Moran et al. (2005) Moran, L., Mereghetti, S., Götz, D., et al., 2005, A&A in press, astro-ph/0411565
- Noll et al. (2004) Noll, S., Mehlert, D., Appenzeller, I., Bender, R., Böhm, A., et al., 2004, A&A, 418, 885
- Owens et al. (1998) Owens, A., Guainazzi, M., Oosterbroek, T., et al., 1998, A&A 339, L37
- Piran (2004) Piran, T., 2004, accepted for publication in Reviews of Modern Physics, astro-ph/0405503
- Piro (2004) Piro, L., 2004, in “Gamma-Ray Bursts in the Afterglow Era”, ASP Vol.312, in press, astro-ph/0402638
- Predehl & Schmitt (1995) Predehl, P. & Schmitt, J.H.M.M., 1995, A&A 293, 889
- Price et al. (2002) Price, P.A., Berger, E., Reichart, D.E., et al., 2002, ApJ 572, L51
- Prochaska et al. (2004) Prochaska, J.X., Bloom, J.S., Chen, H.-W., et al., 2004, ApJ 611, 200
- Read (2004) Read, A. 2004, Document XMM-SOC-CAL-SRN-167, available from http://xmm.vilspa.esa.es/docs/documents/
- Reeves et al. (2002) Reeves, J.N., Osborne, J.P., Watson, D., et al., 2002, Nature 416, 512
- Rodriguez-Pascual & Gonzalez-Riestra (2004) Rodriguez-Pascual P., Gonzalez-Riestra R., GCN 2688
- Rodriguez-Pascual & Juarez (2004) Rodriguez-Pascual P., Juarez B. 2004, GCN 2678
- Sari et al. (1998) Sari, R., Piran, T., Narayan, R., 1998, ApJ 497, L17
- Sari et al. (1999) Sari, R., Piran, T., Halpern, J., 1999, ApJ 519, L17
- Schartel (2004) Schartel, N., 2004, GCN 2700
- Schlegel et al. (1998) Schlegel E.M., Finkbeiner, D.P., Davis, M., 1998, ApJ 500, 525
- Simoncelli et al. (2004) Simoncelli, A., D’Avanzo, P., Campana, S., et al., 2004, GCN 2549
- Smith et al. (2000) Smith, D.A., Levine, A.M., Remillard, R., Hurley, K., Cline, T., 2000, GCN 861
- Soderberg & Frail (2004) Soderberg, A, Frail, D., 2004, GCN 2689
- Stetson (1987) Stetson, P.B., 1987, PASP 99, 191
- Stratta et al. (2004) Stratta, G., Fiore, F., Antonelli, L.A., Piro, L., De Pasquale, M., 2004, ApJ 608, 846
- Strüder et al. (2001) Strüder, L., Briel, U., Dennerl, K., et al., 2001, A&A 365, L18
- Tanvir et al. (2004a) Tanvir N., Priddey R., Hughes M. et al. 2004a, GCN 2682
- Tanvir et al. (2004b) Tanvir N., Priddey R., Levan A. et al. 2004b, GCN 2684
- Tiengo et al. (2003) Tiengo, A., Mereghetti, S., Ghisellini, G. et al., 2003, A&A 409, 983
- Tiengo et al. (2004) Tiengo, A., Mereghetti, S., De Luca, A., 2004, GCN 2548
- Turner et al. (2001) Turner, M.J.L., Abbey, A., Arnaud, M., et al., 2001, A&A 365, L27
- van Paradijs et al. (2000) van Paradijs, J., Kouveliotou, C., Wijers, R.A.M.J., 2000, ARA&A, 38, 379
- Watson et al. (2002a) Watson, D., Reeves, J.N., Osborne, J.P., et al., 2002a, A&A 395, L41
- Watson et al. (2002b) Watson, D., Reeves, J.N., Osborne, J.P., et al., 2002b, A&A 393, L1
- Watson et al. (2003) Watson, D., Reeves, J.N., Hjorth, J., et al., 2003, ApJ 595, L29
- Watson et al. (2004) Watson, D., Hjorth, J., Levan, A., et al., 2004, ApJ 605, L101