email:[voss;gilfanov]@mpa-garching.mpg.de
The Luminosity Function of X-ray point sources in Centaurus A
We have studied the X-ray point source population of Centaurus A (NGC 5128) using data from four archival CHANDRA observations. We detected 272 point-like X-ray sources within a radius of 10 from the centre. Approximately half of these are CXB sources, with the remaining half being LMXBs. The spatial distribution of the LMXBs, both azimuthally averaged and 2-D, is consistent with the distribution of the K-band light observed in the 2MASS survey. After correction for the incompleteness effect we constrain the LMXB luminosity function down to erg s-1, much lower than previous studies of LMXBs in elliptical galaxies. The obtained XLF flattens significantly below erg s-1 and follows the law in agreement with the behaviour found earlier for LMXBs in the Milky Way and in the bulge of M31.
alaxies: individual: Centaurus A, NGC 5128 – X-rays: binaries – X-rays: galaxies
Key Words.:
g1 introduction
CHANDRA observations of the bright end, , of X-ray point source populations in nearby elliptical galaxies found a rather steep luminosity distribution with a differential power law index in the range (e.g. Colbert et al. 2004; Kim & Fabbiano 2004). This is noticably steeper than X-ray luminosity function (XLF) slopes in spiral and starburst galaxies, (Grimm et al. 2003). This difference reflects the difference in the composition of the X-ray populations in the early and late type galaxies, dominated by low- and high-mass X-ray binaries, respectively. Extension of the luminosity range available for the study down to revealed a much more complex shape of the XLF of low-mass X-ray binaries (LMXBs). It has been shown to flatten considerably at the faint end and to follow the power law below (Gilfanov 2004). Motivated by observational results, Bildsten & Deloye (2004) and Postnov & Kuranov (2005) suggested that the slope of the LMXB XLF in different luminosity regimes is defined by predominantly different sub-types of low-mass X-ray binaries. In the sample of Gilfanov (2004) the faint end of the LMXB XLF was represented by the bulges of two spiral galaxies only – the Milky Way and M31. On the other hand, the X-ray binaries in elliptical galaxies and spiral bulges could be formed by different mechanisms and have different evolution histories and, consequently, different luminosity distributions. It is therefore important to complement theoretical advances in understanding the XLF of X-ray binaries with firm observational constraints on its behaviour based on a broad range of galactic types, especially at the low luminosity end.
Centaurus A (Cen A) is candidate for such a study. It is massive enough to contain a sufficient number of LMXBs and, on the other hand, is sufficiently nearby to reach luminosities below erg s-1 with moderate observing times. It has been widely studied in X-rays, and it has been observed 10 times with CHANDRA. These observations have been used to obtain information about the nucleus (Evans et al. 2004), the interstellar medium (Kraft et al. 2003), the jet (Kraft et al. 2002; Hardcastle et al. 2003) the shell structures (Karovska et al. 2002) and the off-centre point source population (Kraft et al. 2001). The objective of the present study is the population of LMXBs in Cen A, namely their spatial and luminosity distribution. Studying the latter, we will focus specifically on the low luminosity domain, , whose importance has been emphasized above. Combining 4 observations and accurate incompleteness correction enabled us to investigate sources with luminosity by a factor of lower than in previous studies.
Cen A has a strongly warped dust disc with evidence for star formation, and optical images show a system of filaments and shells. This is probably due to a recent merger (Schiminovich et al. 1994). It is the nearest active galaxy and is considered to be the prototypical Faranoff-Riley class I radio galaxy. It has a very compact nucleus, most likely an accreting massive black hole, with strongly varying intensity. Emanating from this nucleus are milliarcsecond radio jets and a subrelativistic radio/X-ray jet extend 6 towards NE of the nucleus. Radio lobes extending NE and SW are seen. An exhaustive review of Cen A can be found in Israel (1998).
| Obs-ID | Date | Instrument | Exp. Time | R.A. | Dec. | Data Mode |
|---|---|---|---|---|---|---|
| 0316 | 1999 Dec 05 | ACIS-I | 36.18 ks | 13 25 27.61 | 43 01 08.90 | FAINT |
| 0962 | 2000 May 17 | ACIS-I | 36.97 ks | 13 25 27.61 | 43 01 08.90 | FAINT |
| 2987 | 2002 Sep 03 | ACIS-S | 45.18 ks | 13 25 28.69 | 43 00 59.70 | FAINT |
| 3965 | 2003 Sep 14 | ACIS-S | 50.17 ks | 13 25 28.70 | 43 00 59.70 | FAINT |
The paper is structured as follows. In Sect. 2 we describe the data sets and the basic data preparation and analysis. The source list cleaning procedures are presented in Sect. 3, together with source identifications. In this section we also deal with possible periodic variability of the most luminous sources. The properties of the population of X-ray binaries, as well as the background X-ray sources are analysed and compared with previous studies in Sect. 4, including the spatial distribution of the sources and their luminosity function. Sect. 5 gives the conclusions. We adopt a distance of 3.5 Mpc to Cen A, and that (R.A.,Dec.) = (13 25 27.6, -43 01 08.8) is the centre of the galaxy.
2 Data analysis
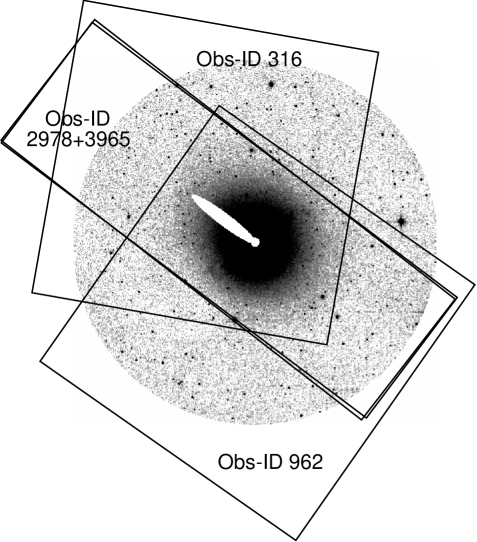
The analysis in this paper is based on four CHANDRA observations, two of them made with the ACIS-I array (OBS-ID 316 and 962), and the other two with the ACIS-S array (OBS-ID 2978 and 3965). Information about the observations is listed in Table 1; their fields of view overlaid on the K-band image of the galaxy are shown in Fig.1.
Together these four observations cover most of Cen A within a 10 radius from the centre. The data preparation was done following the standard CIAO111http://cxc.harvard.edu/ciao/ threads (CIAO version 3.1; CALDB version 2.28), and limiting the energy range to 0.5-8.0 keV. The ACIS chips sometimes experience flares of enhanced background. For point source detection and luminosity estimation it is not necessary to filter out weak flares, since the increased exposure time outweighs the increased background. We did not find any flares strong enough to filter them out.
We used CIAO wavdetect to detect sources. This program is the most widely used for point source detection in CHANDRA data. Some of the parameters we have changed from the default values. Most important are the scales. We have used the -series from 1.0 to 8.0. This gives a wide enough range of source sizes to account for the variation in point spread function (PSF) from the inner parts of Cen A to the parts 10 from the centre as well as enough middle scales. We also used maxiter=10, iterstop=0.00001 and bkgsigthresh=0.0001. The effect of changing these parameters is that more iterations are done in the process of removing sources when creating backgound files, at the expense of computing time. Finally we set the parameter eenergy=0.8 (the encircled fraction of source energy used for source parameter estimation), which gives larger areas for source parameter estimation at the risk of source merging, see Sect. 3.
First we detected sources in the inner region of Cen A covered by all four observations. From these sources we then chose 40 that are bright enough to have the positions determined precisely and that existed in all four observations. We used these sources to determine the average positions of the sources and the offsets for the individual observations. The statistical uncertainties of the source positions are typically 0.30.5 pixel. Assuming that the errors are uncorrelated gives an uncertainty of 0.05 pixel in the calculated offsets of the observations. Using CIAO dmtcalc we then corrected the aspect and events file for each observation. The corrections applied are listed in Table 2. This step was performed in order to make the observations aligned for combination, not to get better absolute astrometry, which will be dealt with in Sect. 3.
| Obs-ID | Correction West | Correction North |
|---|---|---|
| 0316 | 0.73 pixel∗ | 0.42 pixel |
| 0962 | 1.58 pixel | 1.44 pixel |
| 2978 | 0.53 pixel | 0.18 pixel |
| 3965 | 0.31 pixel | 0.85 pixel |
∗1 pixel is 0.492
We used CIAO reproject_events to reproject observations 316, 962 and 2978 into the sky coordinates of observation 3965. The files were then merged and the wavdetect task was applied again to the combined image. The output count rate for each detected source is calculated inside a source cell and the local background is subtracted. For each source we extracted the PSF using CIAO psfextract task and calculated the percentage of the counts expected to lie inside each source cell. This was done for each of the four observations, and the result was averaged using the values of the exposure maps as weights. For most sources this percentage is above 97 per cent, and only four sources have values lower than 70 per cent. An exposure map was created for each of the observations, assuming the energy distribution to be a powerlaw with photon index of 1.7 and Galactic absorption of 8.4cm-2 (Dickey & Lockman 1990). We assumed the same spectrum to convert the observed count rates to unabsorbed source luminosities.
In the very inner parts of Cen A there is strong X-ray emission from hot gas and the central AGN. At the same time there is a large number of point sources within a small area making crowding a serious problem. We have therefore excluded the area within a radius of 30 pixels () from the centre of the galaxy.
Simulations using the observed source distribution as input show that excluding this inner region limits crowding to less than 4% of the sources (sec. A.1). Also the part of the galaxy dominated by the X-ray jet has been excluded. The excluded regions are evident from Fig.1.
In each of the four observations, readout streaks caused by the bright central region of Cen A are seen. As in different observations they cover different regions of the image, for each streak we have searched for sources and estimated their parameters using a combined image of the observations, excluding the one containing this streak.
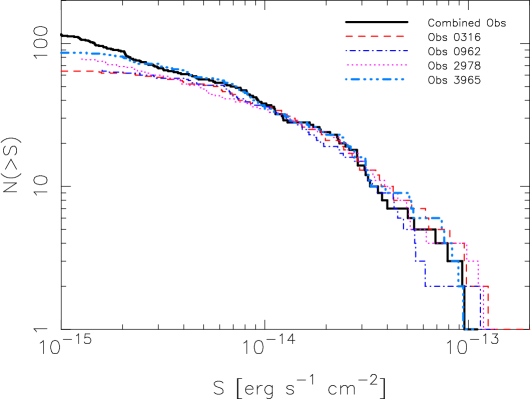
To check for differences between the four observations and between the individual observations and the combined observation, we have created the cumulative point source luminosity function for each, taking only sources from the central region, where all four observations overlap, see Fig. 1. The results can be found in Fig. 2. A large fraction of the sources are variable. For these sources, using the luminosities estimated from the combined image is equal to using the average luminosities. We used the Kolmogorov–Smirnov (KS)-test to compare the distribution obtained in the individual observations with that based on the combined data. To minimize incompleteness effects only sources with fluxes higher than 3 erg s-1 cm-2 were used. The lowest probability found was 68 per cent (for Obs-ID 316). This confirms that the source variability does not modify the flux distribution of the point sources in a galaxy like Cen A at a detectable level.
3 The source list
Several effects can compromise the source list generated from CIAO wavdetect. This includes extended sources and false sources due to background fluctuations. The background due to the diffuse emission is high, especially in the inner parts of Cen A, and many structures can be seen in the image. The “bubble” 5 south-west of the centre is an example (Kraft et al. 2003). Some of these structures might be misinterpreted as point sources. We have visually inspected the images and for each source compared the photon distribution with the distribution expected from the PSF. As a result we rejected 18 sources. As indicated by the shapes, none of the rejected sources is likely to be a supernova remnant. Some of the rejected sources are filamentary structures in the diffuse component and the rest are caused by local variations in the emission of the diffuse component. The characteristic length scale of the latter is 100 pc. Due to the low luminosity of the rejected sources, it is not possible to classify them according to their spectra.
Another potential problem could be merging of sources. We have used a high value (80 per cent) of the enclosed percentage of PSF in CIAO wavdetect because it gives a good estimation of source parameters. On the other hand, such a high value in some cases leads to two sources being detected as one source. To check for this, we ran CIAO wavdetect again with smaller enclosed percentages of the PSF. We find no sources that are merged because of the high enclosed percentage of the PSF.
After the filtering, the final list of X-ray sources contains 272 objects. It is presented in Table A.1. Kraft et al. (2001) analysed the two ACIS-I observations of Cen A (Table 1) and detected 246 X-ray sources. Of these, 205 sources are located within of the center of the galaxy analysed here. 184 of these sources are in our source list, which therefore contains 90 previously undetected sources. The increase in the total number of detected sources is due to a factor of increase in the exposure time of the main body of the galaxy (Fig.1, Table 1).
3.1 Background and foreground sources
A fraction of the detected sources are foreground or background objects. Some (but not all) of them can be identified using either their X-ray spectra, or from observations at other wavelengths. Since this paper concerns the statistical properties of the X-ray point source population, we have adopted the following strategy. We exclude foreground sources as much as possible (6 such sources are excluded, see Sect. 3.2), but do not attempt to remove background sources, which are by far the most significantly contaminating factor (about half of the detected sources are background sources, see Sect. 4.3). Their contribution to the surface brightness and luminosity distributions is instead taken into account in the statistical sense, based on the results of the cosmic X-ray background (CXB) source counts.
3.2 Optical identifications
We check the absolute astrometry using USNO-B1.0 (Monet et al. 2003) and GSC 2.2 (Morrison et al. 2001) catalogues. We find that for a search radius of 2.0 the rms deviation of the positions is 1.1. This is comparable to the quoted positional uncertainties of the optical catalogues as well as that of the Chandra X-ray source list, confirming reasonable astrometric accuracy of the latter. Adding a systematic shift of 0.5 in any direction results in larger rms deviations. The number of matches is significantly higher than the expected number of chance coincidences. For the search radius of 2.0 the expectation value is with 37 matches found for USNO-B1.0 and with 18 matches found for GSC 2.2.
For the actual identification of Chandra sources we used the results of the dedicated optical studies of the Cen A region by Peng et al. (2004), Minniti et al. (2003) and Woodley et al. (2005). Although the former three surveys were aimed specifically at globular cluster population of Cen A they also have identified a number of foreground stars, Hα emittors and several AGNs. We also used results of Graham & Fasset (2002). In total we identified 6 X-ray sources as foreground stars, leaving 266 sources of presumably extragalactic origin – either intrinsic Cen A sources or background AGNs. Of these, 37 were identified with the globular clusters in Cen A. The results of this work are presented in column 8 of Table A.1.
About of the USNO and GSC matches were found to be globular clusters or likely globular clusters in Peng et al. (2004) and Minniti et al. (2003). The remaining 12 out of 37 sources do not appear in these papers. This is close to but slightly higher than the number of 8 random matches expected for the value of the search radius used in the analysis. Some of these sources also might be background AGNs or undetected globular clusters. Therefore we kept them all in the sample. We note that excluding them from the following analysis does not change our results in any significant way.
3.3 H-sources

Eight sources within 4 from the centre of Cen A coincide with H-emitting regions found in Minniti et al. (2003). All of them are located in the dust lanes region, have X-ray luminosities in the erg s-1 range and can potentially be associated with high-mass X-ray binaries. The optical magnitudes of the H sources indicate that they may be young star clusters as well as individual X-ray binaries. In order to search for further indications of the high-mass X-ray binary (HMXB) nature of these sources we have compared their spectral properties with other sources and searched for periodic variability in their X-ray emission. As discussed in more detail below, no coherent pulsations were detected from any of the bright X-ray sources, although the upper limits are at a rather moderate level of per cent pulsed fraction.
The accreting X-ray pulsars, constituting the vast majority of the neutron star HMXBs, are known to have notably harder spectra in the 1–20 keV energy range than LMXBs and often show significant intrinsic absorption. Therefore comparison of the spectral properties of the H objects with other X-ray sources (which in the central part of Cen A are mostly LMXBs, Sect. 4) can help to clarify the nature of the former. However, the X-ray colour-colour diagram of the sources within 5 from the centre of Cen A, shown in Fig 3, does not reveal systematic differences between H and other sources, nor have we found any systematic differences from the direct spectral fits of the brightest sources.
Comparing Fig 3 with Fig. 4 of Prestwich et al. (2003) and noting the slight difference in energy bands, it can be seen that the main part of our sources is located in the region corresponding to LMXBs. There is a small population of harder sources, of which two are H objects and also a few softer sources. From their position in the diagram, they could be HMXBs and thermal supernova remnants, respectively. Such identifications are not possible with to the colours alone for two reasons. One is that the absorption inside Cen A varies strongly with position, which has the effect of enhancing the scatter of LMXBs in the diagram. The second reason is that there is a contribution of CXB sources. This population is known to consist of two subpopulations, a hard and a soft one. These populations would be expected to coincide with the HMXBs and the supernova remnants, respectively, in the diagram.
As our results were not conclusive enough, we decided to keep the H sources in the sample, bearing in mind that their nature still needs to be clarified. Due to their relatively small number they do not significantly affect the following analysis of the spatial and luminosity distributions.
3.4 Globular cluster sources
37 X-ray sources coincide with known globular clusters. Interpreting this number, one should take into account that only per cent of the expected number of globular clusters in Cen A have been identified (Woodley et al. 2005). The identified sample is strongly biased, both with respect to the spatial distribution of the clusters and their luminosity distribution. Furthermore, the detection of the globular clusters is not independent of the X-ray observations, as X-ray source catalogues have been used to search for globular clusters (e.g. Minniti et al. 2003). It is therefore not possible to perform a rigorous comparison of the luminosity function and spatial distribution of the globular cluster X-ray sources with the sources residing outside globular clusters. Considering the sources brighter than erg s-1 (i.e. unaffected by incompleteness effects) there are 15 known globular cluster X-ray sources, whereas the number of sources outside globular clusters is 40. If the expected number of 22 CXB sources (see Sect. 4.3) is subtracted, we find 18 ’field’ LMXBs outside (or in undetected) globular clusters. Above this luminosity the XLF of globular cluster sources is similar to that of the field LMXBs. Below this luminosity the field LMXB XLF is much steeper than that of globular cluster sources. This can easily be caused by incompleteness effects, which cannot be correcetd for without knowledge of the spatial distribution of the globular cluster sources (see Appendix). We also note that in the outer region there are 7 globular cluster sources, with L erg s-1 whereas we expect 9 LMXBs in total (see Sect. 4.1.1).
3.5 Search for coherent pulsations
We searched for periodic variability in the light curves of the sources with more than 400 detected source counts and more luminous than 6.0 erg s-1 (24 sources in total). Each CHANDRA observation was tested separately. Events were extracted from the 4 sigma source ellipses in wrecon and the light curves with sec time resolution were produced. The power spectra were calculated using the STARLINK222http://www.starlink.ac.uk task period. Pulsations were searched for in the range of trial periods from s, defined by the Nyquist frequency of the Chandra time series, to s. Except 3 sources showing variability due to the telescope dithering carrying them over the detector edge, in only one did the power exceeded the level corresponding to 99 per cent confidence. The period of 55.8 s was found for the source #135 (Table A.1) in Obs 2978 and had a significance of 99.4 per cent. This significance takes into account the number of trial periods in one power spectrum but not the number of power spectra analyzed (74). In the other 3 observations of the source the power density spectrum did not show any signs of pulsations at this period. Given the total number of power spectra investigated it is likely that this detection is a result of a statistical fluctuation. Even for the most luminous sources, pulsed fractions of 25 per cent would be needed for detection at the 99 per cent confidence level.
4 Populations of X-ray sources in the field of Centaurus A
In the central of Cen A (excluding the nucleus and the jet, Fig.1, Sect. 2) we detected 136 sources with erg s-1 and 252 ( after the incompleteness correction) sources with erg s-1 (Table A.1, 3).
4.1 Expected numbers
4.1.1 Low mass X-ray binaries
LMXBs are related to the population of old stars, and there is therefore a correlation between their number and the stellar mass of a galaxy (Gilfanov 2004). In order to estimate the expected number and luminosity distribuition of LMXBs we used a K-band image from the 2MASS Large Galaxy Atlas (Jarret et al. 2003) and integrated the flux emitted in the parts of Cen A analysed in this paper. This gives the K-band luminosity of . To convert it to the stellar mass we use the color-dependent K-band mass-to-light ratio from Bell & De Jong (2001). For the extinction corrected optical color of Cen A, , the mass-to-light ratio is . This gives the stellar mass of , assuming that the absolute K-band magnitude of the sun is equal to . Using the results of Gilfanov (2004) we predict 81 LMXBs with erg s-1, and 155 with erg s-1.
4.1.2 High mass X-ray binaries
Being young objects, HMXBs are associated with star formation and, as expected for an elliptical galaxy, are by far a less significant contribution to the population of X-ray binaries than LMXBs. In terms of absolute rates, star formation in Cen A is mostly associated with the dust disk. From their analysis of IRAS data, Marston & Dickens (1988) found the total far infra-red (FIR) luminosity of the Cen A disc to be ( erg s-1). From this luminosity we subtracted the emission from the central region which is mostly due to the active nucleus, , and corrected the distance from the 5 Mpc assumed in Marston & Dickens (1988) to the 3.5 Mpc adopted in this paper. This gives . Assuming that the total infrared luminosity is and using the SFR calibration of Kennicutt (1998) we find M⊙ yr-1. We used the calibration of Grimm et al. (2003) to calculate the expected number of HMXBs (see comment in Shtykovskiy & Gilfanov 2005 regarding the normalization). From this we get the expectation of 10 HMXBs brighter than erg s-1, and 27 sources brighter than erg s-1.
4.1.3 Background X-ray sources
To estimate the number of background sources we use the results of the CXB determination by Moretti et al. (2003). We use the source counts in the soft and hard bands (their Eq. 2) and convert the fluxes to the 0.5–8.0 keV band, assuming a powerlaw spectrum with a photon index of 1.4. For the total area of our survey of 0.079 deg2 we obtain from the source counts in the soft band 34 CXB sources above the flux corresponding to erg s-1, and 98 above erg s-1. From the hard band counts the predicted numbers are 47 and 135 sources. The predictions based on the soft and hard differ because of the well recognized fact that source counts in different energy bands and flux regimes are dominated by different types of sources. This is further discussed in Sect. 4.3. Furthermore the normalization of the CXB source counts is subject to uncertainy due to the cosmic variance. Its rms amplitude is % (see e.g. Cappelluti et al. 2005).
The results of the above calculations are summarized in Table 3. For the total number of point sources, the agreement between observed and predicted values is surprisingly good, given the amplitude of uncertainties involved. In the following two subsections we derive from the data, and compare with the predictions, the abundances of individual types of X-ray sources. This is done in two independent ways – based on the radial distribution of the sources (Sect. 4.2) and on their flux/luminosity distribution (Sect. 4.3).
4.2 Spatial distribution of point sources
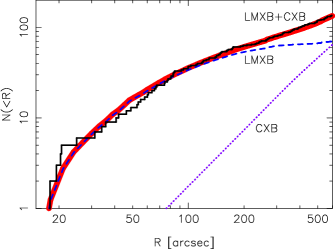
We begin with the azimuthally averaged radial profile (Fig.4). As it follows from the results of the previous section the two major contributiors to the population of point sources in the field of Cen A are low-mass X-ray binaries ( 1/2–2/3 of the sources, depending on the luminosity) and background AGNs ( 1/3–1/2). Correspondingly, we model the observed distributions as a superposition of two functions, describing their respective contributions. The spatial distribution of the LMXBs has been shown (Gilfanov 2004) to follow, to first approximation, the distribution of the stellar mass. The latter can be represented by the distribution of the K-band light and was computed using the K-band image of Cen A from the 2MASS Large Galaxy Atlas (Jarret et al. 2003). The density of the CXB sources can be assumed to be flat on the angular scales under consideration, therefore the CXB growth curve is proportional to the enclosed solid angle. In computing both radial profiles we took into account that some areas were excluded from the analysis (Fig.1). The only free parameter of the model is the ratio of normalizations of the LMXB and CXB distributions. The (unknown) distribution of HMXBs has not been included as it is unlikely to exceed 10% of the total number of sources (Sect. 4.1.2).
The model has been compared with the observed distribution of sources more luminous than erg s-1. This value of the luminosity threshold was chosen in order to include as many sources as possible and, on the other hand, to keep incompleteness effects insignificant. The model adequately describes the data (Fig.4) as confirmed with the KS-test, with a probability of 96 per cent. The best fit LMXB fraction, determined from the Maximum Likelihood (M-L) fit to the the unbinned radial distribution data, is per cent, corresponding to LMXBs and CXB sources. Compared to Table 3, the abundance of LMXBs is surprisingly close to the expectated value. The number of CXB sources, on the other hand, is higher than the expectation. This will be further discussed in Sect. 4.3.
The same LMXB+CXB model was also compared with the radially averaged azimuthal and two–dimensional distributions. The KS test of the unbinned two–dimensional distribution of the point sources (e.g. Press et al. 1992) gave a probability of . The azimuthal distribution of the sources within 5 (to exclude the outer regions dominated by CXB) has the KS-probability of per cent depending on the starting point. Also we checked whether there was any azimuthal dependence on the radial profiles, by dividing the observations into two and three slices and comparing them using the KS-test. Trying a lot of different angles, we found no evidence for such a dependence. Due to the low number of sources, such evidence would not be found unless the effect was strong.
This analysis confirms that within the statistical accuracy of the data, the spatial distribution of the LMXBs is consistent with that of the K-band light. This implies, in particular, that no additional component corresponding to HMXBs is required by the data. However, this result is not very constraining, given the rather small expected number of HMXBs, .
4.2.1 Sensitivity of the spatial distribution analysis
In order to probe the sensitivity of the above analysis we performed the following test. The LMXB distribution was streched with respect to the center of the galaxy by some scale factor, the new best fit value of the CXB to LMXB ratio was found using same method as before, and the consistency of new best fit model with the data was checked with the KS test. Then the range of values or the scale factor was found beyond which the KS probability decreased below per cent indicating deteriorated quality of the approximation. The following ranges for the scale factor values were obtained: for the radial profile analysis and for the 2-dimensional image.
These numbers indicate a rather moderate sensitivity of the spatial distribution analysis. Sensitivity limitations of this kind are unavoidable when analysing individual galaxies. Further exposure of the inner 10 of the galaxy can improve the luminosity limit below which incompleteness effects have to be taken into account. Observations with the telescope pointing to the outskirts of the galaxy could be useful too, as they could help to constrain the local CXB normalization. Also a very careful study of the source distribution at luminosities where incompleteness is a problem could increase the sensitivity. Another approach is to study combined source density distributions for several (many) galaxies.
4.3 Source counts and the cosmic X-ray background source density
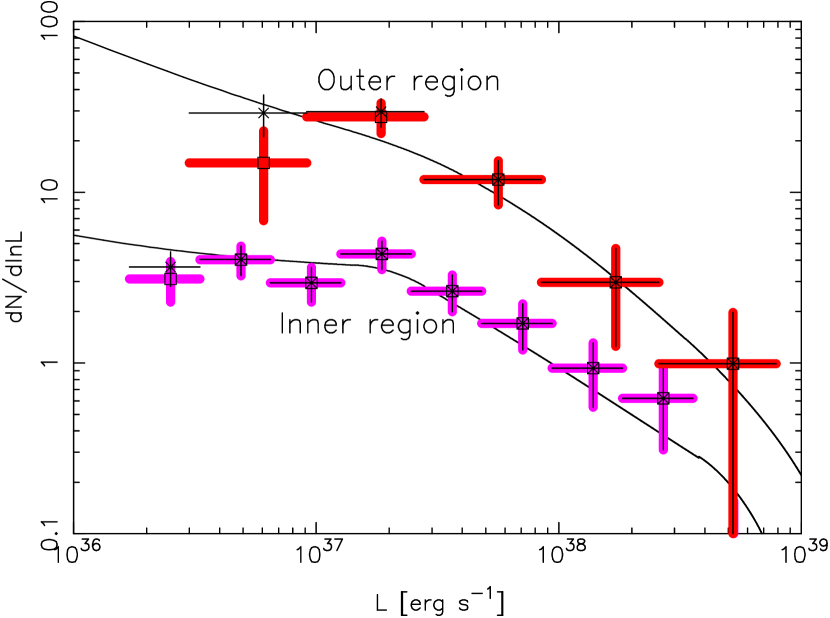
We divided Cen A into three annuli according to the ratio of predicted numbers of LMXBs and CXB sources: , , ). The inner and outer regions are expected to be dominated by LMXBs and CXB sources respectively, while the middle one contains comparable numbers of sources of both types (e.g. Fig.4). In analysing the luminosity functions and distributions we used the procedure described in Appendix A to correct for incompleteness effects.
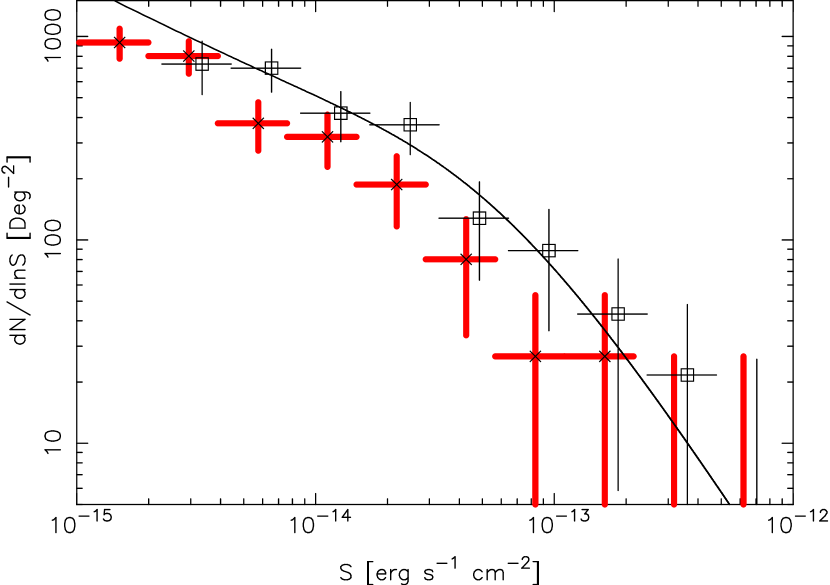
We estimate the normalization of the CXB distribution from the source counts in the outer region. This region is far enough from the inner parts of the Cen A to keep the number of sources related to the galaxy low, while close enough to the aimpoints of the observations to have a reasonable sensitivity. In this region the incompleteness corrected number of sources with the 0.5–8 keV flux exceeding 10-15 erg s-1 cm-2 (luminosity erg s-1) is 101.3 from which 13.4 are expected to be LMXBs. The implied number of CXB sources is , which we compare with the results of the radial profile analysis from the previous section and with results of dedicated CXB source counts. For this comparison we express the CXB normalization in units of the number of sources per deg2 with 0.5–8.0 keV flux erg s-1 cm-2. The results of the CXB surveys are transformed to the 0.5–8.0 keV energy range assuming a power law spectrum with the photon index of 1.4. We used the source counts in both their soft (0.5–2.0 keV) and hard (2.0–8.0 keV) bands. The results are shown in the two columns in the upper part of Table 4. The last two lines in Table 4 present the results of the radial profile analysis and of the source counts in the ring. Note that although these two numbers are not statistically independent, they are obtained from different considerations. The radial profile analysis is based on sources with erg s-1 in the entire region and relies heavily on the assumption about the spatial distribution of the LMXB component. The source counts in the outer region use all sources in the with a luminosity above erg s-1 and are significantly less dependent on the assumption of the LMXB spatial distribution.
| Survey | soft band | hard band |
|---|---|---|
| CDF-S | 33270 | 68671 |
| CDF-N | 43780 | 79173 |
| Cappelluti et al., 2004 | 35028 | 41943 |
| Cowie et al., 2002 | 45630 | |
| Moretti et al., 2003 | 422 | 579 |
| Obs–ID 1671 (CDF-N) | ||
| Radial profile (Cen A) | ||
| counts (Cen A) | ||
The normalization is expressed as the number of sources per deg2 with 0.5–8.0 keV flux erg s-1 cm-2. The two columns give the numbers computed from the soft and hard band counts respectively. The for CDF-fields data listed in the upper part of the table are from Rosati et al. (2002), in the lower part – from this paper.
As it has been already mentioned, there is a significant difference between the normalizations found from the hard and soft bands. This is related to the fact that different types of sources give dominant contributions to the hard and soft bands. Theoretically, the two bands can be reconciled using different spectral shapes for the the flux conversion, but this would introduce additional uncertainties and an investigation of this kind is beyond the scope of this paper. In addition, there is also a considerable spread in the CXB normalizations in the same energy band obtained in different surveys. This spread is partly due to the cosmic variance and partly it is likely to be caused by the difference in the analysis procedures and relative calibrations of different instruments.
In order to do a direct comparison with the empty fields source counts in the keV energy band, we have analysed one observation from the CDF-N (Obs-ID 1671), using the same data analysis procedure as we used for Cen A. The column density of neutral hydrogen was set to 1.5 cm-2 (Dickey & Lockman 1990). To avoid incompleteness effects, we only used sources observed in regions with exposure above s cm2. This limits the field to 0.058 deg2. Above a flux of erg s-1 cm-2 (equal to the flux used to extimate the CXB normalization in the outer region of Cen A) we find 53 sources. This number can be directly compared with 88 CXB sources detected in the outer annulus in the Cen A field (by chance the two areas coincide). In order to facilitate comparison with the other CXB surveys, we transform this number to the units of Table 4, using the from the soft band of Moretti et al. (2003).
Even with the spread in values found from the various surveys, the CXB normalization in the Cen A field appears to be higher than the typical numbers obtained in the dedicated CXB studies, with the exception of the hard band counts of the Chandra Deep Fields, according to the analysis of Rosati et al. (2002). The latter two excluded, the density of CXB sources appears to be enhanced by a factor of . Although this is larger than the rms variation between different fields typically quoted in the literature, per cent, the observed number is not exceptionally high and still lies within the spread of the CXB density values (e.g. Cappelluti et al. 2005).
4.4 LMXB X-ray luminosity function
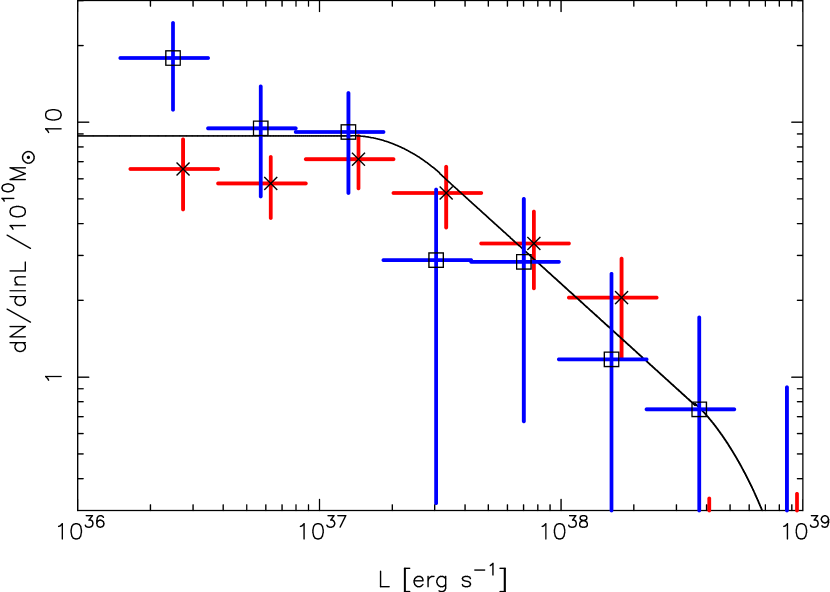
The luminosity function of LMXBs determined from the two inner regions is shown in Fig.6. In subtracting the contribution of CXB sources we used the distribution from Moretti et al. (2003) with the normalization determined in the Sect. 4.3. While the CXB contribution is unimportant in the innermost region , it accounts for about half of the sources in the middle region . As is obvious from Fig.6, both distributions are consistent with each other and with the average LMXB XLF in the local galaxies determined by Gilfanov (2004), with the possible exception of the the lowest luminosity bin of the middle region, which deviates by .
To further constrain the parameters of LMXB XLF in Cen A we fit the luminosity distribution in the inner region with a power law with two breaks, identical to the one used in Gilfanov (2004). Since there are no sources luminous enough to constrain the upper break and the slope beyond that, we have fixed them at the average values: erg s-1, . The best fit values of other parameters are: the low luminosity slope , a break at erg s-1 and a slope after the break . The slopes refer to the differential distribution, the parameter errors are statistical errors only. Notice that the break value found for differential XLFs is systematically higher than the break value found for cumulative XLFs, using the same data, see e.g. Kaaret (2002). These parameters are insensitive to whether the CXB component is accounted for or not.
A large uniformly analysed sample of the XLF of LMXBs in elliptical galaxies was presented by Kim & Fabbiano (2004). They find an average differential slope of in the luminosity range a few to erg s-1. This is consistent with our results from the inner region. A KS-test gives 73 per cent probability that the observed luminosity distribution above erg s-1 could be produced by their LMXB XLF. On the other hand it is clear that at the faint end of the XLF the extrapolation of their results is inconsistent with our observations. For sources more luminous than erg s-1, a similar KS-test gives 3.4 per cent, and for lower luminosities the probability decreases further.
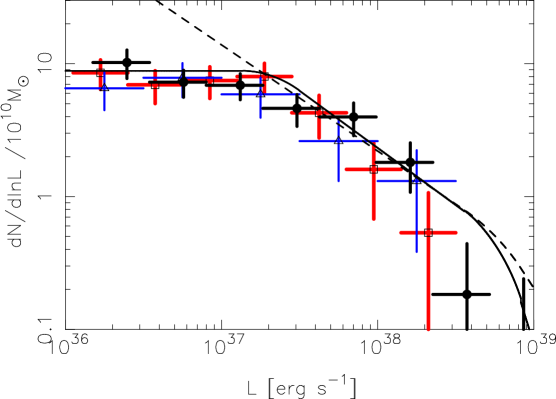
The LMXB XLF based on the combined data of is plotted in Fig.7 along with luminosity distributions of LMXBs in the Milky Way and M31. This plot further illustrates the qualitative and quantitative similarity of the LMXB luminosity distributions in Cen A and bulges of spiral galaxies. This is the first study to extend the LMXB XLF in elliptical galaxies below few erg s-1. Spiral and elliptical galaxies have different evolutionary histories and it could differ in the properties of their LMXB populations. As demonstrated here, the luminosity functions nevertheless seem very similar, except for the break luminosity which could be somewhat higher in Cen A than in the Milky Way and M31. Whether this reflects a systematic difference between LMXBs in galaxies of different type is yet to be investigated.
4.5 ratios
In the inner (middle) region there are 53 (27) sources with erg s-1, with an integrated luminosity of () erg s-1. We expect the CXB contribution to be =3.8 (13.4), corresponding to a luminosity of () erg s-1. From the K-band light we estimate that the stellar mass is 3.6 (1.3) , and this gives us the ratios /=13.71.9 (10.52.0) sources per and /=6.4 (4.8) erg s-1 per . The values for the two regions are consistent. They are also in a good agreement with the values for different nearby galaxies listed in Table 2 of Gilfanov (2004) as well as with the average values of and erg/s per .
The ratios obtained in this paper are by a factor of 2 lower than the values for Cen A in Gilfanov (2004). He reported problems in approximating the multi-aperture K-band photometry data for Cen A galaxy. Indeed, we recomputed the K-band luminosity for the same region using the 2MASS K-band image and obtained times larger number. This explains the lower values of / and / found in this paper. As these numbers are derived from the real K-band images rather than from extrapolation of the multi-aperture K-band photometry, they better represent the true values of the ratios.
5 Summary and conclusions
We have used archival data of CHANDRA observations to study statistical properties of the point source population of Cen A. Our primary goal was to investigate the faint end of the LMXB luminosity distribution in an elliptical galaxy and to compare it with LMXB XLF in bulges of spiral galaxies.
To achieve this we assembled as deep a survey of the central part of the galaxy as permitted by the available data and implemented an adequate correction for the incompleteness effects.
Cen A is the closest giant elliptical galaxy and the only one with enough exposure time by CHANDRA to perform such a study. As Cen A is a merger remnant, the stellar and LMXB population might differ from those of less disturbed giant ellipticals. It is therefore important to further perform deep studies of the X-ray source population of more normal early-type galaxies.
Using a combined image of four ACIS observations (Table 1, Fig.1) with the total exposure time of 170 ks we have detected 272 point-like sources within 10 of the nucleus of Cen A. The luminosity of the weakest detected source is erg s-1 (assuming a distance of 3.5 Mpc), while the source sample starts to be affected by the incompleteness effects below erg s-1 (Fig.8). After correction for incompleteness, the total number of sources with erg s-1 is . This number is in good agreement with the prediction based on the stellar mass, the star formation rate in Cen A and the density of CXB sources (Table 3). About half of the detected sources are expected to be X-ray binaries in Cen A, mostly LMXBs; the vast majority of the remaining sources are background galaxies constituting the resolved part of the CXB.
The spatial distribution of the detected sources can be well described by a sum of two components. Of these, one has a density proportional to the K-band light (Fig.4) and the other is uniform accross the Cen A field. We interpret this as that the former represents low-mass X-ray binaries in Cen A while the latter accounts for the resolved part of the CXB. The normalization of the LMXB component agrees well with the average value derived for the local galaxies by Gilfanov (2004). The normalization of the uniform component and source counts in the exteriors of the galaxy appear to indicate an overabundance of the CXB sources in the direction of Cen A by a factor of or, possibly, more (Table 4, Fig.5).
After applying the incompleteness correction and subtracting the contribution of CXB sources we were able to recover the the LMXB luminosity function in the inner down to erg s-1 (Fig.6,7). This is by a factor of better than achieved previously for any elliptical galaxy (Kraft et al. 2001; Kim & Fabbiano 2004). The shape of the luminosity distribution is consistent with the average LMXB XLF in nearby galaxies derived by Gilfanov (2004) and for the bright end by Kim & Fabbiano (2004). In particular, we demonstrate that the LMXB XLF in Cen A flattens at the faint end and is inconsistent with extrapolation of the steep power law with differential slope of observed above in the previous studies of elliptical galaxies. Rather, the LMXB XLF in Cen A has a break at erg s-1 below which it follows the law, similar to the behaviour found in the bulges of spiral galaxies.
Acknowledgements.
This reaserch has made use of CHANDRA archival data provided by the CHANDRA X-ray Center and data from the 2MASS Large Galaxy Atlas provided by NASA/IPAC infrared science archive. We would like to thank the referee for useful comments.References
- Bell & De Jong (2001) Bell, E., & De Jong, R. 2001, ApJ, 550, 212
- Bildsten & Deloye (2004) Bildsten, L., & Deloye, C.J. 2004, ApJ, 607, L119
- Cappelluti et al. (2005) Cappelluti, N., Cappi, M., Dadina, M., et al., 2005, A&A, 430, 39
- Colbert et al. (2004) Colbert, E.J.M., Heckman, T.M., Ptak, A.F., Strickland, D.K., & Weaver, K.A. 2004, ApJ, 602, 231
- Cowie et al. (2002) Cowie, L.L., Garmire, G.P., Bautz, M.W., et al. 2002, ApJ, 566, L5
- Dickey & Lockman (1990) Dickey, J.M., & Lockman, F.J. 1990, ARA&A, 28, 215
- Evans et al. (2004) Evans, D.A., Kraft, R.P., Worrall, D.M., et al. 2004, ApJ, 612, 786
- Freeman et al. (2002) Freeman, P.E., Kashyap, V., Rosner, R., & Lamb, D.Q. 2002, ApJ SS 138, 185
- Gilfanov (2004) Gilfanov, M., 2004, MNRAS 349, 146
- Graham & Fasset (2002) Graham, J.A., & Fasset, C.I. 2003, ApJ, 575, 712
- Grimm et al. (2003) Grimm, H-J., Gilfanov, M.R., & Sunyaev, R.A. 2003, MNRAS, 339, 793
- Hardcastle et al. (2003) Hardcastle, M.J., Worrall, D.M., Kraft, R.P., et al. 2003, ApJ 593, 169
- Israel (1998) Israel, F.P. 1998, A&A Rev., 8, 237
- Jarret et al. (2003) Jarret, T.H., Chester, T., Cutri, R., Schneider, S., & Huchra, J.P. 2003, AJ 125, 525
- Kaaret (2002) Kaaret, P. 2002, ApJ 578, 114
- Karovska et al. (2002) Karovska, M., Fabbiano, G., Nicastro, F., et al. 2002, ApJ, 577, 114
- Kennicutt (1998) Kennicutt, R.C. 1998, ARA&A, 36, 189
- Kim & Fabbiano (2003) Kim, D.-W.,& Fabbiano, G 2003, ApJ, 586, 826
- Kim & Fabbiano (2004) Kim, D.-W.,& Fabbiano, G 2004, ApJ, 611, 846
- Kraft et al. (2001) Kraft, R.P., Kregenow, J.M., Forman, W.R., Jones, C., & Murray, S.S. 2001, ApJ, 560, 675
- Kraft et al. (2002) Kraft, R.P., Forman, W.R., Jones, C., et al. 2002, ApJ, 569, 54
- Kraft et al. (2003) Kraft, R.P., Vázquez, S.E, Forman, W.R., et al. 2003, ApJ, 592, 129
- Marston & Dickens (1988) Marston, A.P., & Dickens, R.J. 1988, A&A, 193, 27
- Minniti et al. (2003) Minniti, D., Rejkuba, M., Funes, J.G., & Akiyama, S. 2003, ApJ, 600, 716
- Monet et al. (2003) Monet, D.G., Levine, S.E., Canzian, B., et al. 2003, AJ, 125, 984
- Moretti et al. (2003) Moretti, A., Campana, S., Lazzati, D., & Tagliaferri, G. 2003, ApJ, 588, 696
- Morrison et al. (2001) Morrison, J.E., Röser, S., McLean, B., Bucciarelli, B., Lasker, B. 2001, AJ, 121, 1752
- Peng et al. (2004) Peng, E.W., Ford, H.,C., & Freeman, K.C. 2003, ApJ SS, 150, 367
- Postnov & Kuranov (2005) Postnov, K.A., & Kuranov, A.G. 2005, Astro. Lett., 31, 7
- Press et al. (1992) Press, W.H., Teukolsky, S.A., Vetterling, W.T., & Flannery, B.P. 1992, Numerical recipes in C. The art of scientific computing, University Press, Cambridge
- Prestwich et al. (2003) Prestwich, A.H., Irwin, J.A., Kildgard, R.E., et al. 2003, ApJ 595, 719
- Roeser et al. (1991) Roeser, S., Bastian, U., & Wiese, K. 1991, A&A SS, 88, 277
- Rosati et al. (2002) Rosati, P., Tozzi, P., Giacconi, R., et al. 2002, ApJ, 556, 667
- Schiminovich et al. (1994) Schiminovich, D., van Gorkom, J.H., van der Hulst, J.M., & Kasow, S. 1994, ApJ, 423, L101
- Shtykovskiy & Gilfanov (2005) Shtykovskiy, P., & Gilfanov, M., 2005, A&A, 431, 597
- Woodley et al. (2005) Woodley, K.A., Harris, W.E., & Harris, G.L.H. 2005, AJ, 129, 2654
Appendix A Correction for incompleteness
The variations of the diffuse background level and deterioration of the point spread function at large off-axis angles lead to variations of the point-source sensitivity accross the Chandra images. In the case where several observations with different pointing directions are combined, this effect is further amplified by the non uniform exposure of the combined image. As a result, the completness of the source sample at the faint end is compromised. A trivial solution to this problem is to define a conservative sensitivity limit, which is high enough to be achieved everywhere across the image. Although simple in implementation, this method has a disadvantage that a noticeable fraction of the source has to be thrown away. Nevertheless, it has been used, with few exceptions (e.g. Kim & Fabbiano 2004; Shtykovskiy & Gilfanov 2005), in the majority of the earlier studies of the point source populations in galaxies. A more effective approach to the problem is to define the correction function to the flux/luminosity distribution, which accounts for the sensitivity variations accross the image. For a uniform distribution of sources this correction function simply accounts for the dependence of the survey area upon the energy flux or count rate. This is the case, for example, in the CXB studies. In a more complex case of a non-uniform distribution of point sources, the observed and real flux distributions are related via:
| (1) |
where is the surface density distribution of point sources, and for given flux the integration is performed over the part of the image where the local sensitivity satisfies the condition . If the flux distribution does not depend on the position, it can be easily recovered from the above equation. Importantly, knowledge of the spatial distribution of sources is required in order to recover the flux distribution and vice versa. If both flux and density distributions are unknown, the sample incompleteness can not be properly accounted for. The problem is further complicated by the contribution of the CXB sources, having a diferent spatial and flux distributions:
| (2) |
For the practical implementation of the correction procedure, knowledge of the source detection algorithm is of course required. The wavdetect task (Freeman et al. 2002) correlates the image with a Mexican Hat function and registers sources with the correlation value exceeding a threshold value. The latter is estimated numerically based on the user-specified threshold significance. For each of the used detection scales we computed the threshold sensitivity on a grid of the positions on the image (16 azimuthal angles, 40 radii from the centre of Cen A). At each image position the PSF was obtained from the CALDB PSF library for each of the four individual observations and then combined with the exposure times as weights. The local background levels were found from the normalized background maps created by wavdetect. The sensitivity for any given position on the image was found from interpolation of the grid values. The sample incompleteness is described by the incompleteness function:
| (3) |
where are the pixel coordinates and is the position-dependent sensitivity. Depending on the desired normalization of the , the the density distribution can be normalized to unity or, for example, be given in the units of per pixel of the image.
If the CXB contribution can be neglected (eq.1), the corrected luminosity distribution can be obtained giving the weight to a source of luminosity . For the ML fits the model should be multiplied by the .
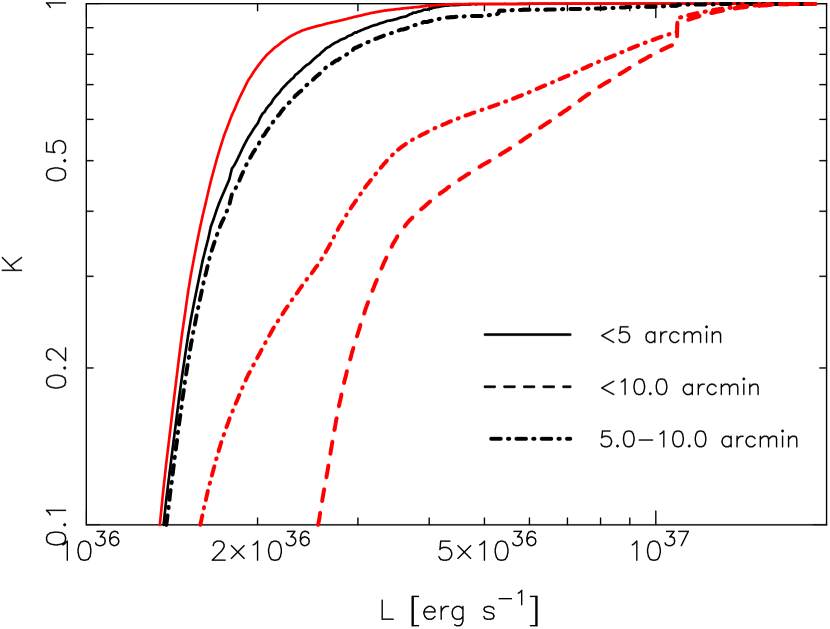
For the general case of eq.2, the incompleteness function should be calculated for the CXB and LMXB components separately. For the LMXBs density distribution we used the K-band image, the CXB distribution was assumed to be uniform. The corresponding incompleteness functions are shown in Fig. 8. They demonstrate clearly importance of the spatial distribution of sources.
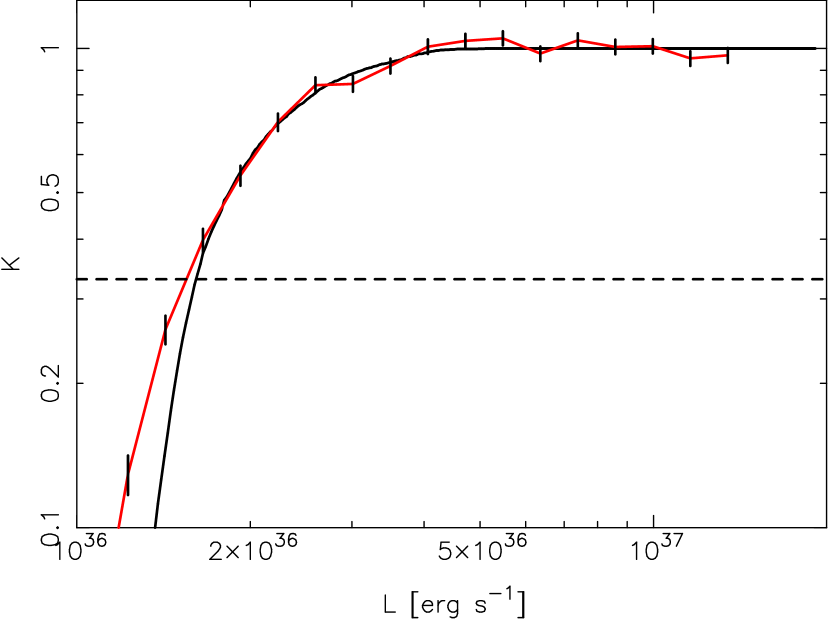
The results of one of our simulations are shown in Fig.9. In these simulations the background map from the wavdetect and the K-band image were azimutahlly averaged. The flux/luminosity distributions for the CXB sources and LMXBs were assumed in the form described in Sects. 4.3 and 4.4. In the simulations, the sources were randomly drawn from the assumed spatial and luminosity distributions and projected to the image using the PSF data from CALDB. The image of expectation values, containing the diffuse component and the point source contribution was then randomized assuming Poission statistics. The final image was analysed using the same chain of tasks as applied to the real images. The simulated and obtained luminosity distributions are shown in Fig.9.
The Figs.8 and 9 demonstrate that given the pattern of Chandra observations of Cen A, incompleteness effects are not of primary concern in the inner region at the luminosoties above erg/s. They should be taken into account, however, for the source counts in the entire image and in the outer ring.
A.1 Verification of the incompleteness correction
Although simulations described above show that the correction procedure is adequate for the analysis of Cen A, their accuracy is limited by the Poisonian statistics. Such accuracy limitations are intrinsic to full simulations of individual galaxies because the number of sources thaimit can be put into a simulation is limited by the crowding effect. Another disadvantage of these simulation is that we used smoothed background maps produced by wavdetect, which, in addition, were azimuthally averaged.
In order to perform a more accurate and sensitive check of our incompleteness correction procedure we used a more direct, but also more computationally expensive, method, similar to the backward correction method suggested by Kim & Fabbiano (2003). In this method sources are placed one at a time on the real (unprocessed) observed image. For each simulated source the source detection and photometry are performed with the wavdetect task and then the original image is restored. As each source is put on the original undisturbed image, an arbitrarily large number of sources can be simulated. The incompleteness function is given by the source detection efficiency and can be computed as a ratio of the flux distribution of the detected sources to the input flux distribution.
Using this method we checked the incompleteness correction for the region within 5′ from the centre of Cen A, for the LMXB component. As above, the source distribution was assumed to follow the K-band light, and the differential luminosity function was chosen to follow 1/L. The sources were put on the image using the same method as in the simulations above, utilizing the CALDB PSF library together with the exposure map of the observations. To reduce statistical errors, we simulated 20,000 sources.
The resulting incompleteness correction, together with the correction function utilized throughout this paper, is shown in figure 10. As it can be seen from the figure, the two curves differ at low fluxes, corresponding to erg/s. The difference is caused by two effects. Firstly, the Eddington bias is neglected in our incompleteness correction calculations whereas it is automatically included in the simulations. The second reason is that in the wavdetect task the source detection and countrate calculation are based on two different calculations. The source detection uses the correlation values of the wavelet transform to determine the source significance, whereas the photometry is performed on the original image. Although there is a linear relation between the expectation values of the source countrate and wavelet correlation, the measured numbers are subject to statistical fluctuations. This is ignored in the correction procedure, which uses the wavelet correlation values to both calculate the source significance and source flux. This effect is only important at low numbers of counts, where only a few sources are detected. These weak sources are excluded from our luminosity function analysis as we include only sources with the detection efficiency of . For the weakest source used to plot Figs.5–7 the difference between two correction factors is 4.6%. In Fig. 7, for example, the lowest luminosity bin would decrease by 2%. This accuracy of the incompleteness correction is sufficient for the analysis presented in this paper.
[x]rcrccrrrccl
The list of point like X-ray sources within
from the center of Cen A.
ID CXO Name Dist R.A. Dec. Total Cts Source Cts Error Luminosity
Type ID reference
(1) (2) (3) (4) (5) (6) (7) (8) (9) (10) (11)
\endfirstheadcontinued.
ID CXO Name Dist R.A. Dec. Total Cts Source Cts Error Luminosity
Type ID reference
(1) (2) (3) (4) (5) (6) (7) (8) (9) (10) (11)
\endhead\endfoot1 CXOU J132526.9-430052 17.5 13 25 27.0 -43 00 52.8 499 266.8 22.3
2 CXOU J132529.1-430114 18.1 13 25 29.2 -43 01 14.6 219 78.8 14.8 Hα mrfa-45
3 CXOU J132526.4-430054 19.1 13 25 26.5 -43 00 54.6 1905 1480.7 43.6
4 CXOU J132526.7-430126 19.7 13 25 26.8 -43 01 26.1 523 267.1 22.9
5 CXOU J132527.5-430128 19.8 13 25 27.5 -43 01 28.5 991 705.3 31.5 GC mrfa-053
6 CXOU J132529.4-430108 20.2 13 25 29.5 -43 01 08.3 498 297.4 22.3 GC mrfa-044
7 CXOU J132526.6-430129 23.3 13 25 26.6 -43 01 29.4 118 51.6 10.9
8 CXOU J132525.7-430056 23.8 13 25 25.8 -43 00 56.1 1862 1578.1 43.2 GC mrfa-017
9 CXOU J132525.2-430114 26.1 13 25 25.3 -43 01 14.3 105 61.7 10.2
10 CXOU J132529.6-430122 26.4 13 25 29.7 -43 01 22.5 68 31.3 8.2
11 CXOU J132525.5-430124 27.3 13 25 25.6 -43 01 24.2 259 110.3 16.1
12 CXOU J132528.4-430137 30.6 13 25 28.5 -43 01 37.9 96 42.9 9.8
13 CXOU J132525.1-430127 32.3 13 25 25.2 -43 01 27.1 741 565.7 27.2 GC mrfa-057
14 CXOU J132524.7-430125 34.9 13 25 24.8 -43 01 25.0 263 181.6 16.2
15 CXOU J132524.3-430110 35.8 13 25 24.4 -43 01 10.4 199 121.7 14.1
16 CXOU J132527.0-430030 38.7 13 25 27 -43 00 30.6 172 128.5 13.1
17 CXOU J132530.8-430128 40.5 13 25 30.9 -43 01 28.4 67 37.4 8.2
18 CXOU J132523.9-430059 41.5 13 25 23.9 -43 00 59.0 312 227.5 17.7
19 CXOU J132531.4-430057 43.9 13 25 31.5 -43 00 57.2 38 21.6 6.2
20 CXOU J132523.8-430127 45.2 13 25 23.9 -43 01 27.2 61 31.1 7.8
21 CXOU J132524.4-430141 47.6 13 25 24.4 -43 01 41.2 252 168.2 15.9 Hα mrfa-60
22 CXOU J132527.0-430159 50.9 13 25 27.1 -43 01 59.4 825 675.6 28.7 Hα mrfa-54
23 CXOU J132527.2-430016 52.9 13 25 27.3 -43 00 16.0 35 21.2 5.9
24 CXOU J132524.1-430145 53.0 13 25 24.2 -43 01 45.7 84 49.3 9.2
25 CXOU J132523.3-430043 53.1 13 25 23.4 -43 00 43.6 79 48.2 8.9
26 CXOU J132523.5-430138 53.9 13 25 23.5 -43 01 38.7 714 589.2 26.7
27 CXOU J132522.9-430125 54.2 13 25 22.9 -43 01 25.1 1947 1780 44.1
28 CXOU J132523.0-430134 56.1 13 25 23.1 -43 01 34.9 226 157.3 15
29 CXOU J132532.4-430134 58.9 13 25 32.5 -43 01 34.3 869 768.3 29.5
30 CXOU J132522.3-430122 59.1 13 25 22.4 -43 01 22.3 63 33.8 7.9
31 CXOU J132533.0-430108 59.9 13 25 33.1 -43 01 08.0 264 213.4 16.2
32 CXOU J132523.0-430145 61.9 13 25 23.1 -43 01 45.8 406 312.7 20.2
33 CXOU J132526.9-430004 64.4 13 25 26.9 -43 00 04.9 25 18.5 5.0
34 CXOU J132522.1-430132 65.0 13 25 22.1 -43 01 32.3 85 59.1 9.2
35 CXOU J132533.3-430053 65.0 13 25 33.4 -43 00 53.1 507 427.8 22.5 Hα mrfa-06
36 CXOU J132525.5-430210 65.5 13 25 25.6 -43 02 10.5 63 46 7.9 GC mrfa-055
37 CXOU J132527.4-430214 65.5 13 25 27.5 -43 02 14.3 1609 1496.2 40.1
38 CXOU J132531.3-430203 68.2 13 25 31.4 -43 02 03.3 22 18.8 4.7
39 CXOU J132527.6-430218 69.4 13 25 27.7 -43 02 18.2 288 227.8 17 FS mrfa-51
40 CXOU J132521.3-430046 72.1 13 25 21.4 -43 00 46.0 51 36.9 7.1
41 CXOU J132522.8-430017 72.9 13 25 22.9 -43 00 17.6 363 331.7 19.1
42 CXOU J132523.7-430009 73.0 13 25 23.7 -43 00 09.7 1835 1730 42.8 Hα mrfa-21
43 CXOU J132524.7-430002 73.2 13 25 24.8 -43 00 02.6 116 85.4 10.8
44 CXOU J132524.2-425959 78.5 13 25 24.2 -42 59 59.7 573 521.5 23.9 Hα mrfa-19
45 CXOU J132525.3-430223 78.8 13 25 25.3 -43 02 23.4 213 180.1 14.6
46 CXOU J132521.7-430154 78.8 13 25 21.7 -43 01 54.2 191 137.5 13.8
47 CXOU J132531.6-430003 78.9 13 25 31.6 -43 00 03.3 1023 962.6 32 GC pff-gc-210
48 CXOU J132528.7-425948 81.2 13 25 28.8 -42 59 48.6 1107 1034.7 33.3
49 CXOU J132521.2-430154 83.9 13 25 21.2 -43 01 55.0 212 189 14.6
50 CXOU J132523.5-430220 84.4 13 25 23.6 -43 02 20.8 465 421 21.6
51 CXOU J132521.2-430158 85.5 13 25 21.3 -43 01 58.9 223 174.4 14.9
52 CXOU J132521.5-430213 93.0 13 25 21.6 -43 02 13.8 146 124.7 12.1
53 CXOU J132520.8-430010 94.3 13 25 20.8 -43 00 10.8 27 20.3 5.2
54 CXOU J132532.0-430231 95.8 13 25 32.0 -43 02 31.5 535 490.7 23.1 Hα mrfa-40
55 CXOU J132525.8-425933 97.4 13 25 25.8 -42 59 33.4 33 17.4 5.7
56 CXOU J132530.3-425935 98.1 13 25 30.3 -42 59 35.2 136 89.8 11.7 GC pff-gc-209
57 CXOU J132518.9-430136 98.7 13 25 19.0 -43 01 37.0 67 48.6 8.2
58 CXOU J132529.0-425931 98.9 13 25 29.0 -42 59 31.1 95 59.8 9.7
59 CXOU J132536.6-430057 99.5 13 25 36.6 -43 00 57.6 303 233.9 17.4
60 CXOU J132518.5-430116 99.8 13 25 18.5 -43 01 16.3 578 523.1 24 GC mrfa-074
61 CXOU J132519.9-430203 100.4 13 25 19.9 -43 02 03.3 38 25 6.2
62 CXOU J132518.7-430141 102.7 13 25 18.7 -43 01 41.2 96 72.3 9.8
63 CXOU J132519.2-430158 104.6 13 25 19.2 -43 01 58.4 61 45.1 7.8
64 CXOU J132528.2-430253 105.0 13 25 28.2 -43 02 53.6 368 340.1 19.2
65 CXOU J132537.4-430131 110.2 13 25 37.4 -43 01 31.8 109 81.5 10.4 GC mrfa-033
66 CXOU J132526.7-430300 112.0 13 25 26.8 -43 03 00.4 188 159.4 13.7
67 CXOU J132518.7-430205 113.2 13 25 18.7 -43 02 05.8 41 27.3 6.4
68 CXOU J132522.2-430245 113.7 13 25 22.2 -43 02 45.8 126 116.9 11.2 GC pff-gc-121
69 CXOU J132520.6-425942 115.5 13 25 20.7 -42 59 42.1 22 12.7 4.7
70 CXOU J132530.4-425914 118.7 13 25 30.5 -42 59 14.3 496 435.8 22.3
71 CXOU J132535.2-430234 119.4 13 25 35.2 -43 02 34.1 150 120.8 12.2
72 CXOU J132517.8-430204 120.4 13 25 17.9 -43 02 04.4 209 181.6 14.5
73 CXOU J132531.9-430302 123.1 13 25 31.9 -43 03 02.5 56 38.2 7.5
74 CXOU J132527.8-425903 125.0 13 25 27.9 -42 59 03.9 43 26.5 6.6
75 CXOU J132528.4-430315 126.9 13 25 28.4 -43 03 15.4 251 211.5 15.8
76 CXOU J132535.5-425935 127.6 13 25 35.5 -42 59 35.3 609 549 24.7 GC pff-gc-214
77 CXOU J132538.3-430205 130.4 13 25 38.3 -43 02 05.8 2221 2158.8 47.1
78 CXOU J132539.4-430058 130.6 13 25 39.5 -43 00 58.9 39 22 6.2
79 CXOU J132517.0-430007 131.1 13 25 17.1 -43 00 07.5 46 33.9 6.8
80 CXOU J132533.3-425913 131.5 13 25 33.4 -42 59 13.6 101 78 10.1
81 CXOU J132515.7-430158 139.6 13 25 15.7 -43 01 58.2 58 44.7 7.6
82 CXOU J132533.6-430313 141.2 13 25 33.7 -43 03 13.3 188 159.3 13.7
83 CXOU J132514.8-430048 141.6 13 25 14.8 -43 00 48.7 42 21.3 6.5
84 CXOU J132540.5-430115 142.1 13 25 40.6 -43 01 15.2 638 587 25.3
85 CXOU J132538.2-430230 142.3 13 25 38.3 -43 02 30.5 15 9.4 3.9
86 CXOU J132523.6-430325 143.9 13 25 23.6 -43 03 25.9 256 221.8 16
87 CXOU J132533.9-425859 146.4 13 25 34.0 -42 58 59.9 558 514.4 23.6 GC pff-gc-159
88 CXOU J132520.0-430310 147.1 13 25 20.1 -43 03 10.4 367 317.4 19.2 GC mrfa-071
89 CXOU J132516.9-425938 147.9 13 25 16.9 -42 59 38.8 19 11.9 4.4
90 CXOU J132532.4-425850 148.1 13 25 32.4 -42 58 50.5 206 180.8 14.4 GC pff-gc-178
91 CXOU J132522.3-425852 148.2 13 25 22.4 -42 58 52.2 41 25.8 6.4
92 CXOU J132541.0-430126 148.6 13 25 41.1 -43 01 26.8 607 574.2 24.6
93 CXOU J132514.0-430121 149.6 13 25 14.0 -43 01 21.6 63 43.4 7.9
94 CXOU J132541.0-430037 150.0 13 25 41.0 -43 00 37.7 49 25.6 7
95 CXOU J132516.8-425932 152.7 13 25 16.8 -42 59 32.4 34 24.3 5.8
96 CXOU J132519.9-430317 153.5 13 25 19.9 -43 03 17.2 2263 2028.1 47.6
97 CXOU J132524.9-430341 155.2 13 25 24.9 -43 03 41.2 33 22.8 5.7
98 CXOU J132527.3-425829 159.2 13 25 27.3 -42 58 29.7 68 48.3 8.2
99 CXOU J132541.9-430142 161.0 13 25 42.0 -43 01 42.3 32 21.7 5.7
100 CXOU J132512.9-430114 161.4 13 25 12.9 -43 01 14.7 589 527.1 24.3 GC mrfa-082
101 CXOU J132520.6-425846 162.2 13 25 20.6 -42 58 46.0 712 676.3 26.7
102 CXOU J132516.4-430255 162.5 13 25 16.4 -43 02 55.4 290 262.1 17
103 CXOU J132538.6-425919 162.5 13 25 38.6 -42 59 20.0 99 70.5 10 GC pff-gc-164
104 CXOU J132512.4-430049 167.4 13 25 12.5 -43 00 49.4 56 39.5 7.5
105 CXOU J132512.0-430044 172.7 13 25 12.0 -43 00 44.6 343 302.3 18.5
106 CXOU J132540.0-430255 173.2 13 25 40.1 -43 02 55.5 45 27.1 6.7
107 CXOU J132527.9-430402 173.7 13 25 28.0 -43 04 02.5 194 167.4 13.9 GC mrfa-050
108 CXOU J132540.4-430251 174.4 13 25 40.5 -43 02 51.8 38 26.7 6.2 Hα mrfa-30
109 CXOU J132540.8-430247 175.0 13 25 40.8 -43 02 47.1 267 234.5 16.3
110 CXOU J132514.0-430243 175.8 13 25 14.1 -43 02 43.2 141 118.9 11.9 GC mrfa-080
111 CXOU J132535.7-430340 176.5 13 25 35.8 -43 03 40.9 44 33.7 6.6
112 CXOU J132512.0-430010 180.6 13 25 12.0 -43 00 11.0 473 441.9 21.7 FS mrfa-85
113 CXOU J132529.4-425809 180.6 13 25 29.4 -42 58 09.3 28 18 5.3 GC pff-gc-155
114 CXOU J132533.8-425821 180.8 13 25 33.9 -42 58 21.5 78 61.6 8.8
115 CXOU J132511.1-430132 182.7 13 25 11.1 -43 01 32.3 25 17.8 5
116 CXOU J132542.7-425943 186.6 13 25 42.8 -42 59 43.9 28 17.3 5.3
117 CXOU J132528.3-430416 187.9 13 25 28.3 -43 04 16.5 113 95.9 10.6
118 CXOU J132511.5-430226 192.1 13 25 11.6 -43 02 26.6 184 161.9 13.6
119 CXOU J132514.5-425858 193.9 13 25 14.5 -42 58 58.7 22 13.7 4.7
120 CXOU J132517.7-430350 194.4 13 25 17.8 -43 03 50.6 43 29.9 6.6
121 CXOU J132545.6-430115 197.9 13 25 45.7 -43 01 15.9 79 43.1 8.9 GAL whh-317
122 CXOU J132524.9-430425 199.1 13 25 24.9 -43 04 25.7 151 132.9 12.3
123 CXOU J132512.1-425918 201.8 13 25 12.2 -42 59 18.8 34 25.3 5.8
124 CXOU J132529.3-425747 201.8 13 25 29.3 -42 57 47.8 48 23.8 6.9 GC whh-22
125 CXOU J132514.8-425840 204.1 13 25 14.8 -42 58 40.8 33 23.2 5.7
126 CXOU J132542.1-430319 206.0 13 25 42.1 -43 03 20.0 52 30.5 7.2 GC mrfa-026
127 CXOU J132538.2-425815 208.6 13 25 38.2 -42 58 15.8 131 107 11.4 GC mrfa-003
128 CXOU J132532.8-430429 208.8 13 25 32.9 -43 04 29.4 173 146.6 13.2
129 CXOU J132546.4-430036 209.2 13 25 46.5 -43 00 36.7 54 31.1 7.3
130 CXOU J132519.0-425759 211.5 13 25 19.1 -42 57 59.3 55 42.9 7.4
131 CXOU J132524.4-425735 216.1 13 25 24.4 -42 57 35.6 12 7.1 3.5
132 CXOU J132513.1-425841 216.5 13 25 13.2 -42 58 41.2 23 17.2 4.8
133 CXOU J13257.82-430059 217.3 13 25 07.8 -43 00 59.8 24 15.9 4.9
134 CXOU J132532.3-430441 218.7 13 25 32.3 -43 04 41.3 49 34.3 7.0
135 CXOU J132507.6-430115 219.1 13 25 07.7 -43 01 15.5 2028 1873 45.0 GC whh-8
136 CXOU J132516.0-430411 222.1 13 25 16.0 -43 04 11.1 31 17.2 5.6
137 CXOU J132547.6-430030 223.0 13 25 47.7 -43 00 30.7 89 45 9.4
138 CXOU J132543.2-425837 228.5 13 25 43.2 -42 58 37.6 152 120.9 12.3 GC pff-gc-062
139 CXOU J132509.3-425917 229.0 13 25 09.4 -42 59 17.6 78 45.4 8.8
140 CXOU J132521.8-430451 231.3 13 25 21.8 -43 04 51.2 120 70.1 11
141 CXOU J132512.0-425830 233.2 13 25 12.0 -42 58 30.7 63 33.6 7.9
142 CXOU J132512.3-425824 234.6 13 25 12.3 -42 58 24.5 82 56.4 9.1
143 CXOU J132547.1-430243 234.7 13 25 47.2 -43 02 43.6 181 151.7 13.5
144 CXOU J132514.8-430418 235.4 13 25 14.8 -43 04 18.0 89 35.8 9.4
145 CXOU J132538.8-430432 237.9 13 25 38.9 -43 04 32.1 32 17.5 5.7
146 CXOU J132522.3-425717 238.4 13 25 22.4 -42 57 17.4 914 845.7 30.2 GC mrfa-208
147 CXOU J132546.3-430310 239.1 13 25 46.4 -43 03 10.8 406 356.8 20.1 FS mrfa-93
148 CXOU J132509.2-425859 239.7 13 25 09.2 -42 58 59.5 682 594 26.1 GC mrfa-215
149 CXOU J132506.3-430221 244.4 13 25 06.3 -43 02 21.2 974 818.5 31.2
150 CXOU J132515.8-425739 245.6 13 25 15.8 -42 57 39.9 141 106.5 11.9
151 CXOU J132505.0-430133 248.9 13 25 05.0 -43 01 33.5 292 239.9 17.1
152 CXOU J132534.2-425709 249.9 13 25 34.3 -42 57 09.7 47 25.2 6.9
153 CXOU J132547.6-425903 252.6 13 25 47.6 -42 59 03.8 56 36.4 7.5
154 CXOU J132529.2-430521 253.4 13 25 29.2 -43 05 21.5 32 19.4 5.7
155 CXOU J132548.5-430258 254.6 13 25 48.6 -43 02 58.4 33 18.8 5.7
156 CXOU J132527.5-430525 256.5 13 25 27.6 -43 05 25.3 55 37.2 7.4
157 CXOU J132538.5-425720 258.0 13 25 38.6 -42 57 20.5 102 57.5 10.1
158 CXOU J132518.8-425708 258.7 13 25 18.9 -42 57 08.5 91 61.5 9.5
159 CXOU J132523.5-425651 260.7 13 25 23.5 -42 56 52.0 204 170.4 14.3
160 CXOU J132504.4-430008 261.5 13 25 04.4 -43 00 08.2 94 69.8 9.7
161 CXOU J132545.5-425815 261.7 13 25 45.5 -42 58 15.9 242 179.5 15.6
162 CXOU J132533.6-430525 265.1 13 25 33.7 -43 05 25.4 86 63.8 9.3 FS HD 116647 fs
163 CXOU J132548.5-430322 265.6 13 25 48.5 -43 03 22.8 56 41.8 7.5
164 CXOU J132539.8-430501 268.9 13 25 39.8 -43 05 01.9 100 86.8 10 GC pff-gc-111
165 CXOU J132547.2-425825 270.0 13 25 47.2 -42 58 25.6 179 139.7 13.4
166 CXOU J132538.0-430513 270.4 13 25 38.1 -43 05 13.6 98 82.2 9.9
167 CXOU J132526.1-425636 272.5 13 25 26.2 -42 56 36.7 184 139.6 13.6
168 CXOU J132549.4-425858 273.2 13 25 49.5 -42 58 58.4 34 16.6 5.8
169 CXOU J132535.2-430529 273.3 13 25 35.2 -43 05 29.0 18 14.2 4.2 GC whh-17
170 CXOU J132527.5-430549 281.1 13 25 27.6 -43 05 49.9 59 35.1 7.7
171 CXOU J132503.5-425928 282.5 13 25 03.5 -42 59 28.8 29 17.2 5.4
172 CXOU J132539.1-425654 284.3 13 25 39.1 -42 56 54.0 352 297.3 18.8
173 CXOU J132507.4-430409 285.5 13 25 07.5 -43 04 09.3 6878 6474.7 82.9 FS Kraft
174 CXOU J132553.5-430134 285.7 13 25 53.6 -43 01 34.9 73 44.4 8.5
175 CXOU J132546.7-425752 287.1 13 25 46.7 -42 57 52.6 90 40.5 9.5
176 CXOU J132502.7-430243 289.0 13 25 02.7 -43 02 43.5 2412 2257.9 49.1
177 CXOU J132532.7-425624 290.1 13 25 32.8 -42 56 24.2 165 115.8 12.8 GC pff-gc-056
178 CXOU J132512.0-425713 291.2 13 25 12.0 -42 57 13.3 29 21.9 5.4
179 CXOU J132555.1-430119 301.8 13 25 55.1 -43 01 19.2 198 153.7 14.1
180 CXOU J132538.4-425630 302.2 13 25 38.4 -42 56 30.8 150 100.3 12.2
181 CXOU J132520.2-425615 304.3 13 25 20.3 -42 56 15.4 42 32.2 6.5
182 CXOU J132552.2-425830 312.9 13 25 52.2 -42 58 30.7 71 21.6 8.4 GC pff-gc-072
183 CXOU J132554.6-425925 313.4 13 25 54.6 -42 59 25.8 1500 1311.5 38.7 GC pff-gc-131
184 CXOU J132549.7-430430 315.7 13 25 49.8 -43 04 30.3 26 18.5 5.1
185 CXOU J132556.8-430044 321.8 13 25 56.9 -43 00 44.8 319 244.3 17.9
186 CXOU J132546.5-425703 321.8 13 25 46.6 -42 57 03.4 638 487.2 25.3 GC pff-gc-168
187 CXOU J132549.1-430447 321.9 13 25 49.2 -43 04 47.3 60 37.2 7.7
188 CXOU J132508.2-430511 322.2 13 25 08.3 -43 05 11.3 364 189.8 19.1
189 CXOU J132509.5-430529 327.5 13 25 09.6 -43 05 29.6 538 418.6 23.2
190 CXOU J132534.4-425549 327.6 13 25 34.5 -42 55 49.8 239 164.9 15.5
191 CXOU J132518.5-425547 336.0 13 25 18.6 -42 55 47.8 10 6.4 3.2
192 CXOU J132553.4-425806 336.9 13 25 53.4 -42 58 06.5 106 40.4 10.3
193 CXOU J132512.8-430606 338.8 13 25 12.9 -43 06 06.6 43 25.1 6.6
194 CXOU J132547.3-425647 339.5 13 25 47.4 -42 56 47.4 144 70.8 12
195 CXOU J132539.4-425546 347.6 13 25 39.4 -42 55 46.3 94 38.9 9.7
196 CXOU J132543.9-430610 350.1 13 25 43.9 -43 06 10.0 146 132.4 12.1
197 CXOU J132507.7-425630 353.6 13 25 07.7 -42 56 30.5 70 56.3 8.4 GC mrfa-216
198 CXOU J132510.1-425608 356.5 13 25 10.2 -42 56 08.0 39 30.2 6.2
199 CXOU J132545.2-425604 360.4 13 25 45.2 -42 56 04.5 95 31 9.7
200 CXOU J132456.1-430258 362.3 13 24 56.1 -43 02 59.0 144 80.9 12
201 CXOU J132557.2-425822 364.8 13 25 57.2 -42 58 22.3 414 291.8 20.3
202 CXOU J132510.6-430624 366.3 13 25 10.7 -43 06 24.5 398 299.5 20
203 CXOU J132522.7-425502 370.6 13 25 22.7 -42 55 02.1 109 92 10.4
204 CXOU J132601.4-430043 372.3 13 26 01.5 -43 00 43.5 109 37.9 10.4
205 CXOU J132554.6-425720 374.0 13 25 54.6 -42 57 20.8 38 16.1 6.2
206 CXOU J132531.4-430720 374.2 13 25 31.4 -43 07 20.7 33 26.6 5.7
207 CXOU J132529.1-425447 381.9 13 25 29.2 -42 54 47.3 22 15.5 4.7
208 CXOU J132545.2-425530 389.6 13 25 45.2 -42 55 30.6 96 36.9 9.8
209 CXOU J132552.6-430545 389.6 13 25 52.6 -43 05 45.5 45 38.1 6.7 GC pff-gc-129
210 CXOU J132503.1-425625 390.5 13 25 03.1 -42 56 25.5 43 29 6.6 GC pff-gc-157
211 CXOU J132557.2-430450 393.1 13 25 57.2 -43 04 50.5 68 44.2 8.2
212 CXOU J132558.6-430430 395.6 13 25 58.7 -43 04 30.4 1259 1180.4 35.5
213 CXOU J132510.0-430655 396.1 13 25 10.1 -43 06 55.1 137 90.2 11.7
214 CXOU J132529.0-430744 396.2 13 25 29.0 -43 07 44.7 23 16.5 4.8
215 CXOU J132549.6-430624 397.9 13 25 49.7 -43 06 24.7 18 10.5 4.2
216 CXOU J132510.2-425510 405.4 13 25 10.3 -42 55 10.8 80 65 8.9
217 CXOU J132513.9-430725 405.7 13 25 14 -43 07 25.9 222 168.2 14.9
218 CXOU J132548.7-425530 409.8 13 25 48.8 -42 55 31.0 76 47.7 8.7
219 CXOU J132557.8-425702 413.6 13 25 57.9 -42 57 02.5 393 296.1 19.8
220 CXOU J132521.2-425413 420.9 13 25 21.3 -42 54 13.7 113 98.8 10.6
221 CXOU J132606.3-430112 424.8 13 26 06.4 -43 01 12.3 35 19.7 5.9
222 CXOU J132545.4-425451 424.9 13 25 45.4 -42 54 51.4 119 80.3 10.9
223 CXOU J132533.2-430810 426.3 13 25 33.2 -43 08 10.6 38 28.1 6.2
224 CXOU J132522.7-430822 436.7 13 25 22.7 -43 08 22.2 20 13.3 4.5
225 CXOU J132501.0-430643 443.8 13 25 01.1 -43 06 43.8 971 853 31.2
226 CXOU J132511.1-430755 445.1 13 25 11.2 -43 07 55.9 144 101.4 12
227 CXOU J132506.8-430736 449.7 13 25 06.8 -43 07 36.5 86 43.1 9.3
228 CXOU J132601.2-430528 450.3 13 26 01.2 -43 05 28.0 949 919.9 30.8
229 CXOU J132544.1-430804 453.4 13 25 44.1 -43 08 04.5 146 135.7 12.1
230 CXOU J132540.4-430820 453.7 13 25 40.5 -43 08 20.1 18 11 4.2
231 CXOU J132550.3-425441 460.3 13 25 50.3 -42 54 41.9 82 34.4 9.1
232 CXOU J132459.0-430648 462.6 13 24 59.0 -43 06 48.9 74 34.9 8.6
233 CXOU J132450.4-430452 464.9 13 24 50.4 -43 04 52.3 106 55.9 10.3
234 CXOU J132557.5-425531 470.6 13 25 57.5 -42 55 31.5 73 38.2 8.5
235 CXOU J132504.0-425431 474.2 13 25 04 -42 54 31.5 107 44.1 10.3
236 CXOU J132609.9-430310 479.6 13 26 09.9 -43 03 10.5 32 17.3 5.7
237 CXOU J132557.5-430659 479.6 13 25 57.5 -43 06 59.2 23 16.7 4.8
238 CXOU J132513.9-425331 481.3 13 25 13.9 -42 53 31.5 344 283.6 18.5
239 CXOU J132548.1-430817 483.9 13 25 48.1 -43 08 17.2 43 29.7 6.6
240 CXOU J132511.3-430843 488.6 13 25 11.3 -43 08 43.5 51 34.2 7.1
241 CXOU J132542.0-425323 491.9 13 25 42.0 -42 53 23.1 26 16.6 5.1
242 CXOU J132510.3-425333 493.4 13 25 10.4 -42 53 33.2 415 334.4 20.4
243 CXOU J132611.8-430242 494.0 13 26 11.9 -43 02 42.9 280 247 16.7
244 CXOU J132535.1-425301 494.1 13 25 35.2 -42 53 01.7 246 233.2 15.7
245 CXOU J132546.7-425340 495.2 13 25 46.7 -42 53 40.1 209 118.5 14.5
246 CXOU J132502.9-425413 496.3 13 25 02.9 -42 54 13.2 307 211.7 17.5
247 CXOU J132605.5-425632 499.4 13 26 05.5 -42 56 32.5 191 132.7 13.8 GC pff-gc-122
248 CXOU J132555.4-430745 500.7 13 25 55.5 -43 07 45.8 29 20.6 5.4
249 CXOU J132614.1-430208 513.4 13 26 14.1 -43 02 08.6 73 55.6 8.5
250 CXOU J132511.0-425257 523.7 13 25 11.0 -42 52 57.8 50 26.5 7.1
251 CXOU J132527.3-430953 524.3 13 25 27.3 -43 09 53.1 61 48 7.8
252 CXOU J132458.9-430831 542.7 13 24 58.9 -43 08 31.3 167 86.8 12.9
253 CXOU J132456.7-430813 543.0 13 24 56.8 -43 08 13.7 798 594.6 28.3
254 CXOU J132539.2-430957 543.6 13 25 39.2 -43 09 57.3 38 24.9 6.2
255 CXOU J132615.9-425846 548.4 13 26 15.9 -42 58 46.8 530 392.4 23
256 CXOU J132546.4-430937 549.4 13 25 46.5 -43 09 38.0 119 102.7 10.9
257 CXOU J132450.4-430722 553.0 13 24 50.5 -43 07 22.9 271 151.4 16.5
258 CXOU J132557.4-425342 553.8 13 25 57.5 -42 53 42.2 282 136.4 16.8 FS GF Blue 1
259 CXOU J132525.9-425152 556.4 13 25 26.0 -42 51 52.7 160 96.2 12.7
260 CXOU J132549.3-425241 560.6 13 25 49.3 -42 52 41.4 897 757.4 30
261 CXOU J132503.1-430924 563.6 13 25 03.1 -43 09 24.3 163 85.2 12.8
262 CXOU J132510.9-425214 564.4 13 25 11.0 -42 52 14.8 109 56.3 10.4
263 CXOU J132534.0-431030 565.8 13 25 34.0 -43 10 30.2 46 34.5 6.8
264 CXOU J132613.0-425632 569.9 13 26 13.1 -42 56 32.9 142 68.8 11.9
265 CXOU J132620.4-425947 585.6 13 26 20.5 -42 59 47.2 142 78.6 11.9
266 CXOU J132619.7-430318 586.0 13 26 19.7 -43 03 18.8 75 52.7 8.7
267 CXOU J132454.4-425326 588.5 13 24 54.4 -42 53 26.8 65 35.2 8.1
268 CXOU J132541.7-425137 592.0 13 25 41.7 -42 51 37.3 24 18 4.9
269 CXOU J132541.9-431041 593.6 13 25 41.9 -43 10 41.4 642 610.1 25.3 GC pff-gc-188
270 CXOU J132544.2-425141 595.8 13 25 44.3 -42 51 41.7 18 12.9 4.2
271 CXOU J132548.4-425156 597.4 13 25 48.5 -42 51 56.9 25 20.8 5
272 CXOU J132531.0-431105 597.7 13 25 31.0 -43 11 05.3 152 139.1 12.3 GAL pff-qso-6
(1) – the sequence number;
(2) – CXO source name, according to the CHANDRA-discovered source naming convention;
(3) – distance from the center in arcsec;
(4),(5) – right ascension and declination, J2000;
(6) – total number of counts in the wavdetect source cell, source+background;
(7) – number of source counts after background subtraction
(8) – statistical error on the number of source counts after background subtraction;
(9) – X-ray luminosity, 0.5–8 keV, assuming 3.5 kpc distance;
(10) – source type: GC – confirmed globular cluster, FS – foreground star,
GAL – background galaxy, Hα – Hα emmitter;
(11) – precise identification and reference:
pff – Peng et al. (2004), Tables 5 and 9; mrfa – Minniti et al. (2003), Tables 1 and 3;
whh – Woodley et al. (2005) Tables 1 and 2 ; GF – Graham & Fasset (2002) Table 1;
Kraft – Kraft et al. (2001) Sect. 5.1; HD – Roeser et al. (1991).
Comments: Source #121 was designated a globular cluster by Minniti et al. (2003), but
according to Woodley et al. (2005) it is a background galaxy; Minniti et al. (2003) claim to
have removed sources with Hα-emission from their list of globular
clusters. However two sources (#54 and #108 in our source list) are both
listed as Hα-emitters and globular clusters in their tables. We
assume that they are Hα sources and designate them accordingly.
Sources #146, #148 and #197 are included in the list of globular
clusters of Minniti et al. (2003), although no colours are available. They are
marked as globular cluster in the Table.