The red optical afterglow of GRB 030725
We present a photometric study of the optical counterpart of the long-duration Gamma Ray Burst (GRB) 030725, which triggered the HETE FREGATE and WXM instruments on July 25th, 2003, and lasted more than 160s. An optical counterpart was identified at the Bronberg Observatory in South Africa about 7 hours after the burst occurred. The optical afterglow (OA) was observed between 4 and 15 days after the burst with the 1.54m Danish telescope at La Silla in the V, , and bands. We fit a broken power law to the data and determine a break time in the light curve between 16 hours and 4.7 days after the first detection of the burst. The decay slope is before and after the break. A bump may be present in the light curve, only significant at the 2 level, 13.9 days after the main burst. The spectral slope of the OA, measured 12 days after the burst, is , i.e. it falls in the extreme red end of the distribution of previous OA spectral slopes. Observations of the field 8 months after the burst with the EMMI instrument on the NTT telescope (La Silla) resulted in an upper limit of =24.7 mag for the host galaxy of GRB 030725. The OA of GRB 030725 was discovered at a private, non-professional observatory and we point out that with the current suite of gamma ray satellites, an effort to organize future contributions of amateur observers may provide substantial help in GRB light curve follow up efforts.
Key Words.:
Gamma rays: bursts – Stars: Supernovae: General – Techniques: photometric1 Introduction
Gamma Ray Bursts (GRBs) are powerful explosions in the -ray band, with an emission which can peak up to a few MeV and a duration that varies between a few seconds up to hundreds of seconds (long GRBs). Since 1997, when the first optical counterpart was detected (Costa et al. (1997); van Paradijs et al. (1997)), several satellites have been launched to study GRBs and for half of the well localized GRBs, an optical afterglow (OA) has been discovered. As of today, there are about 60 detected GRB afterglows in the optical/IR bands. Detailed studies of GRB optical counterparts provide unique information on the characteristics of the medium in which the afterglow evolves, the jet structure of the emitting region and the energy associated with the main burst. Nevertheless, a larger and well defined statistical sample of well observed optical afterglows is necessary in order to address some still open questions concerning the universal structure of the jet-like emitting region and a quasi-standard energy reservoir (Frail et al. (2001); Berger et al. (2003); Ghirlanda et al. (2004)), and the environment in which GRBs occur (Yost et al. (2003)).
With the current suite of satellites, HETE-2, INTEGRAL and Swift, the rate of detected GRBs will reach an average of about 1 GRB every 3 days. Unless, however, the number of hours allocated to ground based optical follow-up will show a matching increase (about a factor of 10), the build-up of the statistical sample will not proceed with the necessary speed, and many suitable afterglows will pass unobserved. Such a large increase is not realistic, and we must either explore alternative solutions or accept the loss of this opportunity to significantly increase our statistical sample.
One possible alternative is to appeal to non-professional astronomers. The commonly used term “amateur astronomers” does not properly describe the high quality of the equipment which is often available at non-professional observatories, and historically amateurs have made important contributions in the fields of Solar System and variable star studies. The large number of existent small private observatories could make significant contributions to GRB research in the fields of identification and high frequency early light curve sampling, the latter requiring that a suitable calibration of their data is available. In such a scheme a statistical sample of well documented GRB light curves could be created faster, and the professional GRB community would be free to be more selective in their follow-up strategy. GRB 030725 is the first GRB optical afterglow to be discovered from a non-professional observatory, and therefore serves as evidence that there is a valuable potential in the collaboration between amateurs and professionals in this field.
GRB 030725, a bright long hard burst, was detected by the FREGATE and WXM instruments on board of the HETE-2 satellite on July 25th, 2003 (Shirasaki et al. (2003)). It had a fluence of in the 30-400 keV band, and a fluence of in the 7-30 keV band. It showed a two peak shape, each peak with a FRED (Fast Rise Exponential Decay)-like structure. The first peak lasted about 40 s, and after about 160 s the second peak occurred with a duration of10 s. No detection of an afterglow in the X-ray or radio bands has been reported.
In this article we present the results of the photometric analysis of the optical afterglow of GRB 030725. The data were collected between 0.30 and 14.87 days after the main burst. We also observed the same field 8 months after the GRB occurred and obtained a limit on the magnitude of the GRB 030725 host galaxy in the -band.
2 Observations and data reduction
The optical afterglow of GRB 030725, located at R.A.= and Dec. = (J2000), with an error of , was identified with the Bronberg 0.3m telescope approximately 7 hours after the trigger (Monard 2003), and a total of three exposures were obtained during the first night. Table 2 provides a log of those observations as well as of the later observations obtained with the 1.54m Danish telescope (1.54mD) on La Silla (Vinter et al. (2003)). Observations at the 1.54mD commenced 3.88 days after the burst during a period of adverse seeing conditions, and continued over the following 11 nights.
The Bronberg telescope is equipped with a direct CCD camera (SBIG ST-7E) with 765 x 510 pixel CCD, providing an 18 arcmin E-W 12.5 arcmin N-S field of view, with a pixel scale of 1.52 arcsec per pixel. The camera operates in unfiltered mode only.
The DFOSC on the 1.54mD is equipped with the MAT/EEV CCD 44-82 ”Ringo” camera, a pixel scale of 0.39 arcsec/pixel, and a corresponding field size of . Because the Bronberg data were unfiltered we needed to define an accurate calibration sequence with the 1.54mD in order to combine the two data sets. We therefore first describe the reduction and calibration of the 1.54mD data, but will subsequently return to the 0.3m data.
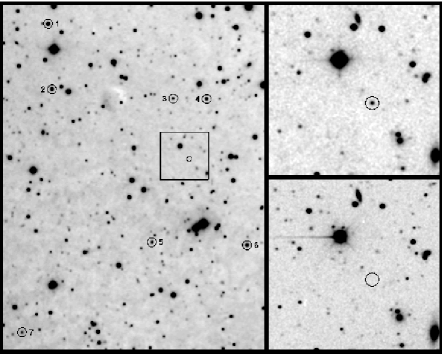
The attempt to detect the host galaxy of GRB 030725 was performed with the NTT telescope at La Silla. Fig. 1 shows (left panel and right upper panel), the field of the GRB 030725 observed with the 1.54mD telescope on La Silla 3 days after the burst occurred. The right lower panel shows the same field observed with the 3.5m ESO-NTT telescope on La Silla, 8 months after the trigger.
2.1 1.54mD data reduction and calibration
The data from the 1.54mD telescope in the V, , and bands were processed using standard IRAF111IRAF is distributed by the National Optical Astronomical Observatory, which is operated by the Association of Universities for Research in Astronomy, Inc., under cooperative agreement with the National Science Foundation. tasks for bias-subtraction and flat-fielding. The photometry was performed using the DAOPHOT package in IRAF (Stetson (1987); Stetson (1997)).
We performed aperture and PSF photometry on both the optical afterglow (OA) and 7 isolated, bright unsaturated field stars which were used as reference stars for the relative photometry. These stars are shown in the left panel of Fig. 1 and their corresponding magnitudes are shown in Table 1. To calibrate the light curve of the OA in the -band, two standard fields, MarkA and SA110, were chosen from the Landolt catalogue of standard stars. These two fields were observed in the B, V, and bands. The corresponding calibrated magnitudes of the optical afterglow in the V, and bands with the 1.54mD telescope are shown in Table 2.
-
1 Unfiltered data calibrated to the -band
2.2 The Bronberg data
The first detection of the OT of GRB 030725 was obtained seven hours after the main burst occurred using unfiltered CCD imaging with an “amateur” telescope at the Bronberg Observatory. No photometric standards were obtained with the same instrument. Potentially the very wide response of unfiltered data could introduce severe colour terms which would make it difficult to combine the unfiltered data with the later -band data. However, the large gap in time between the Bronberg and 1.54mD data renders the first three data points important in the determination of the decay parameters, and for this reason we went through a detailed calibration procedure aimed at determination of zero-point and colour terms of the unfiltered data.
We followed a procedure very similar to that used for the photometric analysis of GRB 020813 by Li et al. (2003). We selected 16 isolated stars which were unsaturated in both the 3 unfiltered images and the 4 short exposure data in the B, V, and bands. For each of these 16 stars the calibrated colours B-V, V-, and -, as well as the unfiltered colours B-Unf, -Unf, -Unf, and V-Unf were computed. It turned out that the smallest gradients were found for -Unf, indicating that the effective central wavelength of Unf is close to that of . Because the unfiltered colour - Unf showed to be rather independent of each of the calibrated colours for all the selected stars, we concluded that the -band was the one which best reproduced the unfiltered data.
The OA -band magnitudes inferred from the calibrated unfiltered data are shown in the upper part of Table 2.
2.3 The host galaxy
The study of GRB host galaxies is an important step to determine GRB redshifts and to study the environment in which GRBs occur (Jakobsson et al. (2003)).
An attempt to detect the host galaxy of GRB 030725 was done on March 22, 2003, about 8 months after the main burst. The field in which the GRB OA was first detected was observed with the ESO NTT 3.5m telescope on La Silla. We used the red arm of the EMMI instrument in the -band and obtained 3 exposures, each of 600 seconds, with a seeing of 0.6 arcsec. The data were processed using standard bias-subtraction and flat-field techniques and the photometry was computed using the same procedure described in the previous paragraph. There is no detection of the host galaxy and we compute a 2-sigma upper limit of 24.7 magnitudes in the -band for the GRB host galaxy.
3 Light curve and spectral slope
Many theoretical models have been developed to describe the spectral and temporal evolution of GRB afterglows (Sari et al. (1998); Pugliese et al. (1999); see also Zhang and Mészáros (2004) for a comprehensive review). Each of these models assumes that the afterglow is created when relativistic particles are accelerated at the shock front between the flow generated by the GRB explosion and the interstellar medium (ISM), and emit synchrotron radiation visible in different bands. The distribution of the relativistic electrons is assumed to be a power-law, , where is the Lorentz factor. One of the main parameters which varies among all the theoretical models is the value assumed for , the exponent of the electron distribution, whose range is generally chosen between 1 and 2.5, (van Paradijs et al. (2000)). Correspondingly, each model will obtain different power-laws for the decay of the afterglow, which is well represented by the formula , with .
3.1 The light curve: Comparison with theoretical models
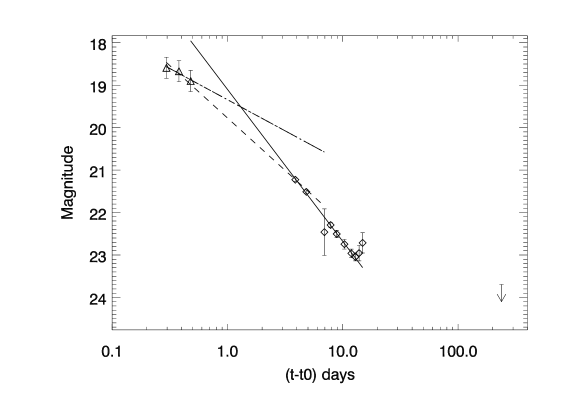
The light curve of GRB 030725 in the -band is shown in Fig. 2. The data points fall in two groups, where the second group (1.54mD data) covers the longest span in time, and has the smallest error bars. Except for a possible upturn, or “bump” (see below), seen in the last few data points, this part of the curve is well fitted by a power-law with slope . The slope of the three early data points alone is less well determined () but this can be further constrained by considering the break time.
It is clear that a break must have occurred, but we are left with two possibilities. In case the break occurred earlier than 3.88 days after the burst then the early power-law is the one stated above, with the additional limit that . If the break occurred later than 3.88 then the first 1.54mD data point falls within the pre-break light curve, and we find . Both scenarios are consistent with the data and both fits are shown in Fig. 3. We conclude that the break occurred before 4.7 days, and that the early power law had a slope flatter than , i.e. . For the purpose of determining the break time we only consider negative values of .
Breaks have been observed in the light curve of many afterglows (see Piran (2004) for an extensive review), and one of the possible explanations is related to an emitting region with a jet-like structure. According to this model, as long as , where and are the relativistic beaming factor and the opening angle of the emitting region respectively, it will not be possible to distinguish between a spherical or a collimated emitting region. But when , then the jet structure will become visible and this will correspond to a break in the power-law decay of the light curve.
In the case of GRB 030725, the lack of data between 0.48 and 3.88 days, did not allow an accurate estimate of the time of the break and the slope of the early power-law decay. Many models predict a change of slope between a few hours up to a few days after the main burst, consistent with our upper limit of 4.7 days (observers frame). The allowed range of reported above is in good agreement with slopes observed in other afterglows, , while the slope of the light curve after the break is in the extreme flat end of the distribution of other afterglows , (Andersen et al. (2000)).
If the break in the light curve of GRB 030725 is related to the presence of a collimated outflow, then the jet structure appeared between 16 hours and 4.7 days after the main burst, and , the exponent of the power law distribution of electrons, should be less than 2. The lack of data during the first few days after the burst did not allow us to give a more accurate interpretation of this break.
3.2 The light curve: A late time bump?
Inspection of Fig. 2 shows suggestive evidence of an “upturn” in the light curve after 13 days (observer frame). Such late time bumps in the light curves have been observed on several occasions, e.g. GRB 980326 which showed a red bump about 3 weeks after the burst (Bloom et al. (1999)); (Castro-Tirado and Gorosabel (1999)), GRB 011121 with a bump whose peak occurred between 13 and 75 days after the first -ray observation (Bloom et al. (2002)), GRB 020405 with evidence of a red late bump between 10 and 25 days after the main burst (Price et al. (2003)), GRB 021211 which showed the bump 27 days after the main burst (Della Valle et al. (2003)), and GRB 041006 with evidence of a bump 4 days after the burst (Stanek et al. (2005); see Zeh et al. (2004) for a comprehensive review). For these GRBs the bump features were identified as SN contributions.
To test if our data support the presence of a SN we performed minimum two component model fits to the light curve where one component was a power law (the GRB) and the other was one of three historical SN light curves redshifted to a set of different redshifts (SN1994I, SN1998bw, and SN2002ap (Soderberg et al. (2005))). None of the models including SN templates provided a significantly better fit than the fit of a pure power law, so we conclude that there is no significant evidence that the marginal (2 ) upturn after 13 days can be identified with a SN bump.
3.3 Spectral slope
The OT was detected in three bands (V, , ) 12–13 days after the burst. On the assumption that the decay was monochromatic, we computed (including corrections for Galactic reddening), V- and (two sided errors computed using ML techniques, see Appendix A in Fynbo et al. (2002)). In order to compute the spectral slope (, ) we transformed the V, , magnitudes to the AB system using the offsets to the AB system given in Fukugita et al. (1995) and fit a linear relation to corresponding values of and AB. Here is the central frequency for the filters. In this way we infer a spectral slope of . Even allowing for the rather large error bar, this value is in the extreme red end of the distribution of spectral slopes, where the typical value is around 1 and a few limit cases around 2 (Smon et al. (2001)). We note that the OT colour was obtained 12 days post-burst, so we can interpret it as either the result of significant extinction due to dust in the host galaxy, or the result of a contribution from an underlying SN, or the GRB occurred at a high redshift.
4 Summary and discussion
Since the discovery of the first GRB optical counterpart in 1997, about 300 GRBs have been detected by several satellites, but only for about 25% of them has an optical afterglow been detected (from webpage: http://www.mpe.mpg.de/jcg/grbgen.html). For even smaller percentage, about 15% of the total detected GRBs, the redshift has been determined and only a few of these showed a late time bump in the optical light curve.
GRB 030725 was a long hard GRB with a slope of the early time optical light curve, a break between 16 hours and 4.7 days after the main burst, and a slope after the break. On the assumption that the break is related to a collimated outflow, and using the relation between the opening jet angle and the time in which the break in the light curve occurs (Pugliese et al. (1999)), we find jet opening angles of and , at 16 hours and 4.7 days respectively.
We detected a weak feature of a late time upturn in the light curve 14 days after the burst and tried to model it with the contribution from SNs at different redshifts, using SN1994I, SN1998bw, and SN2002ap as templates. We found that none of these SNs provided a better fit to the data than a simple power law.
We did an attempt to detect the host galaxy of GRB 030725 about 8 months after burst, and we derived a 2-sigma upper limit of =24.7 mag for the GRB host galaxy.
We determined the colours of GRB 030725 ( and ) corresponding to a spectral slope of . This is significantly redder than the majority of GRB OAs (Smon et al. (2001)). The characteristics of the environment in which GRB occur are still an open question, (Berger et al. (2002); Fynbo et al. (2003); Castro Cerón et al. (2004); Tanvir et al. (2004)), but so far no GRB OA was found with such a steep spectral slope. This redder slope could be due to either high redshift, or contribution from an underlying SN, or dust absorption in the host galaxy. Some authors (Hjorth et al. (2003); Prochaska et al. (2004); Vreeswijk et al. (2004)) have shown that some GRB host galaxies have a rather low amount of dust and a rather low metallicity. The environment of GRB 030725 could be very dense along the line of sight to the GRB itself. Further observations in IR to mm wavelength bands would be interesting as they would allow us to better understand the nature of this spectral slope.
Acknowledgements.
We thank IJAF for the allocation of observing time at the Danish 1.54 m telescope on La Silla. We also thank S. S. Larsen for the NTT data of the observation of GRB 030725 field in March 2004. G.P. thanks ESO DGDF fundings for supporting this research. The research of J. Gorosabel is supported by the Spanish Ministry of Science and Education through programs ESP2002-04124-C03-01 and AYA2004-01515 (including FEDER funds). BLJ acknowledges support from the Instrument Centre for Danish Astrophysics (IDA) and the Nordic Optical Telescope (NOT).References
- Andersen et al. (2000) Andersen, M. I., Hjorth, J., Pedersen, H. et al. 2000, A&A, 364, L54
- Berger et al. (2002) Berger, E., Kulkarni, S. R., Bloom, J. S. et al. 2002, ApJ, 581, 981
- Berger et al. (2003) Berger, E., Kulkarni, S. R., Pooley, G. et al. 2003, Nature, 426, 154
- Bloom et al. (1999) Bloom, J. S., Kulkarni, S. R., Djorgovski, S. G. et al. 1999, Nature, 401, 453
- Bloom et al. (2002) Bloom, J. S., Kulkarni, S. R., Price, P. A. et al. 2002, ApJ, 572, L45
- Castro Cerón et al. (2004) Castro Cerón, J. M., Gorosabel, J., Castro-Tirado, A. J. et al. 2004, A&A, 424, 833
- Castro-Tirado and Gorosabel (1999) Castro-Tirado, M., & Gorosabel, J. 1999, A&AS, 138, 455
- Costa et al. (1997) Costa, E., Frontera, F., Heise, J. et al. 1997, Nature, 387, 783
- Della Valle et al. (2003) Della Valle, M., Malesani, D., Benetti, S. et al. 2003, A&A, 406, L33
- Frail et al. (2001) Frail, D., Kulkarni, S. R., Sari, R. et al. 2001, ApJ, 562, L55
- Fukugita et al. (1995) Fukugita, M., Shimasaku, K., & Ichikawa, T. 1995, PASP, 107, 945
- Fynbo et al. (2002) Fynbo, J. U., Møller, P., Thomsen, B. et al. 2002, A&A, 388, 425
- Fynbo et al. (2003) Fynbo, J. U., Jakobsson, P., Møller, P. et al. 2003, A&A, 406L, 63
- Ghirlanda et al. (2004) Ghirlanda, G., Ghisellini, G., Lazzati, D. 2004, ApJ, 616, 331
- Hjorth et al. (2003) Hjorth, J., Møller, P., Gorosabel, J. et al. 2003, ApJ, 597, 699
- Jakobsson et al. (2003) Jakobsson, P., Hjorth, J., Fynbo, J. P. U. et al. 2003, A&A, 408, 941
- Li et al. (2003) Li, W., Filippenko, A. V., Chornock, R., Jha, S. 2003, PASP, 115, 844
- Monard (2003) Monard, B. 2003, GCN Circular No. 2324
- Piran (2004) Piran, T. 2004, Rev. of Modern Physics, accepted, astro-ph/0405503
- Price et al. (2003) Price, P. A., Kulkarni, S. R., Berger, E. et al. 2003, ApJ, 589, 838
- Prochaska et al. (2004) Prochaska, J. X., Bloom, J. S., Chen, H.-W. et al. 2004, ApJ, 611, 200
- Pugliese et al. (1999) Pugliese, G., Falcke, H., Biermann, P. L. 1999, A&A, 344, L37
- Sari et al. (1998) Sari, R., Piran, T., Narayan, R. 1998, ApJ, 497, L17 1998, ApJ, 500, 525
- Shirasaki et al. (2003) Shirasaki, Y., Tamagawa, T., Suzuki, M. et al. 2003, GCN Circular No. 2322
- Smon et al. (2001) Smon, V., Hudec, R., Pizzichini, G., & Masetti, N. 2001, A&A, 377, 450
- Soderberg et al. (2005) Soderberg, A. M., Kulkarni, S. R., Fox, D. B. et al. 2005, submitted to ApJ, astro-ph/0502553
- Stanek et al. (2005) Stanek, K. Z., Garnavich, P. M. , Nutzman, P. A. et al. 2005, ApJ Letters accepted, astro-ph/0502319
- Stetson (1987) Stetson, P. 1987, PASP, 99, 191S
- Stetson (1997) Stetson, P. 1997, “User’s Manual for DAOPHOT II”
- van Paradijs et al. (1997) van Paradijs, J., Groot, P.J., Galama, T. et al. 1997, Nature, 386, 686
- van Paradijs et al. (2000) van Paradijs, J., Kouveliotou, C., & Wijers, R.A.M.J. 2000, ARA&A, 38, 379
- Tanvir et al. (2004) Tanvir, N. R., Barnard, V. E., Blain, A. W. et al 2004, MNRAS, 352, 1073
- Vinter et al. (2003) Vinter, C., Jorgensen, S., Gorosabel, J. et al. 2003, GCN Circular No. 2335
- Vreeswijk et al. (2004) Vreeswijk, P. M., Ellison, S. L., Ledoux, C. et al. 2004, A&A, 419, 927
- Yost et al. (2003) Yost, S., Harrison F. A., Sari, R., Frail, D. A. 2003, ApJ, 597, 459
- Zeh et al. (2004) Zeh, A., Klose, S., Hartmann, D. H. 2004, ApJ, 609, 952
- Zhang and Mészáros (2004) Zhang, B. & Mészáros, P. 2004, Int.J.Mod.Phys., A19, 2385