Radio Observations of the Hubble Deep Field South
region:
I. Survey Description and Initial Results
Abstract
This paper is the first of a series describing the results of the Australia Telescope Hubble Deep Field South (ATHDFS) radio survey. The survey was conducted at four wavelengths 20, 11, 6, and 3 cm, over a 4-year period, and achieves an rms sensitivity of about 10 Jy at each wavelength. We describe the observations and data reduction processes, and present data on radio sources close to the centre of the HDF-S. We discuss in detail the properties of a subset of these sources. The sources include both starburst galaxies and galaxies powered by an active galactic nucleus, and range in redshift from 0.1 to 2.2. Some of them are characterised by unusually high radio-to-optical luminosities, presumably caused by dust extinction.
1 Introduction
Following the success of the original Hubble Deep Field project in the northern sky (HDF-N; Williams et al. (1996)) the WFPC2, STIS and NICMOS instruments of the Hubble Space Telescope (HST) were used to produce very deep images of a corresponding southern sky region - the ‘Hubble Deep Field South’ (HDF-S; Williams et al. 2000). The HDF-S differs from the HDF-N in that a field was chosen near a bright, high redshift (z=2.24) quasar to enable a study of the intervening intergalactic medium (Outram et al., 1999).
Both Hubble Deep Fields have provided a focus for a wide range of research, and extensive ground-based observations have complemented the optical and infrared images obtained by the HST, leading to significant advances in our understanding of the evolution of the Universe. However, most of these observations were conducted at optical and infrared wavelengths.
Radio observations occupy an important observational niche as they probe physical conditions that are faint or unobservable at optical/infrared wavelengths, and they are also unaffected by dust extinction. The HDF-N has been studied in detail at radio wavelengths using deep Very Large Array (VLA) observations (Richards et al., 1998; Richards, 2000) resulting in the most sensitive radio images to date, reaching an rms sensitivity of 4 Jy at 20 cm, and 1.6 Jy at 3 cm.
At high flux density levels, radio source surveys are generally dominated by radio-loud active galaxies and quasars. However, at Jy levels, the source counts are increasingly dominated by a population of starburst galaxies (Hopkins, Afonso, Cram, & Mobasher, 1999), which are generally believed to be high-redshift (and in some cases higher-luminosity) counterparts to the ultra-luminous infrared galaxies typified by Arp220. Muxlow et al (2000) have shown that, in their sample, 70% of the Jy sources are starburst-type sources lying at redshifts between z 0.4 and 1.0. Another 20% are low-luminosity AGNs in elliptical galaxies at z 1. The remaining 10% of Jy sources have optically-faint hosts, close to or beyond the HDF-N limit.
Further support for both starburst and AGN processes, based on observations at radio, far-infrared (FIR) and submillimetre (submm) wavebands, have been given by Barger, Cowie, & Richards (2000), Afonso, Mobasher, Chan, & Cram (2001), Brusa et al. (2002), Chapman et al. (2003), Bergström & Wiklind (2004), and Georgakakis et al. (2004). These observations suggest that there is a large population of highly-obscured, but very active galaxies at z = 1–5 which is responsible for producing the bulk of the extragalactic background in the FIR/submm region. These galaxies may host the major sites of massive star formation and fuelling of active galactic nuclei (AGN) at high redshifts. Moreover, there is tentative evidence that these galaxies are strongly clustered, with a correlation-length exceeding any other known high-z population (Blain, Chapman, Smail, & Ivison, 2004; Stevens et al., 2003). These results hint at a direct link between these dusty, high-redshift galaxies and the growth of large scale structure in the early Universe, which may be the origin of the basic environmental variations of galaxy properties (e.g. morphologies, stellar ages) seen in the modern Universe.
Our understanding of these phenomena requires sensitive radio observations, extending to the limits of current instrumentation, together with equally sensitive observations at other wavelengths. The combination of deep radio observations, deep HST observations, and deep observations at other wavelengths, provides a remarkable opportunity in the Hubble Deep Fields to study the evolution of these galaxies. This is the first of a series of papers presenting results from our deep radio survey of the HDF-S made with the Australia Telescope Compact Array (ATCA). The principal goals of this survey are to:
-
•
Use source counts together with redshifts to study the cosmological evolution of the star formation rate, the evolutionary history of galaxies, and the origin of current stellar populations.
-
•
Understand the evolutionary relationship between galaxies and AGN and trace the development of supermassive black holes.
-
•
Trace the changing balance between obscured and unobscured activity over the lifetime of the Universe. Obscured activity produces no more than 30% of the total bolometric luminosity in the local Universe, whereas it has been suggested that high-redshift obscured activity might account for 90% of the detected luminosity. We also need to relate this transformation to the changing roles of star formation and AGN activity.
Paper 1 (this paper) describes the observations and data reduction, presents the radio data at all four wavelengths in the inner region of the HDF-S, and discusses a representative subset of sources in this region in some detail.
Paper 2 (Huynh et al., 2005a) presents the extended 20 cm observations and catalogue of detected sources, and analyses the differential radio source counts.
Paper 3 (Huynh et al., 2005b) presents the extended 13, 6, and 3 cm observations, and discusses radio spectral indices and individual radio sources in the field.
Paper 4 (Huynh et al., 2005c) presents optical identifications, classification, and redshifts, and discusses the implications for the radio luminosity function, and the cosmological evolution of the star formation rate.
Throughout this paper, we use the following cosmological parameters: , =0.27 and =0.73.
2 Observations
2.1 Observations of HDF-S Candidate Fields
As part of the field selection process for the HDF-S, prior to the HST observations, we observed candidate fields with the ATCA to ensure that the selected field had no strong radio sources that would prevent deep radio imaging to complement the deep optical image. At the same time, the candidate fields were searched by other groups to find a high-redshift quasar, and were studied at other wavelengths to search for extinction or infrared cirrus.
In May 1997, we made ATCA observations of eight candidate fields at 21 cm. All fields were observed in a single 12-hour run in a snapshot observing mode. Each image covered a 68-arcmin square field, with the central 34 arcmin square being the primary candidate area. Table 1 shows the field centres and the resulting source statistics.
Our results showed that the only detected quasar (which we identify
below as
ATHDFS_J223337.5-603329 ) was only 10 arcmin from a strong radio source
(identified in Paper 2 as
ATHDFS_J223355.6604315), presenting the risk that dynamic range
limitations might reduce the sensitivity available at radio wavelengths.
However, it was judged that this source would not degrade the radio
observations sufficiently to justify moving the HDF-S to another
candidate field, provided the precise location of the HDF-S was chosen
to avoid the radio source whilst keeping the quasar within the field.
The position of the HDF-S was selected accordingly, and the results
presented here confirm the wisdom of that decision.
2.2 Survey Observations
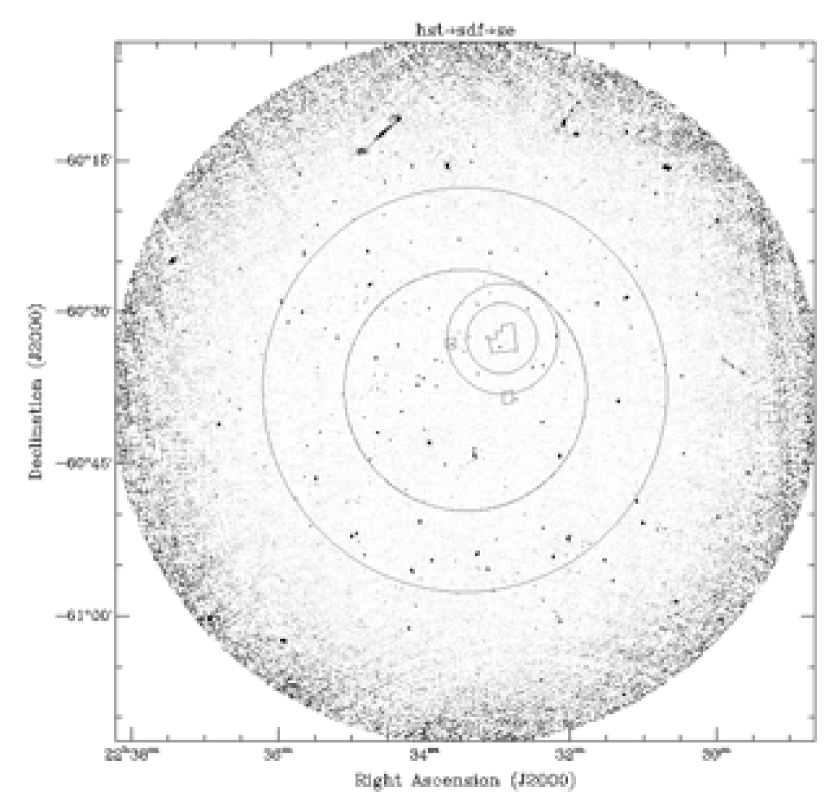
We imaged the HDF-S using the ATCA at four wavelengths: 20, 11, 6 and 3 cm, obtaining resolutions of 6, 4, 2 and 1 arcsec respectively. Observations were taken over a period of four years from mid 1998 to late 2001, in a variety of configurations to maximise uv coverage (i.e. sampling of the Fourier plane). The shortest baseline was 31 m, and the longest 6000 m. Table 2 summarises the observations, and Figure 1 shows the pointing centres. A single pointing centre was used at each wavelength, rather than a mosaic, to maximise the sensitivity that might be obtained in the available observing time.
The pointing centres differ at the four frequencies because of the different primary beam size at the four wavelengths, and thus the different strategies necessary to deal with the strong confusing source ATHDFS_J223355.6604315 with S= 155 mJy. At 6 and 3 cm the observations are centred on the WFPC2 field, so that the strong source is well outside the primary beam. At 20 cm and 11 cm the pointing centre (RA = 22h 33m 37.6s and Dec = 60∘ 33’ 29” (J2000) ) was chosen to be approximately half-way between the WFPC2 field and ATHDFS_J223355.6604315. This ensures that the strong source is well inside the primary beam to minimise calibration problems.
Throughout the observations, the correlator was used in continuum mode ( MHz bandwidth), with each 128 MHz band divided into MHz channels, and all four Stokes parameters were measured. This correlator configuration achieves the highest sensitivity, but at the price of higher resolution spectral information. All observations were made with two 128 MHz bands. In some cases, these two bands were assigned to adjacent observing frequencies (e.g. 1344 and 1472 MHz), and in others, they were assigned to widely separated bands (e.g. 1384 and 2368 MHz) to minimise contamination by interference. In Table 2 the total hours column is the total amount of time spent on each 128 MHz band, and should be halved to give an equivalent observing time with two 128 MHz bands.
The primary flux density calibrator used was PKS B1934-638, which is the standard calibrator for ATCA observations ( Jy at 1.380 GHz; Reynolds (1994) ). We calibrated the complex antenna gains by frequently (typically every 20-40 minutes, depending upon atmospheric phase stability) observing the secondary calibrators PKS B2205-636 and PKS B2333-528. The resulting phase errors are typically at the level of a few degrees before self-calibration, and are not a significant limiting factor in the resulting images.
3 Data Reduction
3.1 Imaging
We used the Australia Telescope National Facility (ATNF) release of the MIRIAD (Sault, Teuben, & Wright, 1995) software to reduce our data, and based our imaging and source extraction process on the procedure outlined by Prandoni et al. (2000).
Because of the large observing bandwidth ( MHz), the multi-frequency synthesis (Sault & Wieringa, 1994) technique was necessary to improve uv-coverage and reduce bandwidth smearing. This technique makes a single image from multi-frequency data by gridding each spectral channel in its correct place in the uv plane, instead of at a location determined by the average over all channels. The MIRIAD implementation of multi-frequency synthesis also solves for spectral index, so that the image is not degraded by differing spectral indices of sources in the field.
Before imaging, the data from each observing session were inspected and the MIRIAD interactive tasks TVFLAG and BLFLAG were used to flag bad data resulting from interference, receiver problems or correlator failures. The primary calibrator data were flagged before calibration was applied. The secondary calibrator and target data had bandpass and polarisation calibration applied before inspection and flagging.
After flagging, the data were split into the separate observing bands before imaging and cleaning, so that calibration and imaging could account for frequency-dependent terms. When imaging, we explored a range of robust weights, which is a hybrid form of uniform and natural weighting (Briggs, 1995). Robust values of 1 or more resulted in a degraded beam shape, which translated into a strong circular artefact in the final image. Decreasing robust values gave tighter main lobes, and hence higher resolution, better clean models and more effective self calibration, but at the cost of sensitivity. A robustness value of 0 was chosen for the final imaging, as it was found to be a good compromise between sensitivity and resolution. This resulted in a synthesized beam of 7.1 6.2 arcsec at 20 cm.
Both the 11 cm and 6 cm images contained sidelobes from two strong off-field sources. The sidelobes in the 6 cm image were removed by increasing the image size to image an area four times larger, and cleaning a small region, 2 arcmin square, around each source. These clean components were removed from the visibility data before the final 6 cm imaging. The 11 cm off-field sources were removed by offsetting the image region to include the two sources. The procedure then followed that at 6 cm to remove the source sidelobes.
We experimented with a variety of approaches to deconvolution, including, in the case of the 20 cm data, cleaning a region around the bright central source only, and cleaning ‘boxes’ around all bright ( 1 mJy) sources. The number of clean iterations was chosen by monitoring the residuals of the clean model.
The 20 and 11 cm data were self-calibrated to improve the image quality. The best self-calibration result was from a clean model derived over the whole image, with the number of iterations set as above ( 30000 iterations). Two iterations of both phase and amplitude self calibration were sufficient to improve the image quality, and in particular remove phase error stripes.
After correction for the primary beam attenuation, image analysis was confined to a circular region of radius 20, 12, 5.5, and 3.5 arcmin at 20, 11, 6, and 3 cm respectively, at which radius the sensitivity falls to 39% of that in the primary beam centre. The final rms noise at the image centre is shown in Table 2. A further indication of the noise statistics is given by measuring the deepest negative noise peak in the resulting image. Within the 6.5-arcmin circular region shown in Fig. 2, the most negative noise peaks are -47, -99, -76, and -84 Jy at 20, 11, 6 and 3 cm respectively.
3.2 Source Extraction
To identify sources in the image at each wavelength, we first divided each map by the noise map generated by SExtractor (Bertin, 2004) to obtain a ‘signal to noise’ map. The MIRIAD task IMSAD was then used to derive a preliminary list of source ‘islands’ above a cut-off of .
Each source ‘island’ found by IMSAD was examined and refitted with an elliptical Gaussian to derive source flux densities and sizes. All sources and fit parameters were inspected to check for obvious failures and poor fits that need further analysis. The peak flux from this fit was then compared with a peak value derived from a parabolic fit to the source (MIRIAD task MAXFIT). If these two peak values differed by less than 20% and the fitted position was inside the 0.9 flux density contour, then these fluxes and positions were assigned a quality flag of 1. If they failed this test but inspection showed that the derived position and peak flux density of the peak were consistent with the data, then they were assigned a quality flag of 2.
Cases which failed this second test fell into one of the following categories:
-
•
Sources which were better described by two Gaussians. In this case, the IMSAD islands were split into two Gaussian components, which are catalogued separately in Table 3.
-
•
Sources with a shape which could not be fitted by a Gaussian. No such sources are amongst those discussed in this paper.
-
•
Obviously spurious sources that correspond to imaging artefacts. These very rare cases were deleted.
Finally, to reduce the incompleteness of our catalogue and minimise the probability of spurious detections, we included only sources with signal to noise greater than 5 in the final catalogue and in Table 3.
3.3 The limiting sensitivity of synthesis observations
The radio images described here are amongst the deepest made with the ATCA. However, future observations will probably be able to reach even deeper sensitivity levels, because of the planned introduction of a wide-bandwidth correlator (Compact Array Broadband Backend, or CABB) at the ATCA in 2006, and through the potential future availability of even larger amounts of observing time for a few key science projects.
The sensitivity to compact sources achievable with a synthesis telescope is limited by four factors.
-
•
Thermal Sensitivity For many observations, particularly those with short integration times, images are limited by the thermal noise temperature of the telescope, which is set by the receivers, optics, and atmosphere. In the case of a deep observation, this is still likely to be the limiting factor at high frequencies, but will become less important than other factors for deep integrations at low frequencies. For multi-day observations with the ATCA, this will continue to be the limiting factor at 6 and 3 cm, because of the low confusion levels together with the faintness and low surface brightness of sources at these frequencies. For example, the ATCA can be expected to reach an rms noise level of 5 Jy after observing at 6 cm for 16 *12 h (using two 128-MHz bands, and natural weighting). This level depends primarily on the system gain and temperature, and confusion does not play a significant role. This sensitivity limit is often referred to as the ’theoretical limit’.
-
•
Confusion by adjacent sources Long integrations at low frequencies (20 and 13 cm) are likely to reach the confusion limit at which each source of interest is confused by an adjacent background source. Assuming the log N/logS function taken from Jackson (2004), the confusion level, for a 6 arcsec beam at 20 cm, is 0.05 Jy/beam (i.e. on average, one background 0.05 Jy source will fall within each beam). Thus this does not currently present a limit to synthesis observations for any realistic amount of observing time.
However, a commonly stated rule-of-thumb is to require that there be no more than one confusing source per 100 synthesised beams at the same level as the target source, implying that most sources are separated by at least 10 synthesised beams. For the 6-km configuration of the ATCA, using the same source statistics measured by Jackson (2004), and assuming a spectral index of 0.7, this gives a practical sensitivity limit of 21, 6, 0.7, and 0.03 Jy at 20, 13, 6, and 3 cm respectively. The 20 cm observations described here already approach this limit. We note that this rule-of-thumb is probably too conservative for deep-field surveys such as those presented here, in which valuable astrophysical information can still be gained even when, in some cases, there is some confusion between adjacent sources.
-
•
Dynamic range limited by incomplete u-v coverage Even with perfect calibration, the dynamic range of an image is limited by incomplete u-v coverage, and hence missing information, which cannot be recovered even by sophisticated deconvolution algorithms. For a carefully chosen field around a bright radio source, with no strong confusing sources nearby, this is likely to be the factor that ultimately limits the sensitivity. The highest dynamic range (defined as peak flux in the image divided by the rms in a source-free region of the image) ever achieved in a synthesis image is , achieved using excellent uv coverage and redundant spacings on the Westerbork Synthesis Radio Telescope (de Bruyn & Brentjens, 2005). The highest dynamic range reached with the VLA is (Conway, Garrington, Perley, & Biretta, 1993), and a dynamic range of has been reached by Geller et al. (2000) with the ATCA.
The observations presented here, which also have a dynamic range of , use a wide range of configurations, resulting in a uv coverage comparable with that of the VLA or Westerbork, and should therefore be capable of achieving a similar dynamic range. The images presented in this paper generally reach the thermal noise limit, and so are not yet capable of exploring much higher dynamic ranges.
We note that the ATCA is in principle capable of almost complete uv coverage, by observing at every possible baseline, using a special set of 12 configurations (Manchester et al., 1984), which should in principle yield a very high dynamic range. However, the standard range of configurations currently offered to users does not include this special set. No deep ATCA observation has yet been demonstrably limited in dynamic range by incomplete uv coverage, but we note that future deep-field observations may require the use of such special configurations to reach the ultimate sensitivity.
In principle, even with a standard set of configurations, the uv coverage may be significantly improved by the use of the multi-frequency synthesis described above (Sault & Wieringa, 1994). However, although the MIRIAD implementation of multi-frequency synthesis solves for spectral index, it still assumes a constant spectral index for each source over the observed frequency range. Data are not yet available to determine whether this will limit the dynamic range in deep field observations.
-
•
Dynamic range limited by calibration errors The dynamic range will be limited by calibration errors. While simple antenna-based complex gain errors can be corrected by the selfcal technique available in MIRIAD and other packages, these implementations are unable to correct for gain errors that vary across the primary beam. Particularly troublesome are strong confusing sources close to the steep edge of the primary beam response (or its sidelobes), since small pointing errors may cause large amplitude fluctuations in these sources, preventing them from being adequately deconvolved from the image. Furthermore, the primary beam response is assumed in current analysis packages to be circularly symmetric.
The magnitude of this effect is uncertain, but an indication of its severity may be estimated as follows. Assuming that the critical area of the primary beam at 20 cm in which pointing errors will be significant occupies an annulus of radius 15 arcmin and width 5 arcmin, then we expect one 40 mJy source to fall by chance within that annulus. A typical dynamic range of 500 per 12-hour synthesis for sources in this region will then limit the sensitivity to 40 Jy for each 12-hour image. When n observations are combined, then if the pointing errors are purely random, this will be reduced by sqrt(n), giving a limiting rms sensitivity of 10 Jy for the set of observations described in this paper. Corresponding limits for 11 and 6 cm are 4 and 1 Jy respectively. This limiting sensitivity at 20 cm is similar to the sensitivity obtained in the observations described here, suggesting that more sophisticated calibration algorithms may be necessary to enable significantly deeper imaging.
If future observations wish to probe more deeply in the presence of such strong confusing sources, then it will be necessary to develop calibration packages that account for varying gain errors across the primary beam. We note that the aips++ package contains an algorithm that can in principle handle these errors.
4 Radio Sources in the Inner HDF-S Region
The final 20 cm image is shown in Figure 1. Overlaid on this image are the primary beam sizes and locations for the ATCA observations at the four frequencies, and the locations of the HST WFPC, STIS, and NICMOS fields. Of particular note are the bright confusing source ATHDFS_J223355.6604315 at 6 arcmin south-east of image centre, the clearly identifiable multiple radio source in the north-east corner, and a radio galaxy with a jet-lobe structure about 7 arcmin south of the image centre.
Catalogues covering the complete region imaged by the AT at the two
longest frequencies will be presented in Papers 2-4. All the radio data
from the survey are available on
http://www.atnf.csiro.au/research/deep/hdfs/, and in the NASA/IPAC
Extragalactic Database (NED) on
http://nedwww.ipac.caltech.edu/.
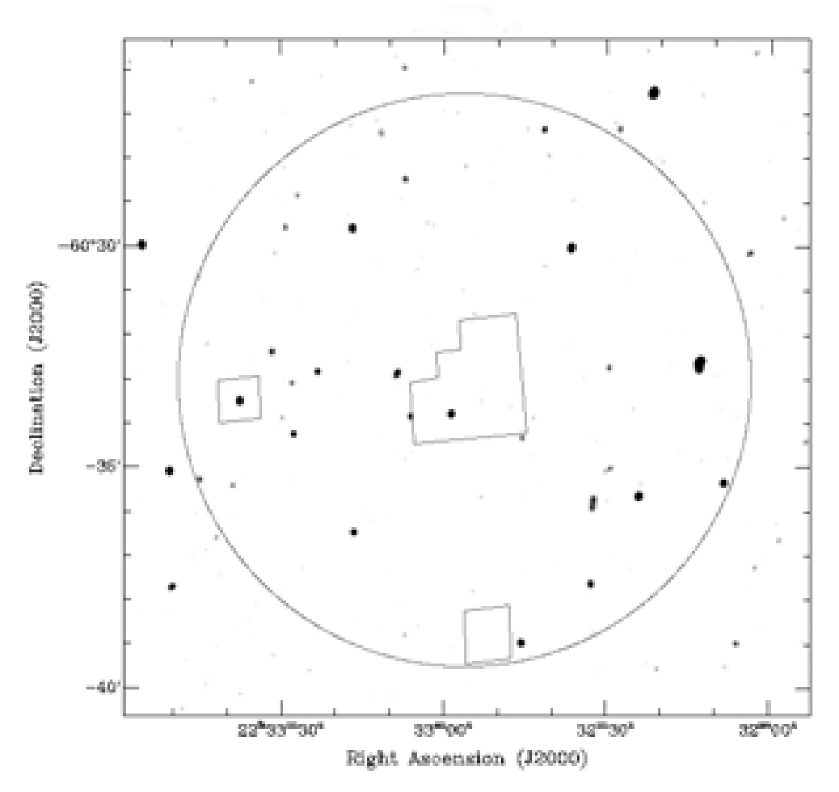
In this remainder of this paper we focus on a circular region of radius 6.5 arcmin, centred on the WFPC field at (RA = 22h 32m 56.22s and Dec = 60∘ 33’ 02.7” (J2000) ). The size of this region has been chosen to include the HST WFPC2, NICMOS and STIS fields, and also cover all of the area inside the 6 cm and 3 cm observations. Thus all the 6 and 3 cm data from this survey are presented in this paper. The 20 cm image of this region is shown in Figure 2.
In Table 3 we show the combined source catalogue for all sources detected at a level of 5 times the local rms noise at one or more frequencies within this region. Sources were matched across the 4 frequencies by visual inspection and the result is a catalogue of 87 radio sources. For sources detected at more than one wavelength, the position is derived from the image with the smallest errors in the source position, as noted in column 15 of Table 3.
The columns of Table 3 are as follows.
Column 1 — Reference number. These are used for brevity only within this paper, and, to avoid ambiguity, the full source name should be used by any papers referring to the catalogue.
Column 2 — Source name.
Columns 3 & 4 — Right Ascension (J2000), 1 uncertainty in arcsec. Note that these uncertainties refer to the formal positional uncertainties derived from the fitting process. To these should be added, in quadrature, a systematic uncertainty of about 0.2 arcsec, representing the uncertainty in the position of the AT phase calibrator sources.
Columns 5 & 6 — Declination (J2000), 1 uncertainty in arcsec.
Columns (7–10) — Flux densities at 20, 11, 6, and 3 cm in Jy. Where the column is blank, then the source is either undetected at that wavelength, i.e. below , or lies outside the catalogued area. The peak flux is given for unresolved sources and the integrated flux is given for resolved sources.
Column (11) — Deconvolved major axis (FWHM), in arcsec, at the wavelength indicated in column 15.
Column (12) — Deconvolved minor axis (FWHM), , in arcsec, at the wavelength indicated in column 15.
Column (13) — Deconvolved position angle, PA, in degrees east of north, at the wavelength indicated in column 15.
Column (14) — Local signal to noise ratio.
Column (15) — Band flag - indicates the wavelength at which the source position and Gaussian fit parameters are measured: L= 20 cm, S= 11 cm, C= 6 cm, and X= 3 cm.
Column (16) — Quality flag, as described in Section 3.2
5 Properties of Selected Radio Sources
In this section, we discuss in detail a subset of 19 representative sources chosen from the list given in Table 3. These sources have not been selected in any statistically well-defined way, and so conclusions drawn from this subset may not be true for the population of sources as a whole. The full sample will be discussed in detail in Paper 3.
It is particularly important to determine the origin of the radio luminosity, which may be generated either by star formation or AGN activity. A potential discriminator between these two mechanisms is morphology. At higher flux densities, AGNs frequently have a classic double-lobed structure, whilst starburst galaxies are typically unresolved or amorphous. However, the extent to which these morphologies are present in Jy sources is not yet well-established, and the resolution of the observations presented here is in many cases insufficient to distinguish between these.
Another potential discriminant is radio spectral index. Starburst galaxies typically have a spectral index of about 0.7, whilst AGNs typically have a spectral index ranging from about 0 to about 1.4. Thus, while little is learnt from a spectral index of about 0.7, a spectral index which differs significantly from this, in either direction, implies AGN activity. However, the spectral indices presented here have a typical uncertainty, due to image noise, of 0.1 – 0.2, so only extreme spectral indices are useful indicators. There is a further uncertainty caused by the mismatch of the synthesised beam at different frequencies. Huynh et al. (2005b) reduce this uncertainty by convolving the higher-frequency image with the lower-frequency beam, and we use their spectral indices here, which therefore differ slightly from those which would be obtained from the figures in Table 3.
One particular class of radio source, the “gigahertz peaked spectrum” or GPS galaxy, has a spectrum which rises to a maximum at centimetre wavelengths, and is believed to represent an early stage of AGN activity (Snellen et al., 1999). This characteristic spectrum is seen in two of the objects discussed here, and is an unambiguous indicator of AGN activity.
A potential cause of a flat radio spectrum might also be that the shorter wavelength emission contains a component of free-free emission from HII regions in a starburst galaxy. However, the spectral indices discussed here are based on the 20 and 11 cm radio emission, at which wavelength it would be unusual for free-free emission to be significant (Condon, 1992).
A further complication for any interpretation of these sources is that a starburst galaxy may contain an obscured AGN in its nucleus. Local examples of this phenomenon are NGC6240 (Gallimore & Beswick, 2004) and Mrk231 (Yun, Reddy, & Condon, 2001) in which a starburst galaxy harbours a hidden low-luminosity AGN, with comparable contributions to the luminosity from the starburst and AGN components.
A list of the sources and their optical, infrared, and derived properties is given in Table 4. In Figure 3 we show the 20 cm radio contours overlaid on CTIO images (Palunas et al., 2000). The columns of Table 4 are as follows.
Column 1 — Reference number, as in Table 3.
Column 2 — Source name.
Column 3 — Flux density at 20 cm.
Column 4 — Measured redshift. Redshifts with four decimal digits are spectroscopic redshifts, while those with two decimal digits are photometric redshifts. References for the redshifts are given in the discussion of individual sources. For reasons discussed in Huynh et al. (2005b), in cases where both Fernandez-Soto et al (1999) and Teplitz et al. (2001) have measured photometric redshifts, but no spectroscopic redshifts are available, we adopt the Fernandez-Soto et al (1999) redshift.
Columns 5–9 — AB magnitudes measured at V, R, I, J, and K bands. Except where otherwise stated, measured values of V,R,I are taken from the CTIO catalogue (Palunas et al., 2000). Other references are given in the discussion of individual sources.
Column (10) — I-K colour.
Column (11) — Radio luminosity
Column (12) — Star formation rate implied by the radio luminosity, if all radio emission is assumed to be generated by star formation activity, using the scaling given by Condon (1992) with a Saltpeter IMF (Q=5.5). For comparison, this algorithm assigns Arp220 a star formation rate of 300 .
Column (13) — Logarithm of the radio to optical luminosity ratio, calculated as , where I is the I-band magnitude shown in Table 2, and , is the radio magnitude derived from the 20 cm flux density using the AB Radio magnitude scale defined by Ivezic et al. (2002). In a few cases, indicated by the notes to Table 2 and in the discussion of individual sources, I has been estimated from R or J magnitudes. For comparison, Arp220 has log (
Column (14) — Classification of the radio source. The arguments for each classification are given in the discussion of individual sources. SB indicates starburst activity, Sy indicates a Seyfert galaxy, and GPS indicates a gigahertz-peaked-spectrum AGN.
The rest of this section discusses each of the sources in Table 4. In each case, the discussion is headed by the short reference number, the full source name, and the source name given by Norris et al. (1999, 2001), if appropriate. We use a number of abbreviations throughout this section: FS refers to Fernandez-Soto et al (1999), and SMO refers to Sawicki & Mallén-Ornelas (2003). We refer frequently to the CTIO images (Palunas et al., 2000), the WFPC images (Williams et al., 2000; Casertano et al., 2000), the WFPC FF (flanking field) observations (Lucas et al., 2003), the NICMOS images (Yahata et al, 2000), and the EIS (ESO Infrared survey; Nonino et al. (1999)). Except where stated otherwise, all radio spectral indices are taken from Huynh et al. (2005b), and refer to the spectral index between 20 and 11 cm.
3. ATHDFS_J223245.6-603857 (source b)
This bright, marginally resolved, 843 Jy source has a radio spectral index of (), which reveals little about the origin of its radio luminosity. The source is located about one arcsec east of a faint, possibly disturbed or interacting, galaxy seen in WFPC FF and, faintly, in CTIO images. Here we assume they are coincident, because astrometric accuracy on the flanking fields is relatively poor. FS fit an irregular template and obtain a photometric redshift of 0.75. If the resulting high radio luminosity is attributed entirely to star formation activity, this implies a star formation rate of 515 . The radio-optical luminosity ratio is also very high, implying a high degree of extinction. One explanation is that it is a very obscured starburst galaxy, about twice as active as Arp220, similar to those suggested by Barger, Cowie, & Richards (2000) to account for the strong SCUBA sources in HDF-N, and an alternative is that the source contains a hidden AGN. Given the irregular spectral template, and the disturbed morphology, it is likely that this is a very obscured starburst galaxy, although we cannot rule out the presence of an obscured AGN.
7. ATHDFS_J223254.5-603748
This faint 92 Jy source is detected only in our 20 cm observations. It is coincident with a bright disturbed barred spiral galaxy seen in CTIO and WFPC FF images. Huynh et al. (2005c) measure a spectroscopic redshift of 0.1798, and see a Seyfert-type spectra. Thus, this source appears to be a relatively normal Seyfert galaxy. We note that SMO have measured a spectroscopic redshift of 0.2668, but the reason for this discrepancy is unclear. Here we adopt the Huynh et al. (2005c) redshift of 0.1798.
12. ATHDFS_J223316.5-603627 (source f)
This bright, unresolved, 649 Jy source has a radio spectral index of (). It is coincident with a galaxy in the CTIO image that appears extended, and is possibly an edge-on spiral. Teplitz et al. (2001) measure a photometric redshift of 0.60, while FS measure a photometric redshift of 0.29, using a starburst template. Here we adopt the FS redshift. The radio luminosity then implies a star formation rate of 95 . This, together with the colours of this galaxy, indicates vigorous, but not unusual, starburst activity, in a relatively normal galaxy.
19. ATHDFS_J223338.8-603523 ( source m)
The radio spectrum of this 185 Jy unresolved source is relatively flat () suggesting an AGN rather than a starburst galaxy. The source is coincident with a bright elliptical galaxy in the WFPC FF image, which is also seen as a J=18.3 galaxy in the EIS survey, with J-K=0.54. Huynh et al. (2005c) have measured a spectroscopic redshift of 0.2250, and we note that Teplitz et al. (2001) have measured a photometric redshift of z=0.16. The properties of this source are consistent with those of an elliptical galaxy hosting an AGN.
26. ATHDFS_J223243.3-603442
This faint radio source is visible in our 20 cm and 6 cm observations, but not in the 11 cm observations, which give an upper limit S 30 Jy. It has a radio spectral index derived directly from the 6 and 20 cm observations of 0.23, suggesting that it is an AGN, although this conclusion is weakened by the faintness of the source, its non-detection at 11cm, and the different beam sizes at 6 and 20 cm. The source is coincident with an extended and apparently disturbed system, possibly a merger, visible in CTIO and WFPC images. Teplitz et al. (2001) measured a photometric redshift of 0.57, FS measured a photometric redshift of 0.46, and SMO measure a spectroscopic redshift of 0.4233, which we adopt here. Mann et al. (2002) have observed it at 7 and 15 m with ISO, and show that its spectral energy distribution (SED) resembles a cirrus-dominated galaxy like M51 rather than a starburst. Subject to the uncertainty discussed above, the radio spectrum suggests that this otherwise normal spiral galaxy may harbour a weak radio AGN in its nucleus.
29. ATHDFS_J223245.5-603419 (source a)
This bright radio source has a spectral index of (), which is marginally flatter than that expected of a starburst galaxy. It is identified with the western-most member of a line of three galaxies clearly visible in the CTIO, AAT and EIS images, but unfortunately just two arcsec outside the deep WFPC field. Its radio image is slightly extended in the direction of the line of galaxies, suggesting that these may contribute weakly to the radio emission. Franceschini et al. (2003) suggest that most of the infrared emission is from the central object of the triplet, and yet the position given in their table coincides with the western object, which is unambiguously the origin of the strong radio emission. We list their J and K magnitude in Table 2. Glazebrook et al. (1998) have measured a spectroscopic redshift of 0.4606, while Vanzella et al. (2002) measure a redshift of 0.4594, and SMO measure z=0.4608. We adopt the mean of these, which is 0.4603. Teplitz et al. (2001) and FS have measured photometric redshifts of 0.57 and 0.46 respectively, and FS fit an sbc template to this galaxy. Based on its infrared properties, Franceschini et al. (2003) derive a mass of and a star formation rate of 50 , which is slightly lower than the rate of 81 that we derive from the radio observations. Mann et al. (2002) have observed it at 7 and 15 m with ISO, and show that its spectral energy distribution (SED) resembles a starburst galaxy like Arp220. The data presented here are consistent with this interpretation.
31. ATHDFS_J223327.6-603414 (source h)
This spectrum of this bright unresolved radio source peaks at 11 cm, and we therefore classify it as a GPS galaxy, which is believed to represent an early stage of AGN activity (Snellen et al., 1999). There is no optical counterpart, but it lies about two arcsec from a small galaxy (at 22 33 27.40, -60 34 12.37) which is visible within the STIS flanking fields observations. The absence of any galaxy coincident with the radio source in the HDF flanking field observations gives limiting magnitudes shown in Table 4, leading to an extreme value of the radio-optical luminosity ratio, indicating that the GPS source is strongly obscured by its host galaxy.
33. ATHDFS_J223243.4-603351
This unresolved radio source has a flux density of 98 Jy at 20 cm , rising to 114 Jy at 3 cm . This inverted spectrum suggests that it is an AGN. It is coincident with a point-like optical source on the CTIO image, and Huynh et al. (2005c) have measured a spectroscopic redshift of 1.566, and note that it has the broad lines of a quasar. Palunas et al. (2000) (who refer to it as QSO B) and Franceschini et al. (2003) also identify this source as a quasar at z=1.56. Mann et al. (2002) have observed it at 7 and 15 m with ISO, and suggest that it is a broad-line AGN, but measure a redshift of 0.0918 based on a single broad line. As this differs from the redshifts measured by Huynh et al. (2005c), Palunas et al., and Francheschini et al., we suggest that the Mann et al. redshift was based
on a misidentified line, and adopt a redshift of 1.566 for this quasar.
34. ATHDFS_J223306.0-603350 (source d)
This bright radio source has a spectral index of (), and is identified with the core of a relatively bright face-on barred spiral galaxy (R=17.2), which appears to be interacting with a small galaxy a few arcsec to its north. The radio source is significantly extended to the south at 11 cm, possibly indicating some structure within the galaxy. Glazebrook et al. (1998) have measured a redshift of 0.1733, and show that it has the characteristic emission lines of a star-forming galaxy. It is the brightest 15-m source seen in the ISO observations by Mann et al. (2002) who show that its SED is that of a normal spiral galaxy rather than a starburst. However, its optical and radio luminosities suggest that it is a luminous starburst galaxy, and Francheschini et al. show that its infrared emission shows an excess over that expected from a normal spiral. We derive a star formation rate of 27 , and thus classify it as a starburst rather than a normal spiral.
35. ATHDFS_J223258.5-603346 (source c)
This unusual source is the strongest radio source in the WFPC field, and yet is optically a very faint (V=27.05) red source which is invisible in CTIO images and barely visible in WFPC images. It has been discussed extensively by Norris et al. (1999) and Norris et al. (2001), where it is labelled as ”source c”. A number of authors have measured photometric redshifts for this galaxy: FS (1.69), Fontana et al. (2004) (1.7), Lanzetta et al (2002) (1.69), Rodighiero, Franceschini, & Fasano (2001) (1.69), and Rudnick et al. (2001) (1.34). We note the high degree of consistency between these measurements, and adopt a redshift of 1.69 for this object. A 12-hour spectroscopic observation on the VLT failed to detect any emission lines (Vanzella et al., 2002).
This source has an unusually high radio-optical ratio (the highest in this subset), several hundred times greater than Arp220. Vanzella et al. (2001) measure I-KAB = 3.45, classifying it as an extremely red object (ERO) according to the division specified by Pozzetti & Mannucci (2000). EROs (McCarthy, 2004) are thought to be a mix of passively evolving red galaxies at and heavily obscured star-forming galaxies, also at z 1. However, as EROs include both starburst and early-type galaxies, this classification does not yield any further information on this object. Based on the infrared colours, Vanzella et al. (2001) also classify it as an elliptical galaxy. It appears to be marginally extended in both the 3 cm image and the WFPC image.
The radio spectral index of this source is (). It is difficult to determine whether this source is a extremely dusty starburst or a dust-enshrouded AGN. Its radio spectral index is consistent with either, and SCUBA observations of similar galaxies in the HDF-N (Barger, Cowie, & Richards, 2000) suggest that their radio emission is produced by star formation. At a redshift of 1.69, this would imply this source is about five times more luminous in the radio than Arp220. On the other hand, unpublished SIMBA (Nyman et al., 2001) observations by Wiklind, Bergstrom, Huynh, Norris, and Jackson failed to detect any 1.3 mm continuum emission greater than 7.5 mJy, whereas if this source is powered by starburst activity, the associated dust would be expected to have a flux density of 15 mJy. We therefore consider it likely that this source is a dust-enshrouded AGN.
37. ATHDFS_J223247.6-603337
This faint radio source is seen only in our 20 cm observations, and is coincident with a large late-type spiral galaxy in the CTIO image. Glazebrook et al. (1998) measure a spectroscopic redshift of 0.5803, and SMO measure a spectroscopic redshift of 0.5807. Photometric redshifts of 0.67 and 0.56 have been measured by Teplitz et al. (2001) and FS respectively. Mann et al. (2002) note that its SED is that of a normal galaxy like M51. Rigopoulou et al. (2002) and Franceschini et al. (2003) show that, based on spectroscopy and infrared photometry respectively, it is an unusually massive galaxy, with a dynamical mass of and a star formation rate of 45 . This is in good agreement with the star formation rate of 32 that we derive from its radio luminosity.
39. ATHDFS_J223337.5-603329 (source l)
This source represents the bright, unresolved, radio emission from the well-studied STIS quasar (Outram et al., 1999) at z=2.238, whose location was partly responsible for the location of the HDF-S, as discussed in Section 2.1 above. This source has been extensively discussed in the literature (e.g. Sealey, Drinkwater, & Webb (1998); Palunas et al. (2000)), and so we restrict the discussion here to noting that the associated radio source is typical of a powerful radio-loud quasar, with a spectral index of ().
43. ATHDFS_J223327.9-603304 (source i)
This bright double radio source appears in Table 3 with two entries (43. ATHDFS_J223327.9-603304 and 44. ATHDFS_J223329.2-603302 ) corresponding to the two lobes of the source, indicating that it is a radio galaxy or quasar. There is no optical counterpart visible in the CTIO images, but a faint counterpart is visible at J and K in the EIS images. The limit on I from the CTIO catalogue gives a radio-infrared luminosity ratio of 5.20, indicating that the source is highly obscured.
48. ATHDFS_J223308.6-603251(source e)
This strong extended radio source is coincident with a R=21.77 CTIO spheroidal galaxy visible in the CTIO, AAO, and WFPC FF1 images. Its radio spectral index is (), suggesting a radio galaxy rather than a starburst. The radio source appears to be extended in a NW-SE direction at 20, 11, and 6 cm by about 5 arcsec, corresponding to 10 kpc at z=0.5. At 20 cm our spatial resolution is insufficient to tell whether this extension may be partly due to contamination by the emission from a nearby galaxy, but at 3 cm it appears as a core-dominated source with weak jets extending to the NW and SE. Both Teplitz et al. (2001) and FS measure photometric redshifts of 0.64. All these data are consistent with a classical radio-loud AGN of moderate radio power.
49. ATHDFS_J223323.2-603249 (source g)
This 457 Jy source is notable in having a GPS spectrum, suggesting that it is powered by AGN activity. It is marginally resolved at 11 cm and unresolved at other wavelengths. No optical counterpart is visible in the CTIO image of this field, but it is weakly detected at J and K by EIS. For the calculation of the radio-optical ratio, the I magnitude has been estimated as I=J+0.12, where 0.12 is the mean value of I-J for those sources in this subset for which a measured value of I-J is available. This source has one of the largest radio-optical ratios in our subset.
55. ATHDFS_J223331.6-603222 (source k)
This slightly resolved 295 Jy source has a spectral index of (), which gives no clue to the origin of its emission. It is coincident with the central galaxy of a group of three galaxies, possibly merging, seen in the CTIO, AAO, WFPC-FF, and EIS images, with J-K= 0.8. FS measure a photometric redshift of 0.42, and Huynh et al. (2005c) measure a spectroscopic redshift of 0.4652, with the spectrum characteristic of a star-forming galaxy. Its extension at 20 and 13 cm is consistent with some radio emission from the other two galaxies in the group. Its radio luminosity implies a star formation rate of 123 , and its radio-optical ratio is about ten times that of Arp220. These observations are consistent with a very obscured starburst galaxy.
67. ATHDFS_J223236.5-603000
This is the strongest (1.5 mJy) radio source in the subset discussed in this paper. It has a spectral index of (), and no optical counterpart. The EIS upper limits give it an extreme radio-optical ratio of 6.02. It is marginally resolved at 20 cm, and also shows a small amount of emission to the south in the 13 cm image, which is coincident with another galaxy, and may be unrelated. None of the observed characteristics gives any clue as to whether this radio emission is powered by AGN or star formation activity, but the high radio-optical luminosity ratio indicates a high obscuration by dust, whatever the origin of the radio emission.
69. ATHDFS_J223316.8-602934
This extended strong (1.0 mJy) source has a flat spectrum (spectral index ()), indicating that it is an AGN. It is coincident with a faint galaxy in the CTIO image, in a dense cluster. Photometric redshifts of 0.12 and 0.89 have been obtained by FS and Teplitz et al. (2001) respectively. Here we adopt the FS redshift. Some of the extended radio emission may be attributable to the other galaxies in the cluster.
70. ATHDFS_J223329.1-602933
This extended 261 Jy source appears in our source catalogue only as a 20 cm detection, although there is a marginal detection in the 11 cm observations with a peak flux density of 86 Jy, giving a spectral index based on this uncorrected flux of 1.9, indicating an AGN. We note that this would be classified as an ”ultra-steep spectrum” by De Breuck, van Breugel, Röttgering, & Miley (2000), and consequently may be a high redshift candidate. A faint extended source, or cluster of sources, is visible in the CTIO image, but no redshift is available. Although V and I magnitudes are given in the CTIO catalogue, they have very high uncertainties and so have been set to zero in Table 4. For the calculation of the radio-optical ratio, an I magnitude has been estimated as I=R0.83, where 0.83 is the mean value of R-I for those sources in this subset for which a measured value of R-I is available. The extended radio emission to the north and east may represent emission from the other galaxies in the cluster.
6 Discussion
Of the 19 sources in our subset, we classify eleven as AGN or quasars, six as starbursts or star-forming galaxies, and two as composite or unknown. However, the selection criteria for this subset are not well-defined, and the subset may be biased towards brighter objects, and so these fractions are unlikely to be representative of the population as a whole. For example, Prandoni et al. (2001) find that 40% of sources 1 mJy are starburst galaxies. A careful analysis of the distribution of the entire sample of sources from this survey will be given by Huynh et al. (2005c).
About half of the objects in our subset have high radio-optical luminosity ratios which appear to be quite unlike those seen in the local Universe. However, a detailed comparison requires a significant correction (the k-correction) to be made to the flux densities of these objects, both at infrared and radio wavelengths, to compensate for the fact that the observed wavelength differs significantly from the emitted wavelength. This correction depends sensitively on the intrinsic emission spectrum of the object, and the redshift. Even in those cases where redshifts are known, the intrinsic spectrum of the galaxy is unknown, and so attempts to produce plots of radio/optical luminosities depend sensitively upon assuming a template derived from the local galaxy population, which may be intrinsically different from those at high redshifts. Small differences in these spectra result in significantly different conclusions, and so the resulting plots may be misleading. Thus we are unable to make a detailed comparison of radio-optical ratios with those seen in the local Universe until these objects are much better characterised.
We also note that our lack of knowledge of the intrinsic spectra of these objects is likely to make photometric redshifts unreliable. In the detailed discussion of Section 5, we have noted several instances where a photometric redshift differs significantly from a spectroscopic redshift. However, the reliability of photometric redshifts for the heavily obscured objects will increase as high-quality mid-infrared observations become available from the Spitzer Space Telescope, together with the detailed models and templates based on those observations.
A significant fraction of the objects in this subset appear to be heavily reddened, and fall into the category of “Extremely Red Objects” (EROs). A similar result is found in other Deep Fields observations such as those in the Hubble Deep Field North (e.g. Garrett et al. (2000), Richards (2000) ). For example, Waddington et al. (1999) detected a faint radio galaxy in the HDF-N (VLA_J123642621331) at a redshift of 4.42, which in several respects may be similar to some of the objects described here. Numerous observations of the EROs at a variety of wavelengths have established that this class includes both early-type evolved galaxies at z 1, heavily obscured high – z active galaxies and starburst galaxies, and in some cases a combination of these (e.g. Afonso, Mobasher, Chan, & Cram (2001), Brusa et al. (2002), Bergström & Wiklind (2004), Georgakakis et al. (2004) ).
7 Conclusion
In this first paper of the series, we have presented the observations and described some of the radio objects detected in the Hubble Deep Field South. Subsequent papers will present the entire catalogue and discuss identifications, source properties, and the statistical properties of the sample.
The small subset of galaxies described here show that:
-
•
The galaxies include a mixture of starburst-dominated and AGN-dominated, with some evidence that the luminosity of some galaxies may be generated by a combination of these phenomena.
-
•
Several of the galaxies have unusually large radio-optical luminosity ratios, and appear to be heavily obscured by dust.
Whilst the subset discussed in detail here has not been chosen according to any statistically well-defined procedure, it is already clear from this small sample that some of these galaxies are quite unlike those seen in the local Universe, perhaps representing an earlier evolutionary stage. This has already been noted by other authors conducting deep radio surveys, but the small numbers of such objects makes it difficult to characterise these objects. It is also likely that many of these objects will be more clearly characterised by mid-infrared results from the Spitzer Space Telescope.
8 Acknowledgements
We thank Tommy Wiklind and Stefan Bergstrom for their collaboration in the unpublished SIMBA Observations, and we thank Jose Afonso for valuable comments on an earlier draft of this paper. The Australia Telescope Compact Array is part of the Australia Telescope which is funded by the Commonwealth of Australia for operation as a National Facility managed by CSIRO.
References
- Afonso, Mobasher, Chan, & Cram (2001) Afonso, J., Mobasher, B., Chan, B., & Cram, L. 2001, ApJ, 559, L101
- Barger, Cowie, & Richards (2000) Barger, A. J., Cowie, L. L., & Richards, E. A. 2000, AJ, 119, 2092
- Barger et al. (2001) Barger, A. J., Cowie, L. L., Steffen, A. T., Hornschemeier, A. E., Brandt, W. N., & Garmire, G. P. 2001, ApJ, 560, L23
- Bergström & Wiklind (2004) Bergström, S. & Wiklind, T. 2004, A&A, 414, 95
- Bertin (2004) Bertin, E., 2004, http://terapix.iap.fr/rubrique.php?id_rubrique=91
- Blain, Chapman, Smail, & Ivison (2004) Blain, A. W., Chapman, S. C., Smail, I., & Ivison, R. 2004, ApJ, 611, 725
- Briggs (1995) Briggs, D., 1995, PhD thesis, NMIMT. See http://www.aoc.nrao.edu/dissertations/dbriggs/
- de Bruyn & Brentjens (2005) de Bruyn, G., & Brentjens, M., 2005, in preparation.
- Brusa et al. (2002) Brusa, M., Comastri, A., Daddi, E., Cimatti, A., Mignoli, M., & Pozzetti, L. 2002, ApJ, 581, L89
- Casertano et al. (2000) Casertano, S., et al. 2000, AJ,120, 2747
- Chapman et al. (2003) Chapman, S. C., et al. 2003, ApJ, 585, 57
- Condon (1992) Condon, J., J., 1992, ARA&A, 30, 575
- Conway, Garrington, Perley, & Biretta (1993) Conway, R. G., Garrington, S. T., Perley, R. A., & Biretta, J. A. 1993, A&A, 267, 347
- De Breuck, van Breugel, Röttgering, & Miley (2000) De Breuck, C., van Breugel, W., Röttgering, H. J. A., & Miley, G. 2000, A&AS, 143, 303
- Fernandez-Soto et al (1999) Fernandez-Soto et al., 1999, (private communication). (FS)
- Fontana et al. (2004) Fontana, A., et al. 2004, in preparation.
- Franceschini et al. (2003) Franceschini, A., et al. 2003, A&A, 403, 501
- Gallimore & Beswick (2004) Gallimore, J. F. & Beswick, R. 2004, AJ, 127, 239
- Garrett et al. (2000) Garrett, M. A., de Bruyn, A. G., Giroletti, M., Baan, W. A., & Schilizzi, R. T. 2000, A&A, 361, L41
- Geller et al. (2000) Geller, R. M., Sault, R. J., Antonucci, R., Killeen, N. E. B., Ekers, R., Desai, K., & Whysong, D. 2000, ApJ, 539, 73
- Georgakakis et al. (2004) Georgakakis, A., Hopkins, A. M., Afonso, J., Sullivan, M., Mobasher, B., & Cram, L. E. 2004, MNRAS, 354, 127
- Glazebrook et al. (1998) Glazebrook, C., et al., 1998, on http://www.aao.gov.au/hdfs/Redshifts/ (G98)
- Hopkins, Afonso, Cram, & Mobasher (1999) Hopkins, A., Afonso, J., Cram, L., & Mobasher, B. 1999, ApJ, 519, L59
- Huynh et al. (2005a) Huynh, Jackson, & Norris, 2005a, submitted to AJ (Paper 2)
- Huynh et al. (2005b) Huynh, Jackson, & Norris, 2005b, in preparation. (Paper 3)
- Huynh et al. (2005c) Huynh, Jackson, & Norris, 2005c, in preparation. (Paper 4)
- Ivezić et al. (2002) Ivezić, Ž., et al. 2002, AJ, 124, 2364
- Jackson (2004) Jackson, C. A. 2004, New Astronomy Review, 48, 1187
- Labbe et al. (2003) Labbe, I., Franx, M., Rudnick, G., Forster Schreiber, N.M., van der Werf, P., Rottgering, H., van Starkenburg, L., van de Wel, A., Kuijken, K., Rix, H.-W., Moorwood, A., Daddi, E., van Dokkum, P.G. 2003, AJ, in press
- Lanzetta et al (2002) Lanzetta, K.M., et al 2002, ApJ, 570, 492 (see also www.sess.unysb.edu/astro/hdfs)
- Lucas et al. (2003) Lucas, R. A., et al. 2003, AJ, 125, 398
- Manchester et al. (1984) Manchester, R.N., and the ATNF Configuration Study Group, 1984, ATCA Technical Memo, 1984, AT/17.2/003
- Mann et al. (2002) Mann, R. G., et al. 2002, MNRAS, 332, 549
- McCarthy (2004) McCarthy, P.J., 2004, ARAA, 42, 477
- Muxlow et al (2000) Muxlow, T.W.B., Wilkinson, P.N., Richards, A.M.S., Kellermann, K.I., Richards, E.A., Garrett, M.A. 1999, New Astr Reviews, 43, 623
- Nonino et al. (1999) Nonino et al, 1999, A&AS, 137, 51 (see also http://www.eso.org/science/eis/eis_gallery/HDFS/)
- Norris et al. (1999) Norris, R.P., et al, in ”Perspectives on Radio Astronomy - Science with Large Antenna Arrays”, ed. M.P.van Haarlem, NFRA, 1999
- Norris et al. (2001) Norris, R.P., Hopkins, A., Sault, R.J., Mitchell, D.A., Ekers, R.D., Badia, F., Higdon, J., Wieringa, M.H., Boyle, B.J., Williams, R.E., 2001, in Proceedings of the ESO/ECF/STScI workshop:Deep Fields, eds Cristiani, S., Renzini, A., Williams, R.E., Springer
- Nyman et al. (2001) Nyman, L.-Å., et al. 2001, The Messenger, 106, 40
- Oliver, S. et al. (2001) Oliver, S., Mann, R.G., Carballo, R., Franceschini, A., Rowan-Robinson, M., Kontizas, M., Dapergolas, A., Kontizas, E., Verma, A., Elbaz, D., Granato, G. L., Silva, L., Rigopoulou, D., Gonzalez-Serrano, J. I., Serjeant, S., Efstathiou, A., van der Werf, P. P. 2001, MNRAS, 332, 536
- Outram et al. (1999) Outram, P. J., Boyle, B. J., Carswell, R. F., Hewett, P. C., & Williams, R. E. 1999, MNRAS, 305, 685
- Palunas et al. (2000) Palunas, P., et al., 2000, ApJ, 541, 61
- Pozzetti & Mannucci (2000) Pozzetti, L. & Mannucci, F. 2000, MNRAS, 317, L17
- Prandoni et al. (2000) Prandoni, I., Gregorini, L., Parma, P., de Ruiter, H. R., Vettolani, G., Wieringa, M. H., & Ekers, R. D. 2000, A&AS, 146, 31
- Prandoni et al. (2001) Prandoni, I., Gregorini, L., Parma, P., de Ruiter, H. R., Vettolani, G., Zanichelli, A., Wieringa, M. H., & Ekers, R. D. 2001, A&A, 369, 787
- Reynolds (1994) Reynolds, J.E., 1994, ATNF internal memo AT/39.3/040
- Richards et al. (1998) Richards, E.A., Kellermann, K.I., Fomalont, E.B., Windhorst, R.A., Partridge, R.B. 1998, AJ, 117, 1039
- Richards (2000) Richards, E. A. 2000, ApJ, 533, 611
- Rigopoulou et al. (2002) Rigopoulou, D., Franceschini, A., Aussel, H., Genzel, R., Thatte, N., & Cesarsky, C. J. 2002, ApJ, 580, 789
- Rodighiero, Franceschini, & Fasano (2001) Rodighiero, G., Franceschini, A., & Fasano, G. 2001, MNRAS, 324, 491
- Rudnick et al. (2001) Rudnick, G., et al. 2001, AJ, 122, 2205
- Saracco et al. (2001) Saracco, P., Giallongo, E., Cristiani, S., D’Odorico, S., Fontana, A., Iovino, A., Poli, F., & Vanzella, E. 2001, A&A, 375, 1 (see also www.stecf.org/hstprogrammes/ISAAC/HDFSdata.html)
- Sault & Wieringa (1994) Sault, R. J. & Wieringa, M. H. 1994, A&AS, 108, 585
- Sault, Teuben, & Wright (1995) Sault, R. J., Teuben, P. J., & Wright, M. C. H. 1995, ASP Conf. Ser. 77: Astronomical Data Analysis Software and Systems IV, 4, 433
- Sawicki & Mallén-Ornelas (2003) Sawicki, M. & Mallén-Ornelas, G. 2003, AJ, 126, 1208
- Sealey, Drinkwater, & Webb (1998) Sealey, K. M., Drinkwater, M. J., & Webb, J. K. 1998, ApJ, 499, L135
- Sealey et al. (1999) Sealey, K., Drinkwater, M., Webb, J., Boyle, B.J., 1999, in Looking Deep into the Southern Sky, eds Morganti, R., Couch, W., ESO Astrophysics Symposia, Springer-Verlag, Berlin Heidelberg 1999
- Snellen et al. (1999) Snellen, I. A. G., Schilizzi, R. T., Miley, G. K., Bremer, M. N., Röttgering, H. J. A., & van Langevelde, H. J. 1999, New Astronomy Review, 43, 675
- Stevens et al. (2003) Stevens, J. A., et al. 2003, Nature, 425, 264
- Teplitz et al. (2001) Teplitz H.I., Hill, R.S., Malumuth, E.M., Collins, N.R., Gardner, P.P., Woodgate, B.E., 2001, ApJ, 548, 127
- Vanzella et al. (2001) Vanzella, E., et al. 2001, AJ, 122, 2190
- Vanzella et al. (2002) Vanzella, E., et al. 2002, A&A, 396, 847
- Vanzella et al. (2004) Vanzella, E., et al. 2004, A&A, 423, 761
- Waddington et al. (1999) Waddington, I., Windhorst, R. A., Cohen, S. H., Partridge, R. B., Spinrad, H., & Stern, D. 1999, ApJ, 526, L77
- Williams et al. (1996) Williams, R. E. et al. 1996 AJ, 112, 1335
- Williams et al. (2000) Williams, R. E. et al. 2000 AJ, 120, 2735
- Yahata et al (2000) Yahata, N., Lanzetta, K.M., Chen, H-W., Fernandez-Soto, A., Pascarelle, S.M., Yahil, A.M., Puetter, R.C. 2000 ApJ, 538, 493
- Yun, Reddy, & Condon (2001) Yun, M. S., Reddy, N. A., & Condon, J. J. 2001, ApJ, 554, 803
| Field | HST Candidate | Pointing centre (J2000) | Peak Flux | rms | |
|---|---|---|---|---|---|
| Name | Fields | RA | Dec | (mJy) | (mJy) |
| 1A/B | 1A & 1B | 22:50:13.92 | -60:19:26.2 | 53 | 0.097 |
| 3A/QSO | 3A & QSO (see note) | 22:33:18.63 | -60:36:52.0 | 155 | 0.116 |
| 4A | 4A | 22:13:33.47 | 61:02:03.0 | 69 | 0.090 |
| 15A/B | 15A & 15B | 23:30:44.28 | 60:28:17.0 | 42 | 0.087 |
| 12A/B | 12A & 12B | 00:37:44.31 | 62:18:37.8 | 179 | 0.193 |
| 11A/B | 11A & 11B | 02:51:22.97 | 60:34:36.0 | 59 | 0.102 |
| 16A | 16A | 02:49:28.97 | 63:30:46.5 | 21 | 0.087 |
| 14A | 14A | 04:12:58.98 | 59:02:15.8 | 20 | 0.082 |
| Central | Primary beam | Pointing centre (J2000) | Total Hours | Central | |
|---|---|---|---|---|---|
| frequency | FWHP/arcmin | RA | Dec | per band | rms Jy |
| 1.4 GHz | 33 | 22:33:25.96 | 60:38:09.0 | 190 | 16.1 |
| 2.5 GHz | 22 | 22:33:25.96 | 60:38:09.0 | 190 | 11.4 |
| 5.1 GHz | 10 | 22:32:56.22 | 60:33:02.7 | 208 | 10.9 |
| 8.7 GHz | 5 | 22:32:56.22 | 60:33:02.7 | 200 | 11.8 |
| Ref | Name | RA (J2000) | Dec (J2000) | S | S | S | S | PA | SN | band | qual | ||||
|---|---|---|---|---|---|---|---|---|---|---|---|---|---|---|---|
| 1 | ATHDFS_J223253.7603921 | 22:32:53.70 | 0.69 | 60:39:21.2 | 0.62 | 0.052 | - | - | - | 0 | 0 | 0 | 5.1 | L | 2 |
| 2 | ATHDFS_J223258.7603903 | 22:32:58.79 | 0.36 | 60:39:03.9 | 0.47 | 0.058 | - | - | - | 0 | 0 | 0 | 5.7 | L | 2 |
| 3 | ATHDFS_J223245.6603857 | 22:32:45.65 | 0.03 | 60:38:57.3 | 0.04 | 0.843 | 0.536 | - | - | 2.27 | 0.73 | 30.5 | 75.9 | L | 1 |
| 4 | ATHDFS_J223307.1603846 | 22:33:07.13 | 0.30 | 60:38:46.9 | 0.46 | 0.137 | 0.074 | - | - | 4.9 | 2.15 | 17 | 9 | L | 2 |
| 5 | ATHDFS_J223304.6603835 | 22:33:04.66 | 0.52 | 60:38:35.8 | 0.52 | 0.067 | - | - | - | 0 | 0 | 0 | 5.6 | L | 2 |
| 6 | ATHDFS_J223248.2603805 | 22:32:48.29 | 0.33 | 60:38:05.6 | 0.44 | 0.076 | - | - | - | 0 | 0 | 0 | 7.4 | L | 2 |
| 7 | ATHDFS_J223254.5603748 | 22:32:54.53 | 0.38 | 60:37:48.0 | 0.48 | 0.092 | - | - | - | 3.85 | 2.43 | 42.4 | 7.7 | L | 2 |
| 8 | ATHDFS_J223232.8603737 | 22:32:32.85 | 0.06 | 60:37:37.1 | 0.08 | 0.645 | 0.489 | 0.216 | - | 3.63 | 2 | 19.6 | 45.8 | L | 1 |
| 9 | ATHDFS_J223225.6603717 | 22:32:25.68 | 0.36 | 60:37:17.4 | 0.84 | 0.057 | - | - | - | 0 | 0 | 0 | 5.3 | L | 2 |
| 10 | ATHDFS_J223326.0603716 | 22:33:26.01 | 0.49 | 60:37:16.7 | 0.95 | 0.061 | - | - | - | 0 | 0 | 0 | 5 | L | 2 |
| 11 | ATHDFS_J223236.6603657 | 22:32:36.60 | 0.18 | 60:36:57.7 | 0.44 | - | 0.095 | - | - | 0 | 0 | 0 | 7.5 | S | 2 |
| 12 | ATHDFS_J223316.5603627 | 22:33:16.55 | 0.05 | 60:36:27.5 | 0.05 | 0.649 | 0.451 | 0.204 | - | 0 | 0 | 0 | 56.2 | L | 1 |
| 13 | ATHDFS_J223232.5603553 | 22:32:32.56 | 0.12 | 60:35:53.1 | 0.18 | 0.466 | 0.236 | 0.141 | - | 6.82 | 4.54 | 8.9 | 27.2 | L | 1 |
| 14 | ATHDFS_J223229.8603544 | 22:32:29.89 | 0.35 | 60:35:44.9 | 0.45 | 0.077 | - | - | - | 0 | 0 | 0 | 7.9 | L | 2 |
| 15 | ATHDFS_J223232.4603542 | 22:32:32.40 | 0.12 | 60:35:42.5 | 0.16 | 0.529 | 0.334 | 0.115 | - | 6.67 | 5.03 | 9.7 | 30 | L | 1 |
| 16 | ATHDFS_J223253.0603539 | 22:32:53.09 | 0.31 | 60:35:39.7 | 0.31 | 0.090 | - | - | - | 0 | 0 | 0 | 9.2 | L | 2 |
| 17 | ATHDFS_J223245.3603537 | 22:32:45.34 | 0.28 | 60:35:37.8 | 0.53 | 0.051 | - | - | - | 0 | 0 | 0 | 5.3 | L | 2 |
| 18 | ATHDFS_J223224.0603537 | 22:32:24.02 | 0.03 | 60:35:37.7 | 0.04 | 1.259 | 0.836 | 0.396 | - | 3.53 | 2.27 | 32.3 | 97.1 | L | 1 |
| 19 | ATHDFS_J223338.8603523 | 22:33:38.84 | 0.13 | 60:35:23.8 | 0.19 | 0.185 | 0.145 | - | - | 0 | 0 | 0 | 18.5 | L | 1 |
| 20 | ATHDFS_J223223.7603520 | 22:32:23.70 | 0.50 | 60:35:20.5 | 0.91 | 0.142 | - | - | - | 9.1 | 4.98 | 4.4 | 6.4 | L | 2 |
| 21 | ATHDFS_J223230.2603503 | 22:32:30.21 | 0.13 | 60:35:03.5 | 0.29 | 0.113 | 0.128 | 0.076 | - | 0 | 0 | 0 | 11.9 | C | 2 |
| 22 | ATHDFS_J223229.2603459 | 22:32:29.21 | 0.14 | 60:34:59.5 | 0.15 | 0.192 | 0.081 | - | - | 0 | 0 | 0 | 20.3 | L | 1 |
| 23 | ATHDFS_J223247.4603450 | 22:32:47.41 | 0.56 | 60:34:50.0 | 0.39 | - | 0.059 | - | - | 0 | 0 | 0 | 5.3 | S | 2 |
| 24 | ATHDFS_J223307.1603448 | 22:33:07.18 | 0.55 | 60:34:48.8 | 1.08 | 0.103 | - | - | - | 8.75 | 1.85 | 20.7 | 5.3 | L | 2 |
| 25 | ATHDFS_J223212.3603448 | 22:32:12.39 | 0.54 | 60:34:48.7 | 0.49 | 0.093 | - | - | - | 5.21 | 2.35 | 72.7 | 6.9 | L | 2 |
| 26 | ATHDFS_J223243.3603442 | 22:32:43.32 | 0.23 | 60:34:42.5 | 0.30 | 0.063 | - | 0.047 | - | 0 | 0 | 0 | 5.1 | C | 2 |
| 27 | ATHDFS_J223216.6603434 | 22:32:16.63 | 0.55 | 60:34:34.9 | 0.84 | 0.052 | - | - | - | 0 | 0 | 0 | 5.5 | L | 2 |
| 28 | ATHDFS_J223231.6603423 | 22:32:31.69 | 0.26 | 60:34:23.1 | 0.39 | 0.070 | - | - | - | 0 | 0 | 0 | 7.2 | L | 2 |
| 29 | ATHDFS_J223245.5603419 | 22:32:45.51 | 0.13 | 60:34:19.0 | 0.16 | 0.265 | 0.150 | 0.06 | - | 0 | 0 | 0 | 6.9 | C | 2 |
| 30 | ATHDFS_J223311.9603417 | 22:33:11.97 | 0.41 | 60:34:17.1 | 0.52 | 0.059 | - | - | - | 0 | 0 | 0 | 5.1 | L | 2 |
| 31 | ATHDFS_J223327.6603414 | 22:33:27.67 | 0.05 | 60:34:14.3 | 0.07 | 0.456 | 0.498 | 0.262 | - | 1.38 | 0.75 | 69.7 | 34.1 | S | 1 |
| 32 | ATHDFS_J223329.7603351 | 22:33:29.74 | 0.19 | 60:33:51.9 | 0.26 | 0.152 | 0.081 | 0.073 | - | 0 | 0 | 0 | 5.3 | C | 2 |
| 33 | ATHDFS_J223243.4603351 | 22:32:43.47 | 0.06 | 60:33:51.0 | 0.20 | 0.098 | - | 0.066 | 0.114 | 0 | 0 | 0 | 8 | X | 2 |
| 34 | ATHDFS_J223306.0603350 | 22:33:06.07 | 0.09 | 60:33:50.3 | 0.13 | 0.452 | 0.288 | 0.123 | - | 4.45 | 2.76 | 11.5 | 31.2 | L | 1 |
| 35 | ATHDFS_J223258.5603346 | 22:32:58.59 | 0.02 | 60:33:46.7 | 0.03 | 1.010 | 0.658 | 0.404 | 0.238 | 2.23 | 1.33 | -16.3 | 103.9 | L | 1 |
| 36 | ATHDFS_J223225.0603338 | 22:32:25.05 | 0.28 | 60:33:38.7 | 0.64 | 0.080 | - | - | - | 0 | 0 | 0 | 7.5 | L | 2 |
| 37 | ATHDFS_J223247.6603337 | 22:32:47.65 | 0.42 | 60:33:37.0 | 0.56 | 0.075 | - | - | - | 0 | 0 | 0 | 6.8 | L | 2 |
| 38 | ATHDFS_J223253.1603329 | 22:32:53.15 | 0.58 | 60:33:29.1 | 0.71 | 0.113 | - | - | - | 6.36 | 4.96 | 34.4 | 6.3 | L | 2 |
| 39 | ATHDFS_J223337.5603329 | 22:33:37.57 | 0.03 | 60:33:29.1 | 0.04 | 1.126 | 0.718 | 0.373 | - | 2.58 | 1.22 | 9.3 | 88.1 | L | 1 |
| 40 | ATHDFS_J223302.8603323 | 22:33:02.83 | 0.61 | 60:33:23.8 | 0.40 | 0.051 | - | - | - | 0 | 0 | 0 | 5.2 | L | 2 |
| 41 | ATHDFS_J223306.2603307 | 22:33:06.26 | 0.09 | 60:33:07.9 | 0.35 | - | - | - | 0.071 | 0 | 0 | 0 | 5.6 | X | 2 |
| 42 | ATHDFS_J223339.4603306 | 22:33:39.41 | 0.62 | 60:33:06.0 | 0.32 | 0.058 | - | - | - | 0 | 0 | 0 | 5.6 | L | 2 |
| 43 | ATHDFS_J223327.9603304 | 22:33:27.95 | 0.13 | 60:33:04.8 | 0.17 | 0.221 | 0.187 | 0.093 | - | 0 | 0 | 0 | 19.8 | L | 1 |
| 44 | ATHDFS_J223329.2603302 | 22:33:29.28 | 0.44 | 60:33:02.0 | 0.59 | 0.059 | - | - | - | 0 | 0 | 0 | 5.4 | L | 1 |
| 45 | ATHDFS_J223242.6603258 | 22:32:42.66 | 0.06 | 60:32:58.1 | 0.20 | - | - | - | 0.077 | 0 | 0 | 0 | 5.3 | X | 2 |
| 46 | ATHDFS_J223234.2603257 | 22:32:34.27 | 0.61 | 60:32:57.4 | 0.79 | 0.057 | - | - | - | 0 | 0 | 0 | 6.1 | L | 2 |
| 47 | ATHDFS_J223209.7603253 | 22:32:09.71 | 0.58 | 60:32:53.9 | 0.56 | 0.061 | - | - | - | 0 | 0 | 0 | 5.1 | L | 2 |
| 48 | ATHDFS_J223308.6603251 | 22:33:08.60 | 0.06 | 60:32:51.7 | 0.08 | 0.821 | 0.394 | 0.196 | 0.092 | 6.59 | 1.82 | 32.6 | 55 | L | 1 |
| 49 | ATHDFS_J223323.2603249 | 22:33:23.25 | 0.03 | 60:32:49.2 | 0.04 | 0.457 | 0.561 | 0.360 | 0.223 | 0 | 0 | 0 | 32.9 | C | 1 |
| 50 | ATHDFS_J223229.5603243 | 22:32:29.55 | 0.07 | 60:32:43.6 | 0.16 | 0.237 | 0.140 | 0.108 | - | 0 | 0 | 0 | 10.5 | C | 1 |
| 51 | ATHDFS_J223212.9603243 | 22:32:12.95 | 0.04 | 60:32:43.3 | 0.06 | 1.466 | 0.903 | 0.657 | - | 5.84 | 4.24 | 5.5 | 77.9 | L | 1 |
| 52 | ATHDFS_J223317.7603235 | 22:33:17.75 | 0.41 | 60:32:35.2 | 0.38 | 0.070 | - | - | - | 0 | 0 | 0 | 7.3 | L | 2 |
| 53 | ATHDFS_J223212.9603234 | 22:32:12.90 | 0.03 | 60:32:34.6 | 0.03 | 2.816 | 1.574 | 0.716 | - | 7.07 | 2.77 | 54.7 | 147.3 | L | 1 |
| 54 | ATHDFS_J223335.3603234 | 22:33:35.31 | 0.35 | 60:32:34.5 | 0.55 | 0.054 | - | - | - | 0 | 0 | 0 | 5.5 | L | 2 |
| 55 | ATHDFS_J223331.6603222 | 22:33:31.64 | 0.08 | 60:32:22.2 | 0.11 | 0.395 | 0.286 | 0.120 | - | 3.31 | 2.46 | 2.4 | 32.4 | L | 1 |
| 56 | ATHDFS_J223302.1603213 | 22:33:02.18 | 0.33 | 60:32:13.2 | 0.43 | 0.063 | - | - | - | 0 | 0 | 0 | 6.4 | L | 2 |
| 57 | ATHDFS_J223303.1603132 | 22:33:03.17 | 0.35 | 60:31:32.8 | 0.47 | 0.052 | - | - | - | 0 | 0 | 0 | 5.2 | L | 2 |
| 58 | ATHDFS_J223254.4603131 | 22:32:54.41 | 0.47 | 60:31:31.5 | 0.41 | 0.139 | - | - | - | 6.91 | 3.17 | 64.1 | 9 | L | 2 |
| 59 | ATHDFS_J223316.0603127 | 22:33:16.09 | 0.43 | 60:31:27.6 | 0.67 | 0.052 | - | - | - | 0 | 0 | 0 | 5.3 | L | 2 |
| 60 | ATHDFS_J223256.4603058 | 22:32:56.42 | 0.39 | 60:30:58.9 | 0.35 | 0.074 | - | - | - | 0 | 0 | 0 | 8.5 | L | 2 |
| 61 | ATHDFS_J223304.8603031 | 22:33:04.89 | 0.44 | 60:30:31.2 | 0.25 | 0.084 | - | - | - | 0 | 0 | 0 | 8.2 | L | 2 |
| 62 | ATHDFS_J223241.4603025 | 22:32:41.42 | 0.30 | 60:30:25.9 | 0.27 | 0.092 | - | - | - | 0 | 0 | 0 | 9.4 | L | 2 |
| 63 | ATHDFS_J223216.6603016 | 22:32:16.67 | 0.54 | 60:30:16.7 | 0.51 | 0.052 | - | - | - | 0 | 0 | 0 | 5.2 | L | 2 |
| 64 | ATHDFS_J223303.9603013 | 22:33:03.96 | 0.46 | 60:30:13.6 | 1.05 | 0.052 | - | - | - | 0 | 0 | 0 | 5.1 | L | 2 |
| 65 | ATHDFS_J223331.1603007 | 22:33:31.14 | 0.31 | 60:30:07.9 | 0.40 | 0.094 | - | - | - | 0 | 0 | 0 | 9 | L | 2 |
| 66 | ATHDFS_J223224.7603005 | 22:32:24.77 | 0.66 | 60:30:05.5 | 0.47 | 0.055 | - | - | - | 0 | 0 | 0 | 5.1 | L | 2 |
| 67 | ATHDFS_J223236.5603000 | 22:32:36.56 | 0.02 | 60:30:00.6 | 0.03 | 1.507 | 0.877 | 0.394 | - | 3.71 | 1.33 | 30.0 | 129.7 | L | 1 |
| 68 | ATHDFS_J223253.7602946 | 22:32:53.78 | 0.38 | 60:29:46.7 | 0.52 | 0.045 | - | - | - | 0 | 0 | 0 | 5.1 | L | 2 |
| 69 | ATHDFS_J223316.8602934 | 22:33:16.80 | 0.02 | 60:29:34.7 | 0.05 | 1.003 | 0.811 | 0.569 | - | 1.45 | 0.44 | 1.5 | 37.4 | C | 1 |
| 70 | ATHDFS_J223329.1602933 | 22:33:29.16 | 0.12 | 60:29:33.4 | 0.22 | 0.261 | - | - | - | 5.36 | 1.3 | 3.5 | 20.3 | L | 1 |
| 71 | ATHDFS_J223301.8602930 | 22:33:01.82 | 0.41 | 60:29:30.2 | 0.72 | 0.071 | - | - | - | 0 | 0 | 0 | 7.1 | L | 1 |
| 72 | ATHDFS_J223303.0602927 | 22:33:03.00 | 0.34 | 60:29:27.1 | 0.67 | 0.116 | - | - | - | 7.22 | 3.83 | 1.4 | 8.2 | L | 1 |
| 73 | ATHDFS_J223317.7602916 | 22:33:17.72 | 0.50 | 60:29:16.0 | 0.72 | 0.059 | - | - | - | 0 | 0 | 0 | 5.2 | L | 2 |
| 74 | ATHDFS_J223236.2602855 | 22:32:36.20 | 0.31 | 60:28:55.6 | 0.62 | 0.079 | - | - | - | 0 | 0 | 0 | 7.5 | L | 2 |
| 75 | ATHDFS_J223307.7602853 | 22:33:07.73 | 0.25 | 60:28:53.8 | 0.55 | 0.068 | - | - | - | 0 | 0 | 0 | 6.5 | L | 2 |
| 76 | ATHDFS_J223326.9602850 | 22:33:26.94 | 0.15 | 60:28:50.0 | 0.22 | 0.182 | - | - | - | 2.93 | 1.13 | 5.7 | 16.3 | L | 1 |
| 77 | ATHDFS_J223330.5602849 | 22:33:30.55 | 0.51 | 60:28:49.7 | 0.90 | 0.047 | - | - | - | 0 | 0 | 0 | 5 | L | 2 |
| 78 | ATHDFS_J223307.0602827 | 22:33:07.07 | 0.11 | 60:28:27.8 | 0.15 | 0.354 | 0.192 | 0.101 | - | 4.58 | 2.6 | 32.4 | 26.6 | L | 1 |
| 79 | ATHDFS_J223255.9602810 | 22:32:55.99 | 0.20 | 60:28:10.1 | 0.38 | 0.108 | 0.244 | - | - | 0 | 0 | 0 | 10.3 | L | 2 |
| 80 | ATHDFS_J223240.7602755 | 22:32:40.71 | 0.34 | 60:27:55.3 | 0.38 | 0.139 | - | - | - | 3.77 | 2.56 | 68 | 9.2 | L | 2 |
| 81 | ATHDFS_J223311.5602725 | 22:33:11.53 | 0.32 | 60:27:25.1 | 0.40 | 0.344 | - | - | - | 9.06 | 6.09 | 33.7 | 13.2 | L | 2 |
| 82 | ATHDFS_J223241.5602719 | 22:32:41.50 | 0.09 | 60:27:19.8 | 0.13 | 0.351 | - | - | - | 0 | 0 | 0 | 28 | L | 1 |
| 83 | ATHDFS_J223244.5602719 | 22:32:44.57 | 0.33 | 60:27:19.2 | 0.60 | 0.088 | - | - | - | 0 | 0 | 0 | 7 | L | 2 |
| 84 | ATHDFS_J223317.1602714 | 22:33:17.11 | 0.38 | 60:27:14.1 | 0.73 | 0.122 | - | - | - | 8.19 | 0.86 | 22.1 | 7.6 | L | 2 |
| 85 | ATHDFS_J223312.3602707 | 22:33:12.30 | 0.41 | 60:27:07.9 | 0.51 | 0.078 | - | - | - | 0 | 0 | 0 | 7 | L | 2 |
| 86 | ATHDFS_J223257.4602657 | 22:32:57.44 | 0.39 | 60:26:57.4 | 0.49 | 0.083 | - | - | - | 0 | 0 | 0 | 7.3 | L | 2 |
| 87 | ATHDFS_J223259.9602654 | 22:32:59.93 | 0.33 | 60:26:54.8 | 0.69 | 0.061 | - | - | - | 0 | 0 | 0 | 5.5 | L | 2 |
| Ref | Name | z | V | R | I | J | K | log () | log ( | SFR | Classification | Notes | |
|---|---|---|---|---|---|---|---|---|---|---|---|---|---|
| (mJy) | |||||||||||||
| 3 | ATHDFS_J223245.6603857 | 0.843 | 0.75 | 25.45 | 24.6 | 23.39 | 23.63 | 2.72 | 515 | SB? | |||
| 7 | ATHDFS_J223254.5603748 | 0.092 | 0.1798 | 19.11 | 18.6 | 17.91 | 21.69 | 0.43 | 6 | Sy | |||
| 12 | ATHDFS_J223316.5603627 | 0.649 | 0.29 | 21.75 | 21.2 | 20.68 | 22.89 | 1.52 | 95 | spiral SB | |||
| 19 | ATHDFS_J223338.8603523 | 0.185 | 0.2250 | 20.04 | 19.3 | 18.61 | 18.28 | 17.74 | 22.17 | 0.15 | 19 | elliptical AGN | b |
| 26 | ATHDFS_J223243.3603442 | 0.063 | 0.4233 | 20.55 | 19.6 | 18.87 | 18.72 | 18.09 | 22.15 | 0.21 | 17 | spiral AGN? | b |
| 29 | ATHDFS_J223245.5603419 | 0.265 | 0.4603 | 21.95 | 21.1 | 20.33 | 19.84 | 18.94 | 22.83 | 1.00 | 81 | SB | a |
| 31 | ATHDFS_J223327.6603414 | 0.456 | 0 | 0 | 28 | 26 | 3.50 | GPS | h | ||||
| 33 | ATHDFS_J223243.4603351 | 0.098 | 1.5660 | 20.28 | 19.9 | 19.45 | 19.78 | 19.53 | 23.07 | 0.21 | 142 | QSO | a |
| 34 | ATHDFS_J223306.0603350 | 0.452 | 0.1733 | 17.77 | 17.2 | 16.58 | 16.68 | 16.36 | 22.36 | 0.27 | 27 | SB | a |
| 35 | ATHDFS_J223258.5603346 | 1.010 | 1.69 | 0 | 25 | 25.75 | 23.44 | 22.31 | 24.12 | 3.74 | 1579 | Dusty AGN? | d |
| 37 | ATHDFS_J223247.6603337 | 0.075 | 0.5803 | 21.05 | 20.0 | 19.16 | 18.86 | 18.17 | 22.43 | 0.02 | 32 | Massive spiral | a |
| 39 | ATHDFS_J223337.5603329 | 1.126 | 2.2380 | 17.16 | 16.9 | 16.51 | 16.92 | 16.40 | 24.28 | 0.10 | 2280 | RL QSO | b |
| 43 | ATHDFS_J223327.9603304 | 0.221 | 0 | 25 | 25 | 23.5 | 23.91 | 22.42 | 3.19 | obscured AGN | b | ||
| 48 | ATHDFS_J223308.6603251 | 0.821 | 0.64 | 23.07 | 21.8 | 20.45 | 23.53 | 1.53 | 405 | AGN | |||
| 49 | ATHDFS_J223323.2603249 | 0.457 | 0 | 0 | 25 | 0 | 25.05 | 24.34 | 3.17 | GPS | b,f | ||
| 55 | ATHDFS_J223331.6603222 | 0.395 | 0.4652 | 21.24 | 20.6 | 19.9 | 19.58 | 18.78 | 23.01 | 1.00 | 123 | obscured SB | b |
| 67 | ATHDFS_J223236.5603000 | 1.507 | 0 | 25 | 25 | 23.5 | 3.02 | ? | |||||
| 69 | ATHDFS_J223316.8602934 | 1.003 | 0.12 | 22.53 | 22.7 | 21.05 | 22.42 | 1.86 | 35 | AGN | |||
| 70 | ATHDFS_J223329.1602933 | 0.261 | 0 | 0 | 23.9 | 0 | 2.09 | AGN | g |
![[Uncaptioned image]](/html/astro-ph/0505217/assets/x3.png)
![[Uncaptioned image]](/html/astro-ph/0505217/assets/x4.png)
![[Uncaptioned image]](/html/astro-ph/0505217/assets/x5.png)
![[Uncaptioned image]](/html/astro-ph/0505217/assets/x6.png)
![[Uncaptioned image]](/html/astro-ph/0505217/assets/x7.png)
![[Uncaptioned image]](/html/astro-ph/0505217/assets/x8.png)
![[Uncaptioned image]](/html/astro-ph/0505217/assets/x9.png)
![[Uncaptioned image]](/html/astro-ph/0505217/assets/x10.png)
![[Uncaptioned image]](/html/astro-ph/0505217/assets/x11.png)
![[Uncaptioned image]](/html/astro-ph/0505217/assets/x12.png)
![[Uncaptioned image]](/html/astro-ph/0505217/assets/x13.png)
![[Uncaptioned image]](/html/astro-ph/0505217/assets/x14.png)
![[Uncaptioned image]](/html/astro-ph/0505217/assets/x15.png)
![[Uncaptioned image]](/html/astro-ph/0505217/assets/x16.png)
![[Uncaptioned image]](/html/astro-ph/0505217/assets/x17.png)
![[Uncaptioned image]](/html/astro-ph/0505217/assets/x18.png)
![[Uncaptioned image]](/html/astro-ph/0505217/assets/x19.png)

