Scaling variability from stellar to supermassive black holes
Abstract
We investigate the correspondence between the variability seen in the stellar and supermassive black holes. Galactic Black Hole (GBH) power density spectra (PDS) are generally complex, and dependent on spectral state. In the low/hard state the high-frequency rollover in the PDS moves in a way which is not simply related to luminosity. Hence this feature can only be used as an approximate indicator rather than as an accurate tracer of black hole mass in AGN. The X-ray spectrum in the high/soft state is dominated by the disc in GBH, which is rather stable. We show that the PDS of the Comptonized tail in GBH can be much more variable, and that it is this which should be compared to AGN due to their much lower disc temperature. This bandpass effect removes a problem in interpreting the (often highly variable) Narrow Line Seyfert 1 (NLS1) galaxies as the counterparts of the high mass accretion rate GBH. Additionally, we speculate that some NLS1 (e.g. Akn 564) are counterparts of the very high state. The Comptonized tail in this state is also highly variable, but with PDS which can be roughly described as band-limited noise. This shape is similar to that seen in the low/hard state, so merely seeing such band-limited noise in the power spectrum of an AGN does not necessarily imply low luminosity. We also stress that Cyg X-1, often used for comparison with AGN, is not a typical black hole system due to its persistent nature. In particular, the shape of its power spectrum in the high/soft state is markedly different from that of other (transient) GBH systems in this state. The fact that the NLS1s NGC 4051 and MCG-6-30-15 do appear to show a power spectrum similar to that of the high/soft state of Cyg X-1 may lend observational support to theoretical speculation that the Hydrogen ionization disc instability does not operate in AGN.
keywords:
accretion, accretion discs – X-rays: binaries – X-rays: galaxies1 Introduction
Black holes have no hair; they are the simplest celestial objects, fully characterized by their mass and spin. Scaling between supermassive and Galactic black hole (GBH) systems should theoretically be very simple. There should be a fundamental similarity between the accretion flow as a function of , with only a weak dependence on black hole mass. For example, standard optically thick accretion disc models predict that the spectrum should be dominated by a multi-temperature blackbody component (Shakura & Sunyaev 1973), irrespective of the factor of – difference in mass. The only significant difference should be the energy at which the peak in the spectrum is observed (in representation, where is energy flux per unit energy). At the Eddington luminosity this should be 1 keV in GBH and 10 eV in AGN. The idea of a (mostly) mass-invariant accretion flow is also backed by observational evidence for simple scaling relations of the accretion flow between very different mass black holes (Merloni, Heinz & di Matteo 2003; Falcke, Körding & Markoff 2004).
However, observations also clearly show that the accretion flow is much more complicated than the simple Shakura-Sunyaev disc model. GBH show a variety of different types of X-ray spectral and variability behaviour, which are used to classify the accretion flow into different spectral states (e.g. Tanaka & Lewin 1995; van der Klis 2000; McClintock & Remillard 2005; Done & Gierliński 2003; Zdziarski & Gierliński 2004). At high luminosity () the GBH show two main spectral states, the high/soft (or thermal dominant) and very high (steep power law). Both of these generally have peak energy output at keV, as expected from an optically thick disc at these high mass accretion rates. However, they also show a tail of emission to higher energies produced by Compton scattering of seed photons from the disc by energetic electrons. This tail is rather complex (e.g. Gierliński et al. 1999), but can roughly be described by a power law. In the high/soft state this tail is rather weak and has energy spectral index (where ) while in the very high state, the tail carries a large fraction of the bolometric luminosity and has . Conversely, at lower luminosities the GBH can show qualitatively different emission, forming the low/hard state. Here they have only a weak disc component and have a dominant hard Comptonized tail. Again its shape is rather complex (e.g. the review by Zdziarski & Gierliński 2004), but can be roughly described as a power law of energy index = 0.5–1 (Tanaka & Lewin 1995; McClintock & Remillard 2005).
By analogy, the AGN should also show these different X-ray spectral states (see e.g. White, Fabian & Mushotzky 1984 for an early example of this), and hopefully these intrinsic differences in spectra could explain some of the different types of AGN behaviour which cannot be modelled in simple orientation dependent unification schemes. Very broadly, LINERS have very low , so might correspond to the extreme (hardest spectra) low/hard states seen in GBH, many Seyfert 1’s are at a few percent of Eddington, so could be bright low/hard state, while PG Quasars and especially Narrow Line Seyfert 1’s (NLS1’s) are generally at high , so would correspond to the high/soft or very high states of GBH (Pounds, Done & Osborne 1995; see e.g. Woo & Urry 2002, Boronson 2002 and Collin & Kawaguchi 2004 for estimates of ). However, unlike the GBH, transitions between these states are unobservable, making them more difficult to identify. The GBH make transitions between the spectral states on timescales of a few days (e.g. Cui et al. 1997; Wilson & Done 2001; Kalemci et al. 2004). This translates to timescales of 300 to years when scaled from M⊙ to – M⊙ black hole mass. The one exception is the very luminous system GRS 1915+105, where state transitions can occur on timescales of a few seconds (Belloni et al. 2000), implying 10–1000 days timescales in supermassive black holes.
Nonetheless, AGN do show substantial variability in their X-ray emission on timescales of days and even hours (e.g. Nandra et al. 1997). Instead of true state transitions, this must correspond to the GBH variability seen on much shorter timescales, between milliseconds and seconds. This range of timescales is usually studied via power density spectra (PDS). In the GBH the PDS shape between 0.001–100 Hz is a strong function of the spectral state of the source, showing that the spectral and timing behaviour are generally correlated. For example, in Cyg X-1, the overall shape of the PDS in the low/hard state can be approximately described as band- limited noise in representation (where is frequency and is variability power at that frequency), with a ‘flat top’ () so that most of the power is emitted between two break frequencies, Hz and Hz (e.g. Gilfanov, Churazov & Revnivtsev 1999). By contrast, its high/soft state has a high-frequency break at Hz (e.g. Gilfanov et al. 1999) and no low frequency break, so its overall shape is characteristic of a low-pass filter rather than of band-limited noise.
Here we look in more detail at the correspondence between AGN and GBH power spectra, as there is now a growing number of dedicated AGN monitoring campaigns. One of the goals of these studies is to use the characteristic timescales in the PDS to estimate the black hole mass in AGN. In particular we stress that the high-frequency break is not constant, even within the low/hard state, so while this break can be used as an indicator of black hole mass, it cannot be used to make accurate predictions. We also stress that at high mass accretion rates the GBH energy spectra are often dominated by the disc emission This has very little variability compared to the Comptonized tail (Churazov, Gilfanov & Revnivtsev 2001), so it suppresses the rms variability in the high/soft state GBH. The much lower disc temperature in AGN means that their spectra are dominated by the Comptonized tail, so this bandpass effect means that AGN can have much higher apparent rms variability. This removes one of the problems in identifying the often rapidly variable narrow line Seyfert 1 galaxies (Leighly 1999) as the supermassive counterparts of the high/soft state (Pounds et al. 1995), while other issues due to the shape of the PDS can be resolved by recognizing the diversity of possible high mass accretion rate states. We caution that Cyg X-1 does not sample a large range in mass accretion rate, and shows a possibly unique PDS in its high/soft state, so using this object as a template for AGN behaviour can severely distort attempts to scale the variability between supermassive and stellar black holes.
2 Power spectra of GBH
2.1 The data
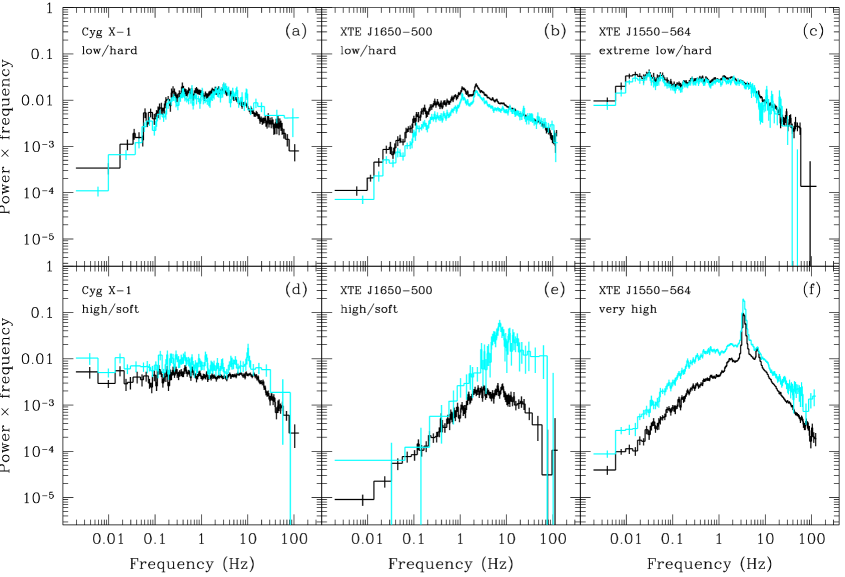
We extract power density spectra of several GBH corresponding to various spectral states in (1/256)–128 Hz frequency band from the Proportional Counter Array (PCA) onboard Rossi X-ray Timing Explorer (RXTE). These PDS, shown in Fig. 1 in black, are calculated over the full energy band of the PCA (2–60 keV). We also extract high-energy power spectra, from 13-25 keV (starting at PCA channel 36 for Cyg X-1 and XTE J1550–564, and 26 for XTE J1650–500, and ending at channel 71 to avoid the background dominated energies), shown in Fig. 1 in light grey (cyan in colour). This high-energy band excludes most of the disc emission, so these PDS show the variability of the Comptonized tail alone.
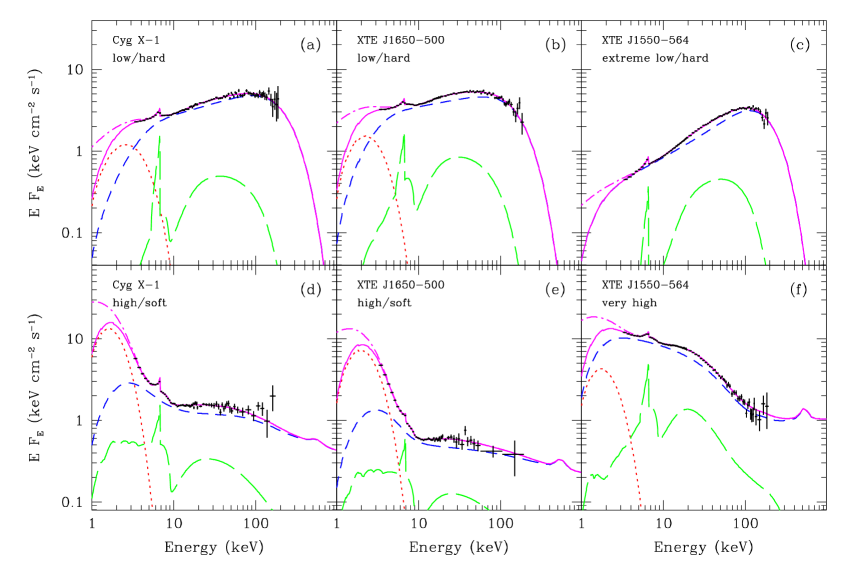
We also extract both PCA and HEXTE energy spectra from the same observations using standard extraction and background subtraction criteria. These are shown in Fig. 2, where they are deconvolved from the instrument responses using the best-fitting model consisting of a multicolour accretion disc (diskbb: Mitsuda et al. 1984), complex Comptonization (eqpair: Coppi 1999) and its reflection (Magdziarz & Zdziarski 1995; plus diskline: Fabian et al. 1989). The total spectral model is also shown corrected for interstellar absorption. The power and energy spectra in Figs. 1 and 2 were extracted from observations with the following archival numbers a: 50110-01-38-01 ( = 0.011), b: 60113-01-04-00 (0.049), c: 80135-01-02-00 (0.033), d: 10512-01-09-00 (0.063), e: 60113-01-19-00 (0.060), and f: 30191-01-13-00 (0.25). All values are calculated using bolometric luminosity estimated from the best-fitting model shown in Fig. 2. We used distances of 2 (Herrero et al. 1995), 5.3 (Orosz et al. 2002) and 4 kpc (Tomsick et al. 2003) and masses of 10 (Gierliński et al. 1999), 10 (Orosz et al. 2002) and 10 M⊙ (Orosz et al. 2004) for Cyg X-1, XTE J1550–564 and XTE J1650–500, respectively.
2.2 Low/hard state
Cyg X-1 is often used as the ‘canonical’ GBH. Figs. 1(a) and 2(a) show a typical power and energy spectrum from its low/hard state. The PCA energy spectrum is dominated by the hard Comptonized component, with little emission from the soft component visible in the data. The power spectra of the PCA data over the full- and high-energy bandpass are remarkably similar, with integrated fractional rms of and per cent, respectively, showing that the major variability on these timescales is produced by the normalization of the tail varying, rather than its spectral shape. The typical low/hard state band-limited noise is evident in the PDS, with most of the power contained between 0.2–3 Hz so that the flat top spans an order of magnitude in frequency.
As opposed to the Cyg X-1, which is a persistent high-mass X-ray binary, the low-mass X-ray binary XTE J1650–500 is a transient source. Its low/hard state PDS is shown in Fig. 1(b), with corresponding energy spectrum in Fig. 2(b). These data were chosen so that the energy spectrum closely matched that of Cyg X-1 in Fig. 2(a). The power spectra are similar, but differ in detail. Firstly, the shape of the power spectrum is less smooth – the band-limited noise is more clearly associated with QPO components in XTE J1650–500 than in Cyg X-1. Secondly the total rms is actually slightly decreased at higher energies, with per cent compared to in the full energy band, showing that the Comptonizing tail is pivoting with changing soft photon input (see Zdziarski et al. 2002 for similar behaviour in some ‘failed transition’ Cyg X-1 data).
Transient GBH allow us to probe the behaviour of the power spectra over a much wider range of low/hard states than are sampled by Cyg X-1, which actually varies rather little in total bolometric power (e.g. Done & Gierliński 2003). Fig. 1(c) shows the power spectra of an extreme low/hard state from another transient, XTE J1550–564, where the (approximately) flat part of the power spectrum now extends over 2.5 orders of magnitude in frequency. The corresponding energy spectrum (Fig. 2c) shows that the Comptonized tail completely dominates the emission. The total rms variability of the power spectra is unchanged between the full PCA and high-energy PCA bandpasses, at and per cent, respectively, showing that the variability is dominated by simply the normalization of the tail, as in the Cyg X-1 low/hard data (Fig. 1a).
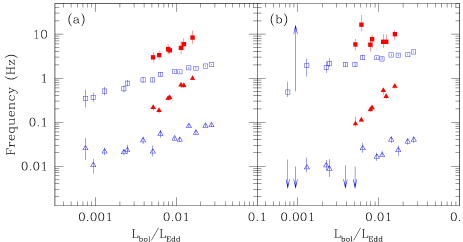
We can track the variation in these characteristic frequencies in the power spectrum throughout the low/hard state in this transient system. While multiple Lorentzian components are required to properly fit the PDS shape (Nowak 2000; Belloni, Psaltis & van der Klis 2003; Pottschmidt et al. 2003), the broad shape can be fairly well approximated by two Lorentzians (e.g. Axelsson, Borgonovo & Larsson 2005). We fitted the XTE J1550–564 power spectra from its 2000 and 2002 outbursts where the source was in the low/hard state by two Lorentzians, which gave a good description of the data. We also fitted the PCA/HEXTE broad-band energy spectra with a simple model consisting of the disc blackbody and thermal Comptonization (the model used by Done & Gierliński 2003) and used it to estimate the bolometric luminosity as a fraction of Eddington luminosity. The resulting peak frequencies of the two Lorentzians as a function of luminosity are shown in Fig. 3(a).
However, doubly broken power laws are generally used to fit AGN data. We would like to stress that generally these are not good description of the GBH power spectra, where much better statistics reveals complex spectral shape, not entirely consistent with a doubly broken power law. Nevertheless, we fitted the XTE J1550–564 power spectra by this model for comparison. We fixed the low- frequency PDS slope at zero, and the high-frequency slope at , and fitted for the low- and high-frequency breaks and the ‘flat top’ slope (which is generally close to unity), together with the overall normalization. We show the best-fitting break frequencies in Fig. 3(b). Though the break frequencies are different then the Lorentzian peak frequencies, the general behaviour from both models is similar: both frequencies move. This is more apparent for the low frequency break, which can change by at least a factor of 50 between the outbursts, while the high-frequency break can change by at least a factor 5 from the same object. This clearly shows that characteristic frequencies in the low/hard state power spectra cannot be used as an accurate tracer of black hole mass.
We stress that these data are all taken from within the low/hard state, with energy spectral index 1.5–1.6 and are not intermediate state or transition spectra. However, the behaviour seen in the 2000 outburst, where the low frequency break moves by much more than the high-frequency break, continues into the hard-to-soft transition. This has the effect of decreasing the extent of the flat top and hence decreasing to the total rms (Gilfanov et al. 1999; Churazov et al. 2001; Pottschmidt et al. 2003, Axelsson et al. 2005). A very simple model for this correlated spectral and variability change is one in which a hot inner flow filters a spectrum of fluctuations from an outer cool disc. The inner and outer radius of the hot flow determines the high- and low-frequency breaks, respectively. As the disc moves inwards, the outer edge of the hot flow decreases, and increases (Churazov et al. 2001), while the increasing disc flux for Compton scattering means that the spectrum gets softer.
2.3 High/soft state
Figs. 1(d) and 2(d) show power and energy spectra of a typical Cyg X-1 high/soft state. The energy spectrum is now dominated by the disc component in the lowest PCA channels, but with a tail to higher energies. The disc emission is rather constant, while the tail is more variable (Churazov et al. 2001) so the contribution of the disc to the PCA spectrum will clearly suppress the rms variability observed. Fig. 1(d) shows that the total rms observed increases from to per cent when the power spectrum is made from the high-energy data alone, where there is negligible disc emission. The power spectral shape is also clearly very different to that seen in the low/hard state. Its shape is now similar to a low pass filter, with only a single characteristic frequency which is the high-frequency rollover, Hz, while the flat top extends for over 4 decades in frequency.
Fig. 1(e) shows the power spectrum from equivalent high/soft state data from XTE J1650–500. These were chosen to closely match the energy spectrum to that seen from the Cyg X-1 high/soft data (Fig. 2e). Despite the strong energy spectral similarities, the power spectra are markedly different to that from the high/soft state in Cyg X-1 (Fig. 1d). The power spectrum of the high/soft state of XTE J1650–500 is strongly peaked. This matches smoothly onto the softest low/hard state power spectra described above, where the flat part of the power spectrum shrinks to a very small frequency range. Cyg X-1 can also show such peaked power spectra (during its ‘failed’ transitions to the high/soft state, Pottschmidt et al. 2003), but its ‘canonical’ high/soft power spectrum seems dominated by a rather different power spectral component (see Fig. 1(d), also Fig 16 of Axelsson et al. 2005).
The spectrum of the high/soft state of XTE J1650–500 shows that the disc spectrum dominates the low energy PCA bandpass, so can strongly suppress the apparent variability. The Compton tail alone (high-energy PCA bandpass) has rms variability of per cent, whereas including the lower energy, disc dominated channels gives total variability of only per cent.
It is rather difficult accumulate enough signal-to-noise in the power spectra of the hard tail in the high/soft state of GBH, especially when the disc has high temperature. Even if the tail is per cent of the bolometric luminosity, its contribution to the total PCA count rate is much smaller for a high-temperature disc than for a lower temperature one due to the decreasing instrument response at higher energies. However, we have examined all the available high-energy power spectra from the outbursts of many GBH and have never seen a high/soft state PDS which resembles that of the ‘canonical’ high/soft state derived from Cyg X-1. The high-energy power spectra are typically complex or strongly peaked, and show a variable rms from per cent.
Thus the Compton tail in the transient GBH shows a rather varied power spectrum in the high/soft state. It can be highly variable, with rms of per cent, or it can be fairly constant (though still more variable than the disc) with rms of per cent, but clearly there is no well defined power spectral amplitude. However, where the tail has high rms variability, as seen in Cyg X-1, its shape is very different, showing strongly peaked noise which resembles QPO components rather than the smooth low pass filter characteristic of Cyg X-1. The only transient GBH convincingly show a flat PDS extending over more than 3 orders of magnitude in frequency are those showing extreme low/hard energy spectra (Fig. 1c).
2.4 The very high state
Figs. 1(f) and 2(f) show the power and energy spectra of the very high state of XTE J1550–564. The energy spectrum clearly has a disc component, but the Comptonized emission is also very strong, and dominates most of the PCA emission. The power spectral shape, especially at high energies, is similar to the low/hard state power spectra i.e. band-limited noise, except that the QPO is much stronger and dominates the PDS (and makes the GBH PDS impossible to fit with the broken power law model). The total rms for the full- and high-energy bandpass are and per cent respectively, so clearly again the variability is more marked by excluding the disc emission, but the effect is not so drastic as in the high/soft state as the strong tail means the disc dilution is not so important. All very high state power spectra have high rms, and have this rather typical peaked noise shape, with strong QPOs.
Very high luminosities, even exceeding , can be seen from GRS 1915+105. While this source can show unique variability modes, probably connected with its uniquely high accretion rate (Done, Wardziński & Gierliński 2004), it spends about half of its time in a rather stable very high state (class : Belloni et al. 2000). PDS of these data show that they are very similar to those shown here for XTE J1550–564, with variability increasing at higher energies (Zdziarski et al. 2005).
3 Application to AGN
The GBH power and energy spectra shown in Figs 1 and 2 span the range of spectral states seen. However, they also illustrate the well– known lack of clean 1 to 1 correspondence between spectral state and luminosity (e.g. van der Klis 2001; McClintock & Remillard 2005) as all except the very high state are within a factor few from . While in general the low/hard state is seen at , it can extend up to on the rapid rise to outburst. As we have yet to clearly understand the relation between GBH and AGN energy spectra, we use as a guide to AGN spectral state. Those with are likely to correspond to high mass accretion rate GBH i.e. high/soft or very high state.
The much longer timescales involved mean that only a few AGN have been monitored to the extent that power spectra can be derived. The power spectra are also more complex to calculate than those from GBH as the data are generally unevenly sampled. This gives a broad window function which redistributes power over a wide range of frequencies, so reconstructing the intrinsic power spectrum is analogous to deriving the intrinsic energy spectrum from the broad spectral response of an X-ray proportional counter. Techniques for this reconstruction generally rely on Monte-Carlo simulations of the stochastic noise properties of a given power spectral form through the specific uneven sampling pattern corresponding to each AGN (Done et al. 1992; Uttley, McHardy & Papadakis 2002). These derived power spectra typically become less well defined at the lowest frequencies, so the uncertainties increase in the last decade in frequency of each reconstruction.
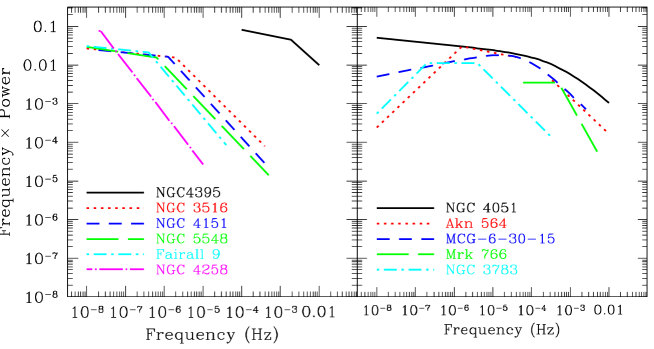
Table 1 gives basic data (black hole mass and Eddington fraction, which are uncertain by factors of at least 2–3) of a compilation of AGN from the literature which have published power spectra, which we reproduce the best-fitting models in Fig. 4a) and b) for low and high mass accretion rates, respectively.
The different disc temperatures expected in AGN and GBH means that there is a bandpass effect which masks the expected similarities in the spectra and variability of the accretion flow. While the X-ray spectra of both AGN and GBH should be dominated by the hard Comptonized tail at low , the higher temperature disc expected in the GBH means that this dominates their X-ray emission in the high/soft and very high states, while the corresponding AGN spectra will be dominated by the soft Comptonized tail seen in these states (see also McHardy et al. 2004). Thus the AGN power spectra should be compared only to the high-energy power spectra in GBH (cyan points in Fig 1) not that derived from the total X-ray bandpass (black points).
However, there is also a secondary issue which is the shape of the power spectrum. Cyg X-1 is not representative of the majority of the GBH in terms of its power spectra, despite being used as the ‘canonical’ object. Firstly, it is a persistent source, spanning very little range in bolometric luminosity, so never shows a very high state, nor an extreme low/hard state. Even over its limited observed range in it generally has a different power spectra to those of other (transient) GBH with similar energy spectra. In its high/soft state this is very marked, as the power spectra of the Compton tail has approximately equal power per decade between and Hz (probably extending down below Hz: Reig, Papadakis & Kylafis 2002), giving a high rms of per cent. By contrast the transient GBH with equivalent energy spectra show Compton tail power spectra which are often sharply peaked, or are complex, and have rms from per cent. The low/hard state power spectrum of Cyg X-1 is also subtly different from those seen in the transient systems, in that the QPO features are generally less marked.
| Source Name | M⊙ | Method | Type | Ref.1 | Ref.2 | |
|---|---|---|---|---|---|---|
| NGC 4258 | 7.62 | megamaser | 0.005 | LLAGN | WU02 | MU05 |
| Fairall 9 | 7.91 | reverberation | 0.16 | S1 | WU02 | M03 |
| NGC 5548 | 8.03 | reverberation | 0.05 | S1 | WU02 | M03 |
| NGC 4151 | 7.13 | reverberation | 0.03 | S1.5 | WU02 | M03 |
| NGC 3516 | 7.36 | reverberation | 0.06 | S1 | WU02 | M03 |
| NGC 4395 | 5.56(4.81) | reverberation(stellar velocity) | 0.0012(0.007) | S1 | P05, FH03 | VFI04 |
| NGC 3783 | 6.94 | reverberation | 0.23 | S1 | WU02 | M03 |
| Akn 564 | 6.9 | reverberation | 0.96 | NLS1 | R04 | V03, P02 |
| MCG-6-30-15 | 6.71 | stellar velocity | 0.40 | NLS1 | M05 | M05 |
| Mkn766 (aka NGC4253) | 6.54 | optical luminosity | 0.56 | NLS1 | WU02 | VF03 |
| NGC 4051 | 6.13 | reverberation | 0.21 | NLS1 | WU02 | M04 |
3.1 Low AGN
A key goal of the AGN PDS studies is to use the high-frequency break as a tracer of black hole mass. Fig. 3 shows that the high-frequency break of a broken power law description of the low/hard GBH PDS remains constant to within a factor 5, so while this cannot be used as an accurate tracer of black hole mass, it may give a zeroth order indication.
The AGN shown in the left panel of Fig. 4 with could correspond to a variety of spectral states. Nonetheless, their PDS are consistent with being similar in both normalization and shape, and the majority of AGN on this plot (all with rather similar masses around and accretion rates of : see Table 1), are compatible with scaling the high-frequency break from that seen in the bright low/hard state of Cyg X-1.
However, there are two clear exceptions to this, both of which are substantially lower objects. NGC 4258 again has similar mass of around , so its lower frequency break could be due to it corresponding to a more extreme low/hard state (see Fig 3). This is a clear counterexample to the idea of a universal PDS shape which depends only on mass (e.g Papadakis 2004; O’Neill et al. 2005), as indeed is shown by Fig. 3.
However, the lowest mass AGN known, NGC4395, is not so easy to fit into this pattern. From the reverberation mass, it should have a high-frequency break only a factor 100 higher than that from the other objects. Yet its break is orders of magnitude higher than that for NGC 4258, the most obvious object to scale from in terms of similarly low , and orders of magnitude from the majority of AGN in the figure. Either there is truly a difference in the variability properties of AGN and GBH, or the black hole mass in NGC 4395 is overestimated. Some evidence for the latter possibility is that this is the only object which has significantly different masses inferred from reverberation and stellar velocity dispersion estimates (refs). Assuming instead that the mass is , consistent with the stellar velocity upper limit, this gives and the PDS scales with mass in the same way as the majority of AGN on the figure.
3.2 High AGN
By contrast, Fig. 4b shows those AGN with . Most of these have masses of but their PDS are very heterogeneous. This corresponds well with the multiple different types of PDS shape which can be seen in the high/soft and very high states from GBH.
Two of these AGN (NGC 4051 and MCG-6-30-15, both NLS1’s) clearly show flat noise power extending over more than 4 decades in frequency. These look very like that of the high/soft state in Cyg X-1, taking into account uncertainties in the low frequency slope of the power spectra (McHardy et al. 2004; 2005). The total rms power in both is of order 25 per cent, again similar to that of the Comptonized tail in the high/soft state of Cyg X-1 (McHardy et al. 2004). Thus these AGN can be interpreted as the supermassive counterpart of the high/soft state Cyg X-1 data, which is not like the majority of transient GBH power spectra at high accretion rates.
However, another NLS1, Akn564, convincingly shows band-limited flat top noise, where the flat top extends over only 2 decades in frequency (Fig. 4 taken from a combination of low- and high-frequency data in Markowitz et al. 2003 and Vignali et al. 2004). Such band-limited, high rms ( 30 per cent) noise is consistent with the extreme low/hard state of GBH (Fig. 1c). However, Akn 564 has high (Table 1), so should instead be comparable to the high mass accretion rate GBH. Its PDS is clearly unlike that of NGC 4051 (and the high/soft state of Cyg X-1). Instead it could correspond to the PDS of the Compton tail seen in the very high state (transient) GBH. These likewise show band-limited noise similar to that of the low/hard state, with the flat top extending over two decades in frequency, though this is usually accompanied by a strong QPO (Fig. 1f, Zdziarski et al. 2005). However, current AGN data probably cannot rule out the presence of even a very strong QPO such as that seen in the very high state since the uneven sampling strongly smears out the power (Vaughan & Uttley 2005). If a QPO is not present with better sampling of the AGN light curve then it may be that Akn 564 instead represents a scaled up version of a very high state from a persistent GBH. There are as yet no data on such GBH systems (Cyg X-1 never shows a very high state), but we speculate by analogy with the Cyg X-1 low/hard state PDS that these would have weaker QPO features than those seen in the transient systems.
Band-limited noise is also probably detected in another high AGN, NGC 3783 (Markowitz et al. 2003). Here the situation is rather less clear, as , i.e. close to the maximum low/hard state luminosity. Uncertainties in mass and bolometric luminosity mean this could easily fall or rise by a factor 2–3. Thus this could either represent a bright low/hard state or a dim very high state (sometimes termed an intermediate state: Belloni et al. 1996; Méndez & van der Klis 1997). These different ‘states’ merge smoothly together in the GBH, which can be explained in the context of a truncated disc extending closer to the black hole, increasing the overlap between the disc and hot inner flow as the source moves from low/hard to intermediate and very high states (Wilson & Done 2001; Kubota & Done 2004).
The only other high AGN with published power spectrum is the NLS1, Mkn766. Here there is no data on long timescales, but the (evenly sampled) XMM-Newton data strongly indicate a break at Hz (Vaughan & Fabian 2003; Vaughan, Fabian & Iwasawa 2004). The normalization of the flat top noise is lower than that for the other AGN (high or low ), so this may correspond to a high state counterpart of a transient GBH.
4 The high/soft state of Cyg X-1 and its implications for AGN
Despite its use a template PDS, Cyg X-1’s timing properties are not typical of GBH. The high/soft state PDS is markedly different, with flat top (in ) extending over at least four orders of magnitude in frequency. By contrast, power spectra of the Compton tail in other GBH in the high/soft state are instead usually strongly peaked at 10 Hz, or have complex shapes.
The difference in Cyg X-1 is perhaps connected to the persistent nature of its emission due to the large accretion rate from its high-mass companion OB star. The X-ray bolometric luminosity varies by very little, = 0.01–0.1, over timescales of weeks–years. By contrast, most GBH have low-mass companions, with much lower mass transfer rates through the Roche lobe so have transient outbursts where the accretion flow luminosity changes from to 0.05–1 (e.g. McClintock, Narayan & Rybicki 2004). We speculate that the large dynamic range of variability seen in transients may excite a rather different noise spectrum of turbulence in the disc. The observed PDS is the convolution of this intrinsic power spectrum with the response of the disc (e.g. Psaltis & Norman 2000). For a particular disc geometry, the response of the disc (its filter) is fixed (Churazov et al. 2001; Psaltis & Norman 2000), but if the intrinsic noise spectrum changes then the observed PDS will also change.
It is currently unclear whether the disc instability which causes the dramatic outbursts in the transient GBH should also operate in AGN i.e. whether the initial spectrum of fluctuations is similar to that in Cyg X-1 or the transient GBH. The instability is triggered by the dramatic increase in opacity caused by the partial ionization of hydrogen at temperatures of K. Such temperatures are clearly expected in AGN (Siemiginowska, Czerny & Kostyunin 1996; Burderi, King & Szuszkiewicz 1998). However, this needs to propagate globally through the disc rather than being a purely local instability in order to produce dramatic outbursts, which requires a change in the effective viscosity parameter. This is probably produced in GBH discs by a change in viscosity mechanism, from the MRI where hydrogen is ionized, to much weaker processes (eg spiral arms) where hydrogen is neutral. Physically, this could be linked to the large change in density of free electrons between the parts of the disc in which hydrogen is ionized and neutral. If the neutral disc is very neutral, then the lack of charge carriers suppresses the coupling of magnetic fields to the disc, shutting off the MRI viscosity (Gammie & Menou 1998). However, AGN discs at the critical hydrogen ionization temperature are much less dense than GBH discs at this temperature. Recombination processes, especially three body recombination, will be much less efficient at these lower densities, so while hydrogen is mainly neutral there may be enough free electrons from potassium/iron etc to allow the MRI to still operate as a viscosity mechanism (Menou & Quataert 2001). Thus the hydrogen ionization point would not trigger a global instability in AGN discs (Janiuk et al. 2004). However, this is still to some extent speculative, so it is not yet known whether we expect AGN variability to be more like persistent GBH (i.e. Cyg X-1) or like the transients. The observation of a Cyg X-1 like high/soft power spectrum in the nearby NLS1 NGC 4051 argues for a suppression of the hydrogen ionization disc instability in this AGN, where the flat part of the power spectrum extends over more than 4 decades in frequency (McHardy et al. 2004). The lack of clear QPO signatures in AGN (while mainly due to lack of statistics on the relevant timescales: e.g. Vaughan 2005) may also be a feature of a different disc turbulence spectrum characteristic of persistent sources. Better AGN power spectra, with better constraints on potential QPO signatures could give observational insights into the operation of the MRI and hydrogen ionization instability in these massive discs.
5 Conclusions
Power spectra of AGN are used to estimate the black hole mass by scaling characteristic timescales (breaks) to those seen in the Galactic sources, most commonly using Cyg X-1 as the template PDS. However, this assumes that the PDS shape is constant, while the GBH show clearly that the characteristic frequencies change significantly even within a single GBH state, and that the whole shape of the PDS can change with state transitions. However, this does not mean that scaling cannot yield useful constraints, though it certainly cannot give accurate black hole masses. The high-frequency break changes by only a factor 5 within the low/hard state of GBH, and this is rather less than the discrepancy inferred from relating break frequency to mass for the lowest mass known AGN, NGC 4395. Either the mass of this black hole is overestimated (for which there is some additional evidence), or there is some other variability process occurring which breaks the correspondence between this AGN and the GBH.
At high mass accretion rates, the X-ray spectra from GBH can be dominated by the rather stable disc emission, while the much lower disc temperature in AGN means that their X-ray spectra are dominated instead by the Compton tail. This bandpass effect means that the low variability often cited as being characteristic of the high/soft state is characteristic of the disc. At higher energies, where Comptonization dominates, GBH can exhibit large amplitudes of variability, as required to match with AGN, especially the NLS1’s. The shape of the PDS in the high/soft state is generally strongly peaked, not at all like the low pass filter PDS characteristic of the high/soft state in Cyg X- 1. Since some NLS1s (NGC 4051 and MCG-6-30-15: McHardy et al. 2004; 2005) show PDS which look convincingly like Cyg X-1, we speculate that the Hydrogen ionization instability (which gives rise to the transient behaviour in GBH) does not operate in AGN. However, there are also some NLS1’s which show band-limited PDS, similar to those seen in the low/hard state. We show that such PDS can also be interpreted as transient high/soft state PDS or very high state PDS, so that band-limited noise is not a unique tracer of low mass accretion rates.
AGN variability can be interpreted as the supermassive analogue of the GBH variability, but only with careful matching of spectral states, and careful consideration of the different spectral components.
Acknowledgements
We thank A. Markowitz, A. Siemiginowska and P. Uttley for enthusiastic discussions and the anonymous referee for their useful comments. MG acknowledges support through a PPARC PDRF.
References
- [\citeauthoryearAxelsson, Borgonovo, & Larsson2005] Axelsson M., Borgonovo L., Larsson S., 2005, A&A, 438, 999
- [\citeauthoryearBelloni et al.1996] Belloni T., Mendez M., van der Klis M., Hasinger G., Lewin W. H. G., van Paradijs J., 1996, ApJ, 472, L107
- [Belloni et al.(2000)] Belloni, T., Klein-Wolt, M., Méndez, M., van der Klis, M., & van Paradijs, J. 2000, A&A, 355, 271
- [Belloni et al.(2002)] Belloni, T., Psaltis, D., & van der Klis, M. 2002, ApJ, 572, 392
- [Boroson(2002)] Boroson, T. A. 2002, ApJ, 565, 78
- [Burderi et al.(1998)] Burderi, L., King, A. R., & Szuszkiewicz, E. 1998, ApJ, 509, 85
- [Churazov et al.(2001)] Churazov, E., Gilfanov, M., & Revnivtsev, M. 2001, MNRAS, 321, 759
- [Collin & Kawaguchi(2004)] Collin, S., & Kawaguchi, T. 2004, A&A, 426, 797
- [Coppi(1999)] Coppi, P. S. 1999, ASP Conf. Ser. 161: High Energy Processes in Accreting Black Holes, 161, 375
- [Cui et al.(1997)] Cui, W., Zhang, S. N., Focke, W., & Swank, J. H. 1997, ApJ, 484, 383
- [Done & Gierliński(2003)] Done, C., & Gierliński, M. 2003, MNRAS, 342, 1041
- [Done et al.(2004)] Done, C., Wardziński, G., & Gierliński, M. 2004, MNRAS, 349, 393
- [\citeauthoryearDone et al.1992] Done C., Madejski G. M., Mushotzky R. F., Turner T. J., Koyama K., Kunieda H., 1992, ApJ, 400, 138
- [Fabian et al.(1989)] Fabian, A. C., Rees, M. J., Stella, L., & White, N. E. 1989, MNRAS, 238, 729
- [Falcke et al.(2004)] Falcke, H., Körding, E., & Markoff, S. 2004, A&A, 414, 895
- [\citeauthoryearFilippenko & Ho2003] Filippenko A. V., Ho L. C., 2003, ApJ, 588, L13
- [Gammie & Menou(1998)] Gammie, C. F., & Menou, K. 1998, ApJ, 492, L75
- [Gierliński et al.(1999)] Gierliński, M., Zdziarski, A. A., Poutanen, J., Coppi, P. S., Ebisawa, K., & Johnson, W. N. 1999, MNRAS, 309, 496
- [Gilfanov et al.(1999)] Gilfanov, M., Churazov, E., & Revnivtsev, M. 1999, A&A, 352, 182
- [\citeauthoryearHerrero et al.1995] Herrero A., Kudritzki R. P., Gabler R., Vilchez J. M., Gabler A., 1995, A&A, 297, 556
- [\citeauthoryearJaniuk et al.2004] Janiuk A., Czerny B., Siemiginowska A., Szczerba R., 2004, ApJ, 602, 595
- [] Kalemci, E.; Tomsick, J. A.; Rothschild, R. E.; Pottschmidt, K.; Kaaret, P. 2004, ApJ, 603, 231
- [\citeauthoryearKubota & Done2004] Kubota A., Done C., 2004, MNRAS, 353, 980
- [Leighly(1999)] Leighly, K. M. 1999, ApJS, 125, 297
- [] Magdziarz P., Zdziarski A., 1995, MNRAS, 273, 837
- [\citeauthoryearMarkowitz & Uttley2005] Markowitz A., Uttley P., 2005, ApJ, 625, L39
- [Markowitz et al.(2003)] Markowitz, A., et al. 2003, ApJ, 593, 96
- [McHardy et al.(2004)] McHardy, I. M., Papadakis, I. E., Uttley, P., Page, M. J., & Mason, K. O. 2004, MNRAS, 348, 783
- [\citeauthoryearMcHardy et al.2005] McHardy I. M., Gunn K. F., Uttley P., Goad M. R., 2005, MNRAS, 359, 1469
- [] McClintock J.E., Remillard R., 2005, in ”Compact Stellar X-ray Sources,” eds. W.H.G. Lewin and M. van der Klis, Cambridge University Press, in press
- [McClintock et al.(2004)] McClintock, J. E., Narayan, R., & Rybicki, G. B. 2004, ApJ, 615, 402
- [\citeauthoryearMendez & van der Klis1997] Méndez M., van der Klis M., 1997, ApJ, 479, 926
- [Menou & Quataert(2001)] Menou, K., & Quataert, E. 2001, ApJ, 552, 204
- [Mitsuda et al.(1984)] Mitsuda, K., et al. 1984, PASJ, 36, 741
- [Merloni et al.(2003)] Merloni, A., Heinz, S., & di Matteo, T. 2003, MNRAS, 345, 1057
- [Nandra et al.(1997)] Nandra, K., George, I. M., Mushotzky, R. F., Turner, T. J., & Yaqoob, T. 1997, ApJ, 476, 70
- [\citeauthoryearNowak2000] Nowak M. A., 2000, MNRAS, 318, 361
- [O’Neill et al.(2005)] O’Neill, P. M., Nandra, K., Papadakis, I. E., & Turner, T. J. 2005, MNRAS, 251
- [\citeauthoryearOrosz et al.2002] Orosz J. A., et al., 2002, ApJ, 568, 845
- [\citeauthoryearOrosz et al.2004] Orosz J. A., McClintock J. E., Remillard R. A., Corbel S., 2004, ApJ, 616, 376
- [\citeauthoryearPapadakis2004] Papadakis I. E., 2004, MNRAS, 348, 207
- [Papadakis et al.(2002)] Papadakis, I. E., Brinkmann, W., Negoro, H., & Gliozzi, M. 2002, A&A, 382, L1
- [Pottschmidt et al.(2003)] Pottschmidt, K., et al. 2003, A&A, 407, 1039
- [Pounds et al.(1995)] Pounds, K. A., Done, C., & Osborne, J. P. 1995, MNRAS, 277, L5
- [] Psaltis D., Norman C., 2000, astro-ph/0001391.
- [Reig et al.(2002)] Reig, P., Papadakis, I., & Kylafis, N. D. 2002, A&A, 383, 202
- [Shakura 1973] Shakura N. I., Sunyaev R. A., 1973, A&A, 24, 337
- [Siemiginowska et al.(1996)] Siemiginowska, A., Czerny, B., & Kostyunin, V. 1996, ApJ, 458, 491
- [] Tanaka Y., Lewin W. H. G. 1995, in X–Ray Binaries, ed. W. H. G. Lewin, J. van Paradijs & E. van den Heuvel (Cambridge: Cambridge Univ. Press), 126
- [\citeauthoryearTomsick et al.2003] Tomsick J. A., Kalemci E., Corbel S., Kaaret P., 2003, ApJ, 592, 1100
- [Uttley et al.(2002)] Uttley, P., McHardy, I. M., & Papadakis, I. E. 2002, MNRAS, 332, 231
- [] van der Klis M., 2000, ARA&A, 38, 717
- [\citeauthoryearvan der Klis2001] van der Klis M., 2001, ApJ, 561, 943
- [\citeauthoryearVaughan2005] Vaughan S., 2005, A&A, 431, 391
- [\citeauthoryearVaughan & Fabian2003] Vaughan S., Fabian A. C., 2003, MNRAS, 341, 496
- [] Vaughan S., Uttley P., 2005, preprint, astro-ph/0506456
- [\citeauthoryearVaughan, Fabian, & Iwasawa2004] Vaughan S., Fabian A. C., Iwasawa K., 2004, preprint, astro-ph/0412695
- [\citeauthoryearVignali et al.2004] Vignali C., Brandt W. N., Boller T., Fabian A. C., Vaughan S., 2004, MNRAS, 347, 854
- [Wilson & Done (2001)] Wilson C. D., Done C. 2001, MNRAS, 325, 167
- [White et al.(1984)] White, N. E., Fabian, A. C., & Mushotzky, R. F. 1984, A&A, 133, L9
- [\citeauthoryearWoo & Urry2002] Woo J.-H., Urry C. M., 2002, ApJ, 579, 530
- [Zdziarski & Gierliński(2004)] Zdziarski, A. A., & Gierliński, M. 2004, Progress of Theoretical Physics Supplement, 155, 99
- [Zdziarski et al.(2002)] Zdziarski, A. A., Poutanen, J., Paciesas, W. S., & Wen, L. 2002, ApJ, 578, 357
- [\citeauthoryearZdziarski et al.2005] Zdziarski A. A., Gierliński M., Rao A. R., Vadawale S. V., Mikołajewska J., 2005, MNRAS, 360, 825