A Puzzling Merger in A3266: the Hydrodynamic Picture from XMM-Newton
Abstract
Using the mosaic of nine XMM-Newton observations, we study the hydrodynamic state of the merging cluster of galaxies Abell 3266. The high quality of the spectroscopic data and large field of view of XMM-Netwon allow us to determine the thermodynamic conditions of the intracluster medium on scales of order of 50 kpc. A high quality entropy map reveals the presence of an extended region of low entropy gas, running from the primary cluster core toward the northeast along the nominal merger axis. The mass of the low entropy gas amounts to approximately solar masses, which is comparable to the baryonic mass of the core of a rich cluster. We test the possibility that the origin of the observed low entropy gas is either related to the disruption a preexisting cooling core in Abell 3266 or to the stripping of gas from an infalling subcluster companion. We find that both the radial pressure and entropy profiles as well as the iron abundance of Abell 3266 do not resemble those in other known cooling core clusters (Abell 478). Thus we conclude that the low entropy region is subcluster gas in the process of being stripped off from its dark matter halo. In this scenario the subcluster would be falling onto the core of A3266 from the foreground. This would also help interpret the observed high velocity dispersion of the galaxies in the cluster center, provided that the mass of the subcluster is at most a tenth of the mass of the main cluster.
subm. to ApJ 2005, April 11
1 Introduction
Current theories of structure formation are based on hierarchical models whereby small structures form first and, by assembly, build up the larger structures. In this picture, mergers play an important role, not only in driving the formation of galaxy clusters, but also in affecting the properties of the intra-cluster medium such as their thermodynamic conditions, metal content and the like. The occurrence of a merger event results in dramatic consequences for the systems that take part in it. As a large amount of energy is released in the process, the intracluster medium is strongly stirred up which results in the production of shocks and turbulence (Miniati et al. 2000, Schuecker et al. 2004). Furthermore, the trans/super-sonic infalling subsystem may be stripped off of their gas by ram pressure work (Gunn & Gott 1972). This mechanism may supply the main cluster with low-entropy gas, and perhaps with high metalicity too (Motl et al. 2004). In addition, disruption of cool condensations and abundance gradients may result in the cluster center. Until now, however, the evidence the latter has been only ex post facto in that post-merger systems appear to lack central cool gas reservoirs and central abundance enhancements so that little is known of the intermediate evolutionary stages.
In this paper we study the properties of the intracluster medium in Abell 3266 (also known as Sersic 40-6), a well studied cluster merger with redshift of 0.0594, but still not fully understood. A statistical analysis of the galaxy kinematical data (Quintana et al. 1996) show evidence of a merger. They show that the velocity dispersion in the center, 1300 km s-1, is significantly higher than the global value of 1000 km s-1. This was interpreted as evidence of a relatively localized merger in progress that has increased the internal energy of the cluster primarily in the central region. However, no more than 10% of the galaxies appear to be falling into the cluster along the line-of-sight and this is at a velocity of less than 1000 km s-1; much less than typical velocities associated with low Mach numbers shocks in the cluster center.
The central cD galaxy in Abell 3266 is in a dumbbell morphology. Multiple nuclei are found in over 25% of the first rank galaxies in rich clusters (Hoessel 1980). The relative velocity of the dumbbell, km-1, is larger than the stellar velocity dispersion of the cD nucleus, km-1, and may indicate that the pair was formed in the merger. However, the asymmetric rise in the stellar velocity dispersion of the cD peaks at around 700 km-1 (Carter et al. 1985) suggesting that the cD is tidally disturbed by a very massive object, more massive than the second nucleus.
Evidence of a merger in A3266 is also supported by X-ray data. This is provided by both the temperature structure of the ICM as well as the elongated morphology of the surface brightness of the system, as seen by ASCA (Henriksen, Donnelly, & Davis 2000) . These findings have recently been confirmed by Chandra data (Henriksen & Tittley 2002). In addition, the Chandra hardness map also suggests a cool, low entropy region running along the surface brightness elongation (the merger axis).
The temperature structure around the cluster center observed by Chandra could be produced by the propagation of a shock induced by the passage, off-center and in the plane of the sky, of an infalling clump during the initial phases of a merger (Henriksen & Tittley 2002). However, it is not clear yet whether this is the actual scenario because the geometry of the merger cannot be established conclusively by the current optical data. In any case, the extent and location of the low entropy region could hint at a link between the cD galaxy and the merger. The plume of cooler gas could be stripped material from the cD galaxy, or a disrupted cooling flow centered on the galaxies (Henriksen & Tittley 2002).
We have carried out analysis of XMM-Newton data of A3266. Given high quality of the data and the employment of newly developed reduction techniques (Briel et al. 2004), we are able to produce accurate maps that describe the thermodynamic state of the ICM in A3266. While the qualitative picture is confirmed, the new data provides a much more detailed picture of the merging process. This may serve as testbed to our understanding of the role of gas stripping on cluster scales.
The paper is organized as follows, in §2 we describe the observation, in §3 we present the results, followed by a discussion in §4.
We adopted a LCDM cosmology with , and km s-1 Mpc-1, which leads to a luminosity distance of Mpc and an angular scale of 56 kpc/arcminute for A3622.
2 Data
XMM-Newton (Jansen et al. 2001) has observed A3266 as a part of the GTO program of instrumental scientists at MPE. Tab.2 details the mosaic of the cluster, where column (1) is the name of the proposed field, (2) is the assigned XMM archival name, (3) R.A. and Decl. of the pointing, (4) net Epic-pn exposure after removal of flaring episodes, (5) XMM-Newton revolution number. All Epic-pn observations were performed using the extended full frame mode with the frame integration time of 199 ms and used Medium filter.
XMM Epic-pn log of A3266 cluster observation.
| Obs. | Pointing | net | XMM | |
|---|---|---|---|---|
| ID | R.A Decl. | exp. | Orbit | |
| (Eq.2000) | ksec | |||
| f1 | 0105260701 | 68.11125 -61.31277 | 13.6 | 149 |
| f2 | 0105260801 | 67.81583 -61.25916 | 15.2 | 154 |
| f3 | 0105260901 | 67.59833 -61.50888 | 17.8 | 153 |
| f4 | 0105261001 | 67.55541 -61.35055 | 4.3 | 147 |
| f5 | 0105261101 | 68.14791 -61.48361 | 6.6 | 146 |
| f6 | 0105262001 | 67.90416 -61.56722 | 1.9 | 145 |
| f5 | 0105262101 | 68.14791 -61.48361 | 3.5 | 146 |
| f4 | 0105262201 | 67.55541 -61.35055 | 2.9 | 147 |
| f6 | 0105262501 | 67.90416 -61.56722 | 3.5 | 598 |
The initial steps of data reduction are similar to the procedure tested on other XMM-Newton mosaics and is described in detail in Briel, Finoguenov, Henry (2004). Throughout our analysis we used XMMSAS 6.1. Details of our light curve screening could be found in Zhang et al. (2004). The analysis consists of two parts: estimating the image and temperature structure of the cluster and verifying it through the spectral analysis. The first part consists in producing temperature estimates, based on the calibrated wavelet-prefiltered hardness ratio maps and producing the projected pressure and entropy maps. Wavelet filtering is used to find the structure and control its significance. The background is considered differently in imaging and spectral analysis. In the first we use the in-field estimate of the background for every pointing, using events furthest from the optical axis of the telescope and bright emission zones of the A3266, where instrumental background should dominate and then subtract this background using the exposure maps with no vignetting normalized to reproduce the background level in the region selected for the background estimate.
The second, spectroscopy part of the analysis, uses the mask file, created based on the results of hardness ratio analysis described above. First application of this technique are presented in Finoguenov et al. (2004). For background removal we use the background accumulation, obtained with the medium filter, while we first refined our background subtraction by modeling the residual background observed at outskirts of A3266. We use the 0.5–7.9 keV band in the spectral analysis.
In our spectral analysis we use the APEC plasma code (Smith et al. 2001) to measure the temperature, element abundance (assuming the solar abundance ratio of Anders & Grevesse 1989) and emission measure. By making an estimate of the volume occupied by each emission zone it is then possible to recover the pressure and the entropy in absolute units, as detailed in Henry et al. (2004).
3 Results
Advantage of XMM-Newton over the previous missions consists in the ability to provide detailed temperature maps, which allows to study the pressure and entropy state of the cluster gas. In Finoguenov et al. (2004) and Briel et al. (2004) we have developed a simple technique for selecting the regions for the spectral analysis, using both image and hardness ratio as an input. The XMM exposure of A3266 allows to produce almost a hundred of spatially independent temperature estimates.
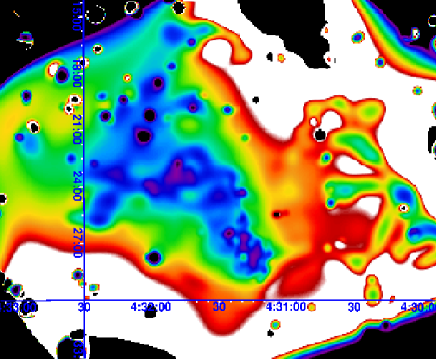
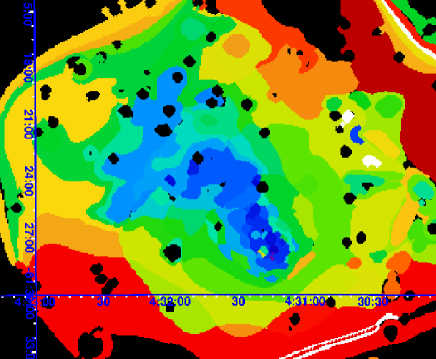

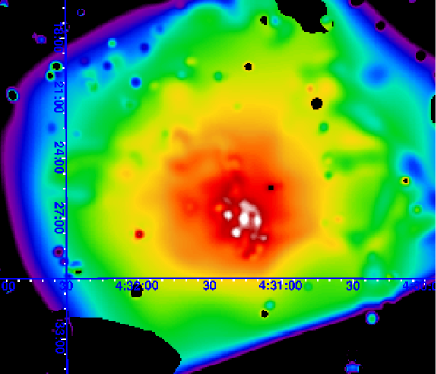
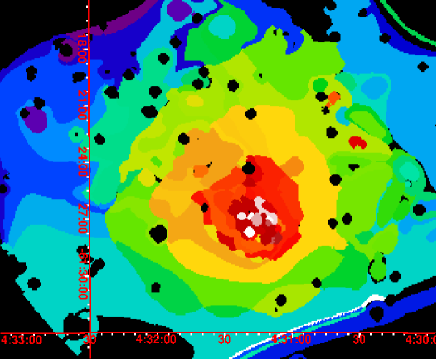

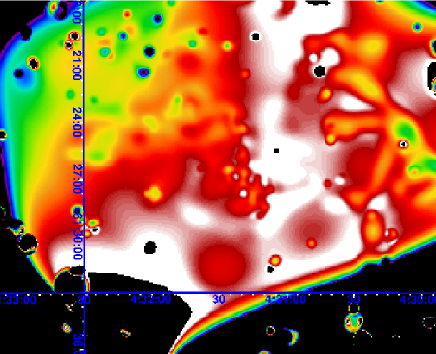
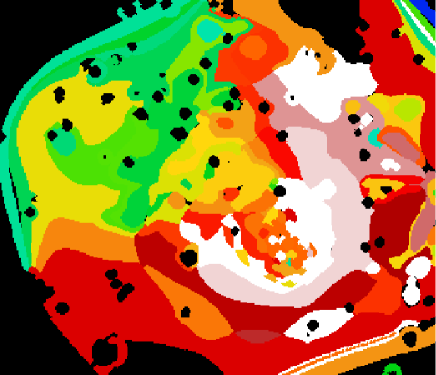

Fig.3–3 show maps of entropy, pressure and temperature, respectively, as obtained from the wavelet analysis (left) as well as from direct spectral analysis (right). The entropy map reveals the presence of a giant plume of low entropy gas (LEG hereafter) extending over to the north-east from the center. This is interesting because the distinct value of the entropy of the LEG suggests a common origin for it. The orientation of the LEG is aligned with the major axis of the merger, i.e. the axis of the elongated X-ray morphology. This strongly suggests an association for the origin of the LEG with the merger itself. The question is whether the LEG belongs to a cool core in A3266, now undergoing disruption, or it is just gas of an infalling subcluster undergoing ram pressure stripping. This will be addressed in the discussion section. The entropy in the LEG has significant structure on small but well resolved scales. In particular, local enhancements are clearly visible: these are either pre-existed as contact discontinuities due to inefficient mixing or have been recently produced by relatively weak shocks. In fact, all twelve major entropy enhancements have a corresponding pressure enhancement. Finally, these maps show a great number of the entropy dips in both the tail and overall: they are aligned with galaxies and galaxy subgroups, revealing a highly incomplete mixing of the gas in the merger. A detailed comparison of the entropy and dynamics of the cluster will be presented elsewhere.
The core region () exhibits fluctuations at the level of % for the entropy and % for the pressure, in respect to a power law approximation of the radial profile. In the central most , fluctuations of entropy are similar (%), while fluctuations of the pressure are higher (%). Signatures of disturbances are also visible in the outer regions (), particularly towards the NE. The R.M.S. of fluctuations amounts to % for the entropy and % for the pressure and are dominated by the asymmetries in the azimuthal distributions.
Finally, we comment on the temperature map, even though it is not independent of the previous two quantities. Fig. 3 reveals a slight temperature enhancement ahead of the region covered by the LEG, which may be due to gas compression and occasionally weak shocks as well. The structure seen in the entropy map is also reflected in the temperature. In the core region, temperature enhancements are also clearly seen in the pressure map, suggesting strong interactions leading to the formation of small scale shocks.
The results presented in the above maps are summarized and better quantified in Tab.3. There, in analogy to the procedure followed for the temperature map, we divide the observed region of A3266 in 33 regions with the same spectral temperature to within 1 keV. Fig.3 shows such regions. For each one of them, in Tab.3 we list the measured physical properties with their errors. In particular, Col. (1) and (2) corresponds to the zone labels, (3) to the temperature in keV, (4) iron abundance as a fraction of solar photospheric value of Anders & Grevesse (1989). Derived quantities, that use an estimation of the projected length, as described below are reported in cols.(5–7). These are entropy, pressure and the gas mass. No account for the gas mass not associated with the directly observed component was attempted. The numbers given in the table confirm that LEG consists of lower entropy and somewhat higher Fe abundance gas. In the very back of the LEG (regions 22, 30, 33) this separation becomes marginal.
![[Uncaptioned image]](/html/astro-ph/0505036/assets/x10.png)
Background subtracted, exposure and vignetting corrected image of A3266 in the 0.5–2 keV band. Contours indicate the zones of spectral extraction.
Properties of main regions of A3266.
| N | Name | S | P, | |||
| keV | keV cm2 | erg cm-3 | ||||
| low entropy gas (LEG) | ||||||
| 16 | head | 4.7 | ||||
| 19 | core | 13.6 | ||||
| 3 | striped core-1 | 2.7 | ||||
| 2 | striped core-2 | 12.0 | ||||
| 25 | striped core-3 | 2.0 | ||||
| 7 | SW core side | 1.8 | ||||
| 11 | S-edge of core | 3.8 | ||||
| 20 | shock-1 | 3.1 | ||||
| 15 | shock-2 | 1.2 | ||||
| 14 | shock-3 | 0.4 | ||||
| 5 | tail-1 | 38.6 | ||||
| 30 | tail-2 | 64.0 | ||||
| 33 | tail-3 | 18.2 | ||||
| 10 | S-edge of tail | 2.2 | ||||
| 13 | N-edge | 6.3 | ||||
| 22 | N-edge-2 | 17.3 | ||||
| other zones | ||||||
| 1 | main | 124. | ||||
| 21 | outskirts | 129. | ||||
| 9 | W group | 2.0 | ||||
| 31 | W group-2 | 1.5 | ||||
| 32 | W group-3 | 4.5 | ||||
4 Discussion and conclusions
The sum of the mass of the low entropy regions near the cluster core termed LEG in Table 2 indicates a total mass of . This mass is comparable to the core gas mass (r 250 kpc) of clusters with mass similar to Abell 3266 (Peres et al. 1998). It is also comparable to the total gas masses of cool, low mass clusters (Mohr, Mathiesen, & Evrard 1999), or to high mass groups (Mulchaey et al. 1996). Thus, the extended feature of low entropy gas is either the core of the main cluster or gas stripped off of a secondary merger component with a secondary-to-primary mass ratio of 1:10.
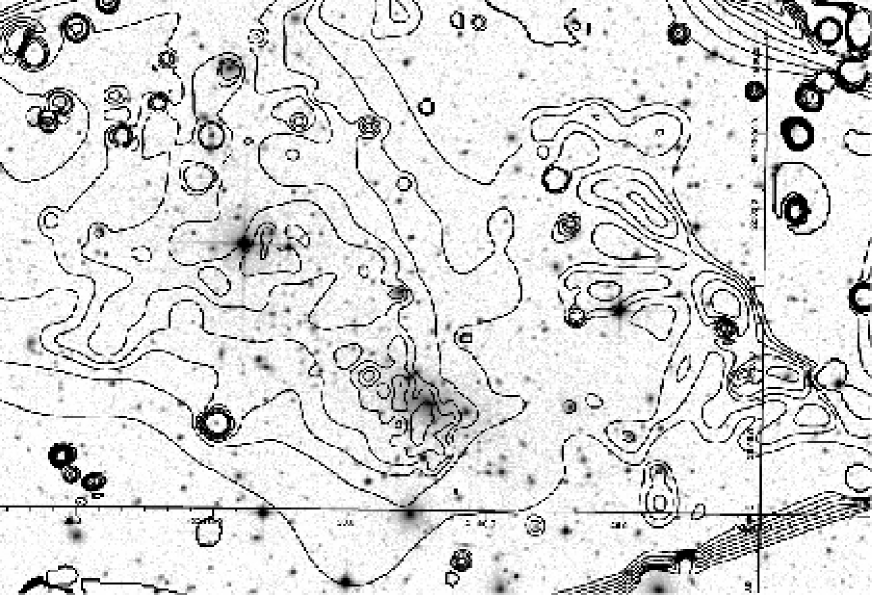
To tie the entropy map to the dynamics of the cluster we have produced in Fig. 4 an overlay of the DSS-2 red (optical) image of the A3266 with contours of equal entropy. Interestingly, the central concentration of galaxies, including the cD, lies well within the low entropy region. In particular the head of the LEG region is located at the position of the cD, although slightly shifted towards south-east. Therefore, based on their corresponding position on the sky, one would be led to straightforwardly associate the cool, low entropy gas with the cD and its surrounding galaxies. Thus, either the cool gas belongs to A3266 in which case it may suggest the pre-existence of a cool core there or, alternatively, the cD galaxy is a part of the infalling subclump. The intracluster gas from the lower mass secondary subcluster is typically characterized by the lower temperature.
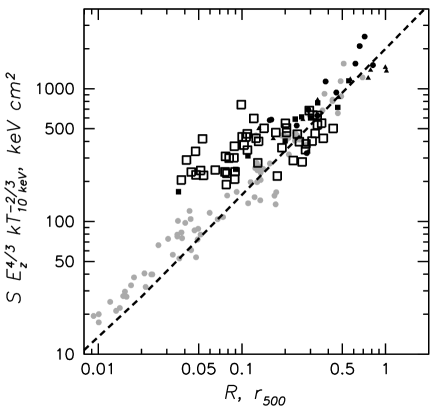
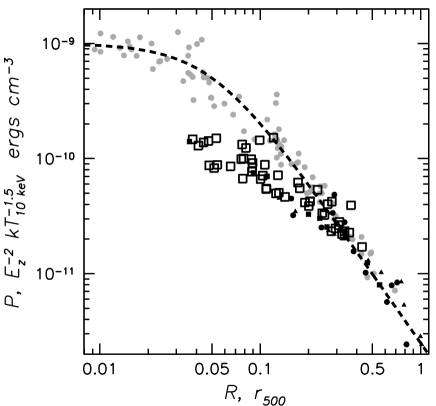
To test these hypothesis, in Fig.5, we plot the entropy and pressure radial profile for Abell 3266 together with several comparison clusters: A3562 in Shapley supercluster, A754, A3667 (Finoguenov et al. 2005), which are merging clusters and Abell 478, which is a cooling core cluster. As Fig. 5 shows, compared to Abell 478, the LEG region in A3266 exhibits a quite different radial profile in both entropy and pressure. At small radii, the entropy in the LEG region is systematically higher and the pressure is systematically lower. This suggests that, if the LEG originated in the primary cluster, then it would not be simply a stripped, pre-existing cool core. Also, the iron abundance in the LEG region is similar to that in the ICM of Coma, which does not have a cooling core (Arnaud et al. 2001), and is also similar to the rest of the cluster. In contrast, De Grandi et al. (2004) point out that central abundance enhancements are always found in cool cores and are associated with central galaxies. The fact that the abundance in the LEG is similar to that in the rest of the cluster further argues against its origin in a cool core.
The entropy and pressure profiles of the LEG region are more similar to the comparison clusters that are merging clusters than the cooling flow region of Abell 478 and may therefore be composed largely of the intracluster medium of the secondary cluster. This is generally consistent with hydrodynamical simulations showing that intracluster gas from a low mass secondary may be stripped as it passes through the high mass, high density core. Nonetheless, it is quite puzzling that the cD and the other core galaxies sit on top of the leading edge of the LEG. It is conceivable that we are seeing things in projections so that the LEG is falling onto the core of A3266 from the foreground. This scenario may not be as unlikely after all, as the infalling subclump aims at the core of the companion cluster (so as to produce a superposition along the line of sight). In addition, such a configuration may ease some of the optical arguments. In particular, this may explain the increasing apparent velocity dispersion of galaxies towards the center (Quintana et al. 1996; Henriksen, Donnelly, Davis 2000), as being caused by a displacement between the core of the main cluster and the infalling cluster. In order for this to be consistent with the optical data the mass of the subcluster must be in the ratio of no more than 1:10 with respect to the main cluster.
Alternatively, the morphology of the ”leading edge” of the LEG (i.e., compressed isophotes spatially coincident with the cD galaxy) could simply be due to sloshing of the core after an off-center merger (Tittley & Henriksen 2005).
Finally we note that Abell 3266 may have a more complex merger history than the single 1:10 mass ratio merger that has been proposed. On the west side of the cluster, there is an extended collection of entropy debris. Within the debris are several peaks that appear to be associated with galaxies (see Figure 4). The masses of the peaks are comparable to group masses (Mulchaey et al. 1996). This second region of low entropy gas may indicate an additional episode of merging as A3266 is the most prominent cluster in the southern Horologium cluster concentration.
Acknowledgments
This paper is based on observations obtained with XMM-Newton, an ESA science mission with instruments and contributions directly funded by ESA Member States and the USA (NASA). The XMM-Newton project is supported by the Bundesministerium für Bildung und Forschung/Deutsches Zentrum für Luft- und Raumfahrt (BMFT/DLR), the Max-Planck Society and the Heidenhain-Stiftung, and also by PPARC, CEA, CNES, and ASI. AF and FM thank the Joint Astrophysical Center of the UMBC for the hospitality during their visit. FM acknowledges support from the Zwicky Prize Fellowship program at ETH-Zürich.
References
- (1) Anders, E., & Grevesse, N. 1989, Geochimica et Cosmochimica Acta, 53, 197
- (2) Arnaud M., Aghanim, N., Gastaud, R., et al. 2001, A&A, 365, L67
- (3) Briel, U. G., Finoguenov, A., & Henry, J. P. 2004, A&A, 426, 1
- (4) Carter, D., Inglis, I., Ellis, R. S., Efstathiou, G., & Godwin, J. G. 1985, MNRAS, 212, 471
- (5) De Grandi, S., Ettori, S., Longhetti, M., & Molendi, S. 2004, A&A, 419, 7
- (6) Finoguenov, A., Pietsch, W., Aschenbach, B., & Miniati, F. 2004, A&A, 415, 415
- (7) Finoguenov, A., Böhringer, H., Osmond, J. P. F., et al. 2005, AdSpR, accepted
- (8) Gunn, J.E., Gott, J.R. 1972, ApJ, 176, 1
- (9) Henry, J. P., Finoguenov, A., & Briel, U. G. 2004, ApJ, 615, 181
- (10) Henriksen, M. J., Donnelly, R. H., & Davis, D. S. 2000, ApJ, 529, 692
- (11) Henriksen, M. J., & Tittley, E. R. 2002, ApJ, 577, 701
- (12) Hoessel, J. G. 1980, ApJ, 241, 493
- (13) Jansen, F., Lumb, D., Altieri, B., et al. 2001, A&A, 365, L1
- (14) Miniati, F., Ryu, D., Kang, H., Jones, T. W., Cen, R., Ostriker, J. P. 2000, ApJ, 542, 608
- (15) Mohr, J. J., Mathiesen, B., & Evrard, A. E. 1999, ApJ, 517, 627
- (16) Motl, P. M., Burns, J. O., Loken, C., Norman, M. L., & Bryan, G. 2004, ApJ, 606, 635
- (17) Mulchaey, J. S., Davis, D. S., Mushotzky, R. F., & Burstein, D. 1996, ApJ, 456, 80
- (18) Peres, C. B., Fabian, A. C., Edge, A. C., Allen, S. W., Johnstone, R. M., & White, D. A. 1998, MNRAS, 298, 416
- (19) Ponman, T. J., Sanderson, A. J. R., Finoguenov, A. 2003, MNRAS, 343, 331
- (20) Quintana, H., Ramirez, A., & Way, M. J. 1996, AJ, 112, 36
- (21) Strüder, L., Briel, U.G., Dennerl, K., et al. 2001, A&A, 365, L18
- (22) Schuecker, P., Finoguenov, A., Miniati, F., Böhringer, H., & Briel, U. G. 2004, A&A, 426, 387
- (23) Smith, R.K., Brickhouse, N.S., Liedahl, D.A., Raymond, J.C. 2001, ApJ, 556, L91
- (24) Tozzi, P. & Norman, C. 2001, ApJ, 546, 63
- (25) Tittley, E. R., & Henriksen, M. 2005, ApJ, 618, 227
- (26) Voit, M.G. 2004, Rev. Mod. Phys., in press, (astro-ph/0410173)
- (27) Zhang, Y.-Y., Finoguenov, A., Böhringer, H., Ikebe, Y., Matsushita, K., & Schuecker, P. 2004, A&A, 413, 49