The infrared-dominated jet of 3C 401
Abstract
We present a Hubble Space Telescope image of the FR II radio galaxy 3C 401, obtained at 1.6m with the NICMOS camera in which we identify the infrared counterpart of the brightest region of the radio jet. The jet has a complex radio structure and brightens where bending occurs, most likely as a result of relativistic beaming. We analyze archival data in the radio, optical and X-ray bands and we derive its spectral energy distribution. Differently from all of the previously known optical extragalactic jets, the jet in 3C 401 is not detected in the X-rays even in a long 48ksec X-ray Chandra exposure and the infrared emission dominates the overall SED. We propose that the dominant radiation mechanism of this jet is synchrotron. The low X-ray emission is then caused by two different effects: i) the lack of any strong external photon field and ii) the shape of the electron distribution. This affects the location of the synchrotron peak in the SED, resulting in a sharp cut-off at energies lower than the X-rays. Thus 3C 401 shows a new type of jet which has intermediate spectral properties between those of FR I, which are dominated by synchrotron emission up to X-ray energies and FR II/QSO, which show a strong high-energy emission due to inverse-Compton scattering of external photons. This might be a clue for the presence of a continuous “sequence” in the properties of large scale jets, in analogy with the “blazar sequence” already proposed for sub-pc scale jets.
Subject headings:
galaxies: active; galaxies: individual (3C 401); galaxies: jets; radiation mechanisms: non-thermal1. Introduction
The study of relativistic jets, which constitute a distinguishing feature of radio-loud AGN, has recently been revitalized by the discovery that a large number of radio jets are bright in the X-rays (e.g. Chartas et al., 2000; Sambruna et al., 2004; Worrall et al., 2001). While the emission process in the radio band is certainly non-thermal synchrotron radiation, the origin for the high energy emission is still unclear. Synchrotron and inverse-Compton radiation are the most accepted interpretations. The former process seems to predominate in low-power jets associated with radio galaxies belonging to the FR I class Fanaroff & Riley (1974), while in powerful quasars and radio galaxies the dominant mechanism is most likely inverse-Compton. In powerful QSOs, the seed photons for scattering may be provided by the cosmic microwave background radiation (Tavecchio et al., 2000; Celotti, Ghisellini, & Chiaberge, 2001). Such a scenario needs the jet to be relativistic on large scales (up to kpc or more), so that the CMB photon field is enhanced by relativistic beaming effects. This requirement is thus considered as a strong further evidence for relativistic motion on large scales, in addition to the well known jet to counter-jet asymmetries, lobe depolarization asymmetries (Laing, 1988; Garrington et al., 1988), core enhancement (e.g. Giovannini et al., 1994) and superluminal motions in QSO and radio galaxies in which the jet axis forms a small angle to the line-of-sight (Rees, 1966; Whitney et al., 1971).
Here we focus on 3C 401, which is a powerful FR II radiogalaxy located at a redshift of . In the radio, it shows a one-sided jet and two hot-spots which are clearly visible although they do not appear as compact as in more powerful (and more distant) FR II (Hardcastle et al., 1998). Nevertheless, its high radio-power ( erg s-1 Hz-1) is one order of magnitude higher than the fiducial FR I/FR II break. On the other hand, the characteristics of the environment are more typical of FR I radio galaxies, since the object is the cD of an Abell class 1 cluster of galaxies, while FR II are generally found in small groups. In the HST optical images (de Koff et al., 1996) the host galaxy appears as an elliptical galaxy of low surface brightness, with no clear sign of dust features. A close companion galaxy is located at arcsec from the nucleus of the radio source. From the point of view of its optical spectrum, 3C 401 belongs to the subclass of FR II which are dominated by low excitation emission lines (Low Excitation Galaxy, LEG). The object is again more similar to FR I also as far as the nuclear properties are concerned: the host galaxy shows a faint optical unresolved core which is most likely interpreted as the optical counterpart of the synchrotron radio core, similarly to the large majority of 3CR FR I (Chiaberge, Capetti, & Celotti, 2002). Therefore, its high power associated with FR I-like nuclear characteristics makes 3C 401 an extremely interesting object. A detailed study of the jet in “transition” sources may shed light on the physical processes which determine the properties of jets in sources of different total power.
In section 2 we describe our HST/NICMOS infrared observations, in section 3 we outline the jet morphology and we perform photometry, while observations at other wavelengths are analyzed in section 4. In section 5 we derive and model the spectral energy distribution of the jet, and in section 6 we discuss our findings and draw conclusions.
H km s-1 Mpc-1 and q are used throughout the paper.
2. Infrared HST observations
We have observed 3C 401 with HST/NICMOS as part of our snapshot program GO 10173. Our complete sample is derived from the 3CR catalog of extragalactic radio sources, limited to to take advantage of the highest spatial resolution HST can offer. The sample comprises 115 sources, 18 of which have been observed during previous cycles, as part of other HST programs.
The observations of 3C 401 were performed on August 11 2004. We used NICMOS camera 2 and the F160W filter, which is centered at 1.6037m and covers the spectral range from 1.4 to 1.8m. At the redshift of the source, the Pa emission line is included in the filter. However, due to its large bandwidth, continuum emission dominates. The field of view of the NIC-2 camera is 19.2 and the projected pixel size is 0.076. The total exposure time is 1152s, split into 4 images of 288s allowing 4-point dithering with sub-pixel spacing, in order to improve both the PSF sampling and bad-pixel removal. The details of the data reduction will be given in a forthcoming paper (Madrid et al., in preparation). Here we only briefly describe the main steps of the reduction.
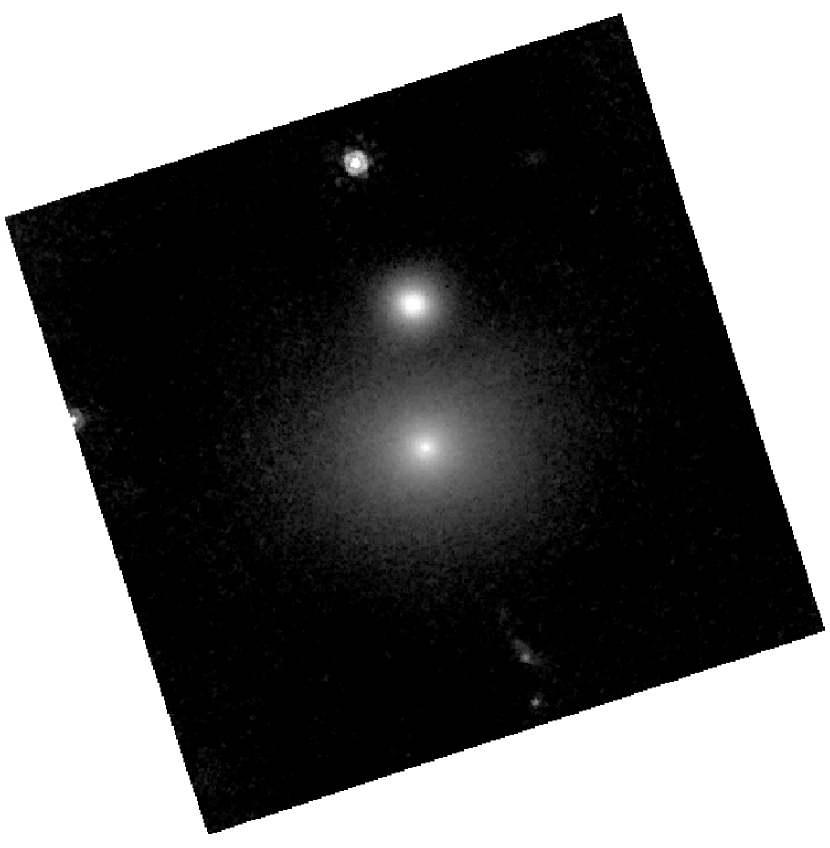
The raw data have been retrieved from the HST MAST (Multimission Archive at Space Telescope) and have been processed by the standard OTFR (On The Fly Reprocessing) calibration pipeline, which uses the latest calibration files. The subsequent reduction has been performed using IRAF. As a first step, we remove the “pedestal effect”111The pedestal effect is one of the main anomalies that appear in NICMOS images. It is a time varying, quadrant dependent bias level which appears in all NICMOS images. For more details, see http://www.stsci.edu/hst/nicmos. from each of the images using pedsky, and we subtract the residual background level. We then combine the four calibrated images using the drizzle algorithm (Fruchter & Hook, 2002). The final “drizzled” image is shown in Fig. 1. The projected pixel size in the final image is .
The host galaxy of the radio source 3C 401 is the largest object at the center of the field of view. A faint point source is present at the center of the galaxy. A close companion, which appears to be a smaller elliptical galaxy, is clearly visible, north of the nucleus of our target. A bright unresolved source located north of the galaxy is present in our image. This object is also visible in optical HST images, where it is slightly resolved. Since it does not appear to be related to any radio emitting feature, this object is most likely an infrared-bright field galaxy and will be studied elsewhere.
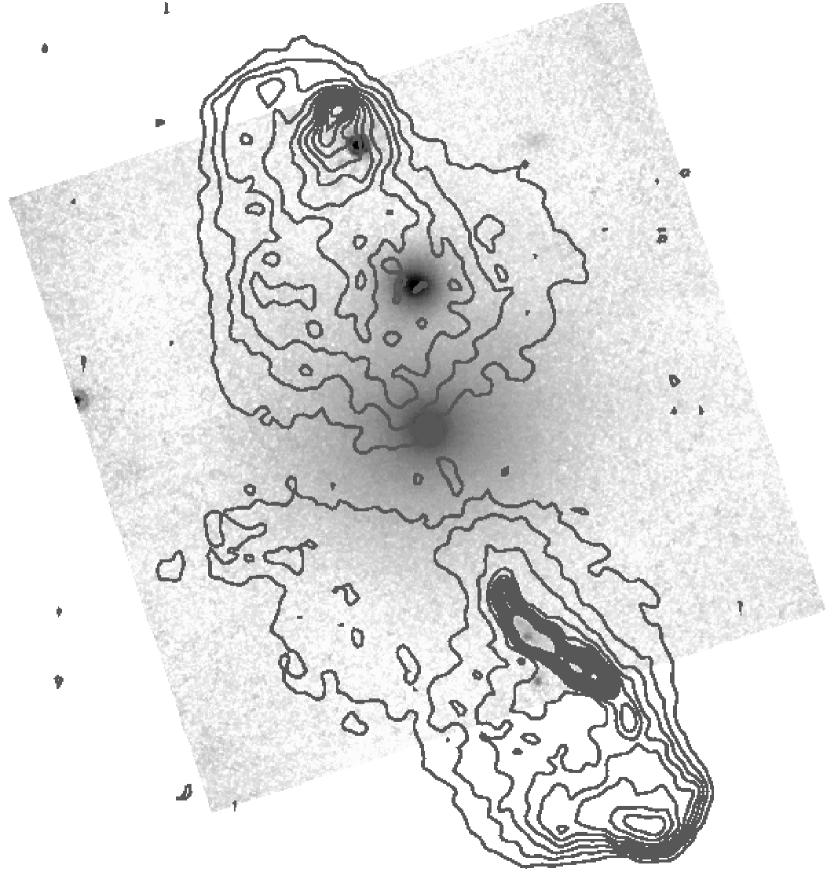
The most intriguing feature in the image is the IR counterpart of the radio jet, located about 6 arcsec south-west of the nucleus, at a position angle of . In Fig. 2 we show the overlay of the radio contours at 1.5 GHz onto our HST/NICMOS image. Radio data are from VLA/MERLIN observations (Treichel et al., 2001), and have an angular resolution of 0.35 arcsec (circular beam). We have used the position of the radio core as reference to align the world coordinate system of the HST image to the radio data frame.
The brightest region of the radio jet, which appears to be located where the jet bends, and its infrared counterpart clearly overlap. However, it appears that the IR jet is detected over a significantly smaller area than the radio jet. In the following section we describe the IR jet morphology and we outline our method for aperture photometry of the components.
3. The infrared jet in 3C 401: morphology and photometry
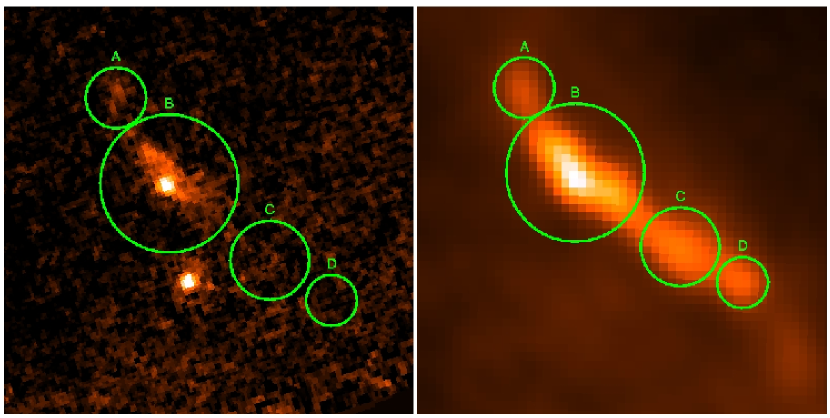
In Fig. 3 we show a detail of the jet as it appears in our IR HST image (left panel) and in the VLA/MERLIN radio image at 1.5GHz (right panel). In the IR, the host galaxy stellar component has been subtracted using a simple model obtained by fitting ellipses to the galaxy surface brightness measured at different radii.
At least four emission regions, or “knots”, can be identified in the radio jet: component “B” is the brightest and appears to be the largest at both frequencies. Knots “A” and “B” are also detected in the IR image.
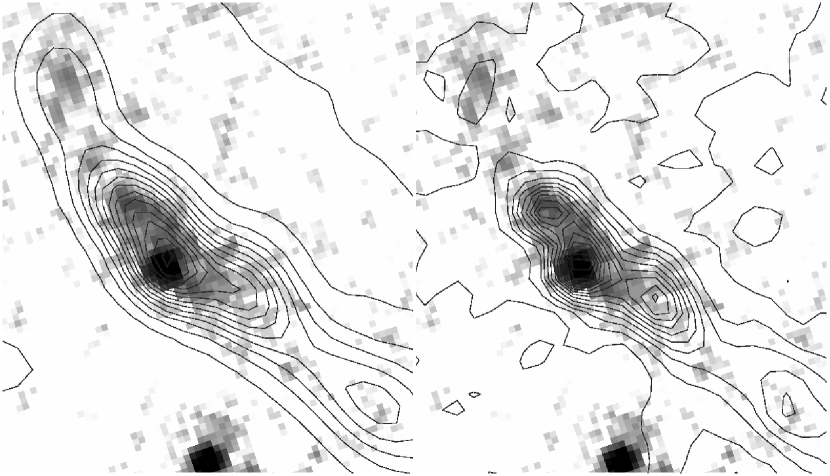
Note that component “B” shows a bright point-like knot in the infrared that has no radio counterpart at 1.5GHz. However the peaks of emission in the infrared and in the radio match quite well at 8.4 GHz (the data are described in Section 4.1, see Fig. 4). Furthermore, in the radio maps at both 8.4 and 1.5GHz, the contours are significantly bent on the southern side of the jet, where the peak of the IR emission is located. Thus we are confident that the IR emission peak is part of the jet itself, and it is not produced by any background (or foreground) source.
We measure the flux of component B from our HST H-band image, by extracting the counts in a box of and we measure the background in different regions around the jet. We have performed aperture correction to estimate the flux that is lost because of the presence of strong PSF wings. We have performed simulations using a synthetic PSF obtained with Tinytim resulting in a correction factor of 1.12 for the extraction area we use to measure the flux of the jet. The flux, converted from counts per second into physical units using the PHOTFLAM keyword in the image header, is erg cm-2 s-1 Å-1 with estimated total error of . We assume , which translates into to correct for Galactic absorption (as taken from NED).
Results of aperture photometry for the jet are summarized in Table 1.
4. Data at other wavelenghts: radio, K-band, optical, X-rays
| [Hz] | [erg cm s-1 Hz-1] |
|---|---|
| Component A | |
| 9.1761 | -24.4560 |
| 14.2730 | -29.1348 |
| Component B | |
| 9.1761 | -23.551 |
| 9.9243 | -24.032 |
| 14.1347 | -27.979 |
| 14.2730 | -28.223 |
| 14.7367 | -28.858 |
| 17.3838 | -32.456 |
| Component C | |
| 9.1761 | -24.0499 |
| 14.2730 | -29.7620 |
In order to derive the SED of the jet we have analyzed unpublished data at different wavelengths, from the radio to the X-ray band. The jet is detected in all of the observations we present here, except for the X-ray band, for which we set an upper limit. In the following, we briefly describe the data at 8.4 GHz (VLA), K-band (GALILEO telescope), optical (HST) and X-rays (Chandra), together with some details on the reduction procedures. For the data at all wavelengths we use the same extraction region as for the HST/NICMOS image.
4.1. Radio observations
As we have already mentioned above, we have obtained from the NED a VLA/MERLIN radio map at 1.5 GHz. We also examined the NRAO archives for high-resolution (arcsec) VLA observations of 3C 401. In practice, this means observations in A configuration at cm. We find one suitable image in the X-band (8.4GHz, Hardcastle et al., 1997). The total on-source integration time is 3580 seconds. We use the standard aips recipe for calibrating continuum emission data, using 3C 286 and 1926611 as our flux and point-source calibrators respectively. The jet morphology at 8.4 GHz appears very similar to that observed in the VLA/MERLIN map at 1.5 GHz.
4.2. TNG K-band observations
A K-band image was obtained at the 3.6m Italian Telescopio Nazionale Galileo, located at La Palma, Canary Islands, Spain, with the ARNICA instrument (Lisi et al., 1993). The observation was part of our survey of the complete sample of 3CR sources with (P.I. Capetti), which is described by Marchesini et al. (in press). The total integration time is 1152s, split into 24 exposures of 48s each to allow for sky subtraction. We reduce the data using the standard technique described in Hunt et al. 1994222Arcetri technical report N. 4, 1994, http://www.arcetri.astro.it/science/irlab
The jet is detected (at ) in the K-band Galileo image. We have extracted the flux from the same region as in the other images, although both the lower resolution and the low detected flux do not allow us to disentangle the different jet components.
4.3. Optical HST images
3C 401 was also observed with HST/WFPC2 in two optical bands, F702W and F555W filters) as part of programs 5476 and 6967 (P.I. Sparks for both programs). The presence of cosmic rays in the region of the jet in the F702W image, for which only one image was taken, prevents us from estimating any reliable upper limit in the R-band. While no detection can be claimed in the F702W image, the bright blob on knot “B” is clearly visible in the data taken with the F555W filter, after smoothing the image with a 1-pixel gaussian.
We thus measure the flux of the jet in the optical WFPC2/F555W image over the same region of the sky as in the IR NICMOS image. We obtain a significant (5) excess with respect to the background level. The total error on the flux is .
4.4. Chandra data
The X-ray data were obtained during two different observations (Obs. Ids. 3083 and 4370, P.I. Reynolds) on September 20th and 21st 2002, and are available on the Chandra public archive.
We reduce the Chandra data using the Chandra data analysis software CIAO v3.0.2, with the CALDB version 2.25. To correct for the QE degradation issue we create a new ARF (effective area files) using the file acisD1999-08-13contamN0003.fits released with the CALDB version 2.26. We reprocess all the data from level 1 to level 2 with standard procedures. No background flares are present during the observing time. Thus, merging the two datasets, we obtain an event file with total exposure time of 47.52 Ks. We extracted the spectrum in the region of the IR jet and we measure the background in a nearby region.
We measure a upper limit to the jet count rate of cts/s. Since the flux is too low to derive any reasonable fit to the spectrum, we use the Redistribution Matrix (RMF) and Auxiliary Response File (ARF) created by CIAO to reproduce with Xspec the observed upper limit net count rate with an absorbed power-law model. The value of is fixed to the galactic absorption ( cm-2) and the power-law index to the value of . Note that a different choice for would not affect significantly the normalization of the power-law. The normalization of the power-law results in photons cm2 s-1 keV-1 at 1 keV, corresponding to nJy (3 upper limit).
5. Spectral energy distribution and emission model
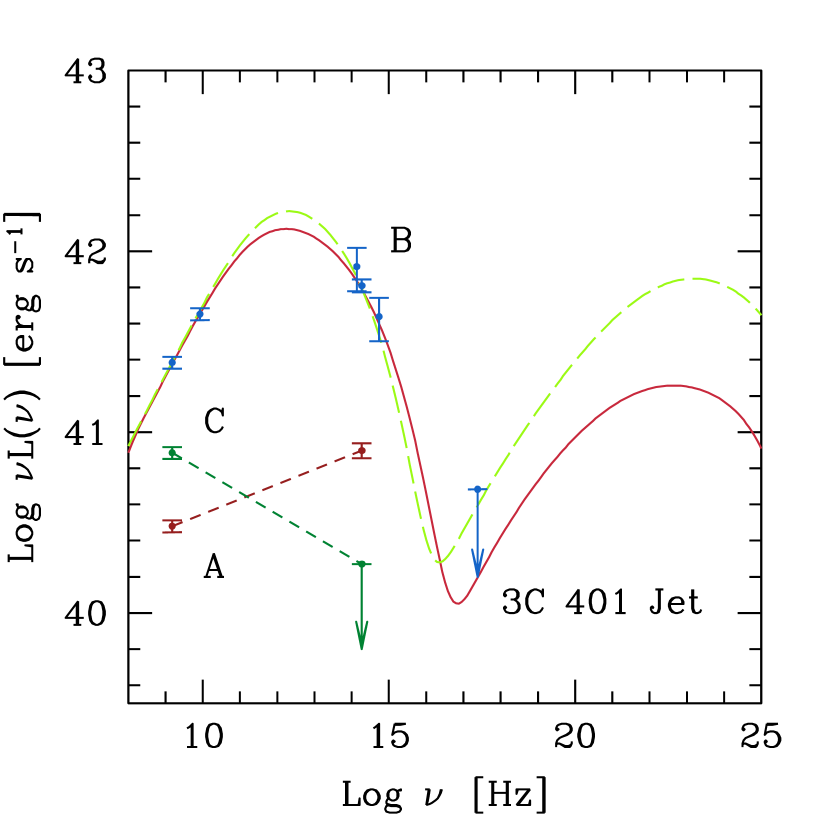
In Fig. 5 we show the spectral energy distribution of component “B” of the jet. Note that although the jet is very faint and only marginally detected in the optical, the optical data-point sets a crucial constraint on the shape of the jet SED. The slope is flat () in the radio, and changes to in the spectral region between the radio and the IR band.
We have also measured the fluxes for components “A” and “C”, in order to investigate any spectral variation along the jet. While “A” is detected both in the radio and at 1.6m, “C” is only visible at radio wavelengths. For the latter component, we have measured a 3 upper limit from our 1.6m HST image. Both A and B have a broad-band spectral index while C is significantly steeper (). For component B, we can also set useful lower limits for and , that we use in the following section to compare the properties of our jet with those of other known X-ray and radio jets.
The continuous and the dashed lines in Fig.5 correspond to two possible one-zone synchrotron self-Compton (SSC) emission models, obtained with different sets of physical parameters, as summarized in Table 2. The volume of the emitting region has been constrained from the observed size of the IR jet (assumed to be cylindrical) and the spectral slope in the radio band constrains the electron injected spectrum. For model 1 (dashed line), the value of the magnetic field is close to equipartition (within a factor ), while for model 2 (solid line) we fixed the beaming factor to unity and the magnetic field is derived from fitting the SED, as for the remaining parameters. In the model computation, the geometry of the source is assumed to be spherical, and electrons are constantly injected to reach equilibrium. Synchrotron and SSC losses are taken into account, while electrons can escape from the source with a typical time-scale given by (see Chiaberge & Ghisellini, 1999). The minimum energy of the injected electron distribution, together with the escape time, are set in order not to overpredict the emission of the lower energy electrons in both the synchrotron and inverse-Compton components (i.e. the flat regions of the SED, in the radio and X-ray).
| Model 1 | Model 2 |
|---|---|
| cm | cm |
| erg s-1 | erg s-1 |
| G | G |
6. Discussion and conclusions
An important point in understanding the nature of the jet emission is to address the following question: what is the reason for the observed brightening of the jet at a projected distance from the nucleus of kpc? The jet in 3C 401 appears to be brighter in the region in which bending occurs. This can be explained by relativistic beaming, or by the presence of shocks which accelerate the electrons along the jet, or by a combination of the two. While in FR I jets the jet flow most likely slows down to sub-sonic and sub-relativistic velocities on scales smaller than kpc, there are clues that in FR II the jets are still relativistic all the way to the hot-spots. Radio observations give us a clue that relativistic bulk motion plays a role in the jet of 3C 401. In fact, Hardcastle et al. (1998) have measured that in a region close to the radio core, but still on the scale of kpc, the jet-to-counterjet ratio is . Although this limit does not allow us to set any firm constraint to either the viewing angle to the jet or to the bulk Lorentz factor of the ejected material, it is an indication that the jet is relativistic at least on those scales. Furthermore, it is widely believed that the presence of hot-spots in the lobes of the radio emission is a signature that the jets in FR II are still supersonic in the region where they impact the ambient medium, and possibly also relativistic (Georganopoulos & Kazanas, 2003). Therefore, we believe that the most likely interpretation is that the enhancement of the flux is partly or entirely due to relativistic beaming. However, with the present observations we cannot totally rule out that part of the jet enhancement occurs because of the presence of shocks in the jet. If this is the case, we expect to observe a progressive steepening of the IR-to-UV spectral slope along the jet as a result of electron aging.
We can estimate the amount of beaming involved, by comparing the flux of the jet in the detected and undetected region. From the IR image we derive that the jet is enhanced by a factor of , as estimated from the ratio between the flux of blob “B” and the upper limit derived on a region where the jet is undetected. Assuming as obtained from model 2, we obtain that ( refers to the region where the jet is undetected), thus . For this implies a change in the viewing angle of (from to ). Note that under the above assumptions, the Lorentz factor cannot be lower than 2, since for , . Higher values of imply an even smaller change in the direction of the jet (e.g. from to , for ) but there is no strong evidence for such a fast relativistic motion from the observations. A similar argument holds for model 1, in which we have .
The presence of relativistic motion on large scales FR II jets is indeed not surprising. However, the evidence for that is mainly indirect. One of the most convincing arguments is derived from the high Lorentz factors needed to enhance the cosmic microwave background radiation field which is up-scattered by the relativistic particles in the jet to produce the observed X–ray flux (Tavecchio et al., 2000; Celotti, Ghisellini, & Chiaberge, 2001). But contrary to most (if not all) other “optically-bright” jets, in the case of 3C 401 we do not detect any X-rays emission. The reason for the lack of significant high-energy flux might be i) “intrinsic” or ii) “extrinsic”.
i) The particle density in the comoving frame is in fact quite low. From the model fitting, we derive a value for the so-called “compactness parameter” and (e.g. Guilbert, Fabian, Rees 1983), which is a measure of the “density” of the source ( is the injected luminosity in particles, in the Thomson cross section, is the size of the source, is the electron mass). Thus the synchrotron emission peak dominates with respect to the high energy (SSC) peak. In this framework, the source is thus dominated by synchrotron emission, while the SSC radiation is intrinsically low.
ii) When compared to the magnetic energy density, the external photon field is low as well. In fact, we find that, for , (model 1) and (model 2), where is the energy density of the cosmic microwave background calculated in the rest frame of the jet, assuming and a viewing angle of (Harris & Krawczynski, 2002). Thus, synchrotron radiation is again the dominant radiation mechanism.
As pointed out by Celotti, Ghisellini, & Chiaberge (2001), a third source of photons for IC scattering may reside in the “beam” from the central quasar hosted by the nucleus of the galaxy. If the jet axis forms a large angle with the line-of-sight, the central quasar photons, that are preferentially emitted in the direction of the jet axis, can be up-scattered by relativistic electrons in the jet. Then, if the jet has a slower shear layer on the kpc scales, (as it has been suggested in order to explain the limb-brightnened appearence of the jet in e.g. the FR II radio galaxy 3C 353 Swain et al., 1998), the IC radiation is not heavily beamed away from the observer, and it can be detected. However, 3C 401 does not appear to harbor any powerful quasar. This can be inferred both from its optical spectral characteristics and from the nuclear SED: 3C 401 is a narrow-lined Low Excitation Galaxy (LEG), which does not appear to require a high ionizing nuclear flux, as it is for objects with high excitation emission lines (QSO and narrow-lined High Excitation galaxies, HEG). Furthermore, the object does not show any strong central thermal emission of associated with the active nucleus both in the optical (Chiaberge, Capetti, & Celotti, 2002) and in the IR. This is clearly seen in our HST images in which only a faint central nuclear component is observed (the nuclear properties of the complete sample will be discussed in a forthcoming paper, Chiaberge et al., in preparation).
A further characteristic of the jet SED is worth discussing. In order not to produce significant X-ray flux, the electron distribution must have a cut-off at energies confined between the optical and the X-ray band. As derived from the SED modeling, for a magnetic field of G, the cut-off energy should be located at a Lorentz factor of a few . Typical maximum electron energies in synchrotron-dominated FR I jets are significantly higher (up to a few ), while Sambruna et al. (2004) have shown that jets in powerful FR II/quasars have .
Thus, on the one hand, our 3C 401 jet shows properties that are intermediate between the two classes of synchrotron dominated, low power FR I jets and IC-dominated, high power FR II/QSO: its bulk velocity on the kpc-scale and its electron distribution are typical of high power jets, while the dominance of synchrotron radiation in the overall SED is typical of low power jets. On the other hand, the broad band spectral indices and of knot “B”’ are atypical (see Fig. 4 in Sambruna et al. (2004)) as it would lie in an empty region of the plane.
An intriguing consequence is that there may be a continuous “sequence” in extended X-ray jets, somehow similar to that observed in jets on a much smaller scale in the case of blazars (Fossati et al., 1998; Ghisellini et al., 1998). In this framework, our jet would represent the prototype of the new “intermediate class”, and their study may shed light on the physical differences between the various jets. From the point of view of the observations, the most important property of such intermediate jets is that their SED peaks in the infrared region.
However, we must stress that the jet should be studied in much more detail before drawing conclusions. A crucial point is to produce a spatially resolved spectral energy distribution of knot “B”, in order to disentangle the bright “spot” seen in the IR (and possibly at 8.4 GHz) from the rest of the jet. If that “spot” is a region of the jet where electrons are being accelerated, for example where the jet impacts the ISM/IGM, then its SED might be substantially different from the rest of the jet, thus affecting our conclusions based on the “spatially integrated” SED shown in this paper. In particular, the region to be explored is from the IR K-band to the near UV, through deep high-resolution observations that only the HST can provide. Another important issue to be investigated through deeper high resolution images is the change in the spectral slope between the different components of the jet. This may shed light on the possible role of shocks in observed jet brightening and change of direction.
References
- Celotti, Ghisellini, & Chiaberge (2001) Celotti, A., Ghisellini, G., & Chiaberge, M. 2001, MNRAS, 321, L1
- Chartas et al. (2000) Chartas, G., et al. 2000, ApJ, 542, 655
- Chiaberge & Ghisellini (1999) Chiaberge, M. & Ghisellini, G. 1999, MNRAS, 306, 551
- Chiaberge, Capetti, & Celotti (2002) Chiaberge, M., Capetti, A., & Celotti, A. 2002, A&A, 394, 791
- de Koff et al. (1996) de Koff, S., Baum, S. A., Sparks, W. B., Biretta, J., Golombek, D., Macchetto, F., McCarthy, P., & Miley, G. K. 1996, ApJS, 107, 621
- Fanaroff & Riley (1974) Fanaroff, B. L., & Riley, J. M. 1974, MNRAS, 167, 31P
- Fossati et al. (1998) Fossati, G., Maraschi, L., Celotti, A., Comastri, A., & Ghisellini, G. 1998, MNRAS, 299, 433
- Fruchter & Hook (2002) Fruchter, A. S. & Hook, R. N. 2002, PASP, 114, 144
- Georganopoulos & Kazanas (2003) Georganopoulos, M., & Kazanas, D. 2003, ApJ, 589, L5
- Giovannini et al. (1994) Giovannini, G., Feretti, L., Venturi, T., et al. 1994, ApJ, 435, 116
- Garrington et al. (1988) Garrington, S. T., Leahy, J. P., Conway, R. G., & Laing, R. A. 1988, Nature, 331, 147
- Ghisellini et al. (1998) Ghisellini, G., Celotti, A., Fossati, G., Maraschi, L., & Comastri, A. 1998, MNRAS, 301, 451
- Hardcastle et al. (1998) Hardcastle, M. J., Alexander, P., Pooley, G. G., & Riley, J. M. 1998, MNRAS, 296, 445
- Hardcastle et al. (1997) Hardcastle, M. J., Alexander, P., Pooley, G. G., & Riley, J. M. 1997, MNRAS, 288, 859
- Harris & Krawczynski (2002) Harris, D. E. & Krawczynski, H. 2002, ApJ, 565, 244
- Laing (1988) Laing, R. A. 1988, Nature, 331, 149
- Lisi et al. (1993) Lisi, F., Baffa, C., & Hunt, L. K. 1993, Proc. SPIE, 1946, 594
- Rees (1966) Rees, M. J. 1966, Nature, 211, 468
- Sambruna et al. (2004) Sambruna, R. M., Gambill, J. K., Maraschi, L., Tavecchio, F., Cerutti, R., Cheung, C. C., Urry, C. M., & Chartas, G. 2004, ApJ, 608, 698
- Swain et al. (1998) Swain, M. R., Bridle, A. H., & Baum, S. A. 1998, ApJ, 507, L29
- Tavecchio et al. (2000) Tavecchio, F., Maraschi, L., Sambruna, R. M., & Urry, C. M. 2000, ApJ, 544, L23
- Treichel et al. (2001) Treichel, K., Rudnick, L., Hardcastle, M. J., & Leahy, J. P. 2001, ApJ, 561, 691
- Whitney et al. (1971) Whitney, A. R., et al. 1971, Science, 173, 225
- Worrall et al. (2001) Worrall, D. M., Birkinshaw, M., & Hardcastle, M. J. 2001, MNRAS, 326, L7