Kinematic Structure of H2 and [Fe ii] in the Bipolar Planetary Nebula M 2-9
Abstract
We present new high-dispersion long-slit infrared (IR) spectra of the double-shell bipolar planetary nebula M 2-9 in the emission lines [Fe ii] 16435 and H2 =1–0 S(1) 21218. H2 spectra reveal for the first time the kinematic structure of the outer shell in M 2-9. Kinematics of the inner shell, traced by [Fe ii], resemble those of optical forbidden-lines like [N ii] 6583, although we note subtle differences. [Fe ii] and H2 shells have expansion speeds roughly proportional to distance from the star (“Hubble” flows) and share the same dynamical age of 1200–2000 yr, depending on the distance to M 2-9. Thus, the inner ionized lobes and outer molecular lobes, as well as the molecular torus and “outer loops” measured by other observers, were all formed around the same time. Consequently, their nested structure likely arises from an excitation gradient rather than independent ejections. H2 and [Fe ii] emission is distributed more uniformly than [N ii], and IR lines are not dominated by the moving ionization pattern like visual-wavelength lines. We suggest that this is because IR lines of [Fe ii] and H2 are excited by relatively isotropic far-UV radiation (Balmer continuum), whereas optical lines respond to a directed rotating beam of Lyman continuum. Finally, we highlight intriguing similarities between M 2-9 and the Homunculus of Car, despite the different central engines powering the two nebulae.
1 INTRODUCTION
Among the many known examples of bipolar planetary nebulae (PNe; Balick & Frank 2002), the “Butterfly” nebula M 2-9 (Minkowski 1947) is particularly striking. Its smooth, almost cylindrical bipolar lobes meet in a very tightly-pinched waist at the location of the bright central star. The remarkable optical morphology of M 2-9 has been discussed by numerous authors (e.g., Allen & Swings 1972; Kohoutek & Surdej 1980; Goodrich 1991; Schwarz et al. 1997; Balick 1999; Doyle et al. 2000).
M 2-9 may be a symbiotic PNe (Balick 1989) – a member of a class of tight-waisted bipolar nebulae with bright symbiotic stars or candidate symbiotic stars as their central engines; other examples are Mz 3, He 2-104, and Hubble 12 (e.g., Corradi et al. 2000; Schwarz et al. 1989; Whitelock 1987). M 2-9 and Mz 3 are near spectroscopic twins at visual and infrared (IR) wavelengths (Swings & Andrillat 1979; Hora & Latter 1994; Smith 2003), except that Mz 3 shows no IR emission lines of molecular hydrogen (Smith 2003). M 2-9 is noteworthy in that its bipolar lobes have almost perfectly smooth and thin boundaries in Hubble Space Telescope (HST) images (Balick 1999), whereas Mz 3 shows complex structure due to gas dynamic instabilities often seen in PNe (Santander-Garcia et al. 2004; Guerero et al. 2004).
Even among this special class of PNe, M 2-9 is unique in exhibiting rapid changes in the ionization structure of its bipolar lobes. The lobes are illuminated by a moving searchlight beam thought to be caused by an asymmetrc rotating excitation source (either a collimated jet or focused UV illumination) from a central binary star system. This changes the emission-line appearance of the nebula over timescales of years to decades (Doyle et al. 2000; Balick 1999; Goodrich 1991; Kohoutek & Surdej 1980; Allen & Swings 1972). The nebula has several components: a bright nucleus containing the putative symbiotic binary system (Lim & Kwok 2000; Balick 1989, 1999), limb-brightened cylindrical bipolar lobes within 25″ of the nucleus where the unusual variability is seen, and fainter polar loops extending 60″ from the core (Solf 2000; Schwarz et al. 1997). Bright condensations called “ansae” (Frank et al. 1996; Garcia-Segura 1997) are seen inside the polar lobes as well, perhaps caused by shocks where fast jets strike the interiors of the polar lobes (Balick 1999; Solf 2000). The bright bipolar lobes are dusty, giving rise to extended thermal-IR emission (Smith & Gehrz 2005) and polarization in scattered light (King et al. 1981; Trammell et al. 1995).
Here we investigate kinematics of the brightest parts of the bipolar lobes using IR spectroscopy. Hora & Latter (1994; HL94 hereafter) noted a striking double-shell structure in M 2-9, with the smaller pair of bipolar lobes emitting bright [Fe ii] emission nested inside an outer pair of lobes comprising a thin skin of H2 emission (see also Kastner et al. 1996). Aside from faint [O i] emission, the outer lobes are seen only in scattered light at visual wavelengths (Balick 1999). This structure, with [Fe ii] bulbs inside a thin H2 skin, is similar to the double-shell structure in the nebula surrounding Carinae (Smith 2002). [Fe ii] bulbs inside a larger H2 nebula are also seen in other PNe, such as Hubble 12 (Welch et al. 1999; Hora & Latter 1996) and NGC 7027 (Latter et al. 2000). In HST images, the outer and inner shells of M 2-9 distinguish themselves in low- and high-excitation emission lines like [O i] and [O iii], respectively (Balick 1999). Given their segregated geometry in images, we wish to determine if the inner and outer lobes of M 2-9 have similar kinematics; i.e. did they arise from separate and distinct ejections, or were they formed in just a single event, so that their stratified structure arises instead from density gradients and radiative transfer effects like in the case of Car?111The case of Car is even more complex, however. Note that here we are referring to the inner walls of the main Homunculus nebula seen in [Fe ii] emission, which have the same age as the outer H2 skin (Smith 2002). We are not referring to [Fe ii] emission from the “Little Homunculus”, which was ejected in a separate event 50 years later (Smith 2005). In lieu of independent age determinations from proper motion measurements of each shell component in M 2-9, we investigate the kinematics of these two shells using Doppler shifts in high-dispersion spectra of [Fe ii] 16435 tracing the inner shell, and H2 21218 tracing the outer shell.
2 OBSERVATIONS
2.1 IR Images
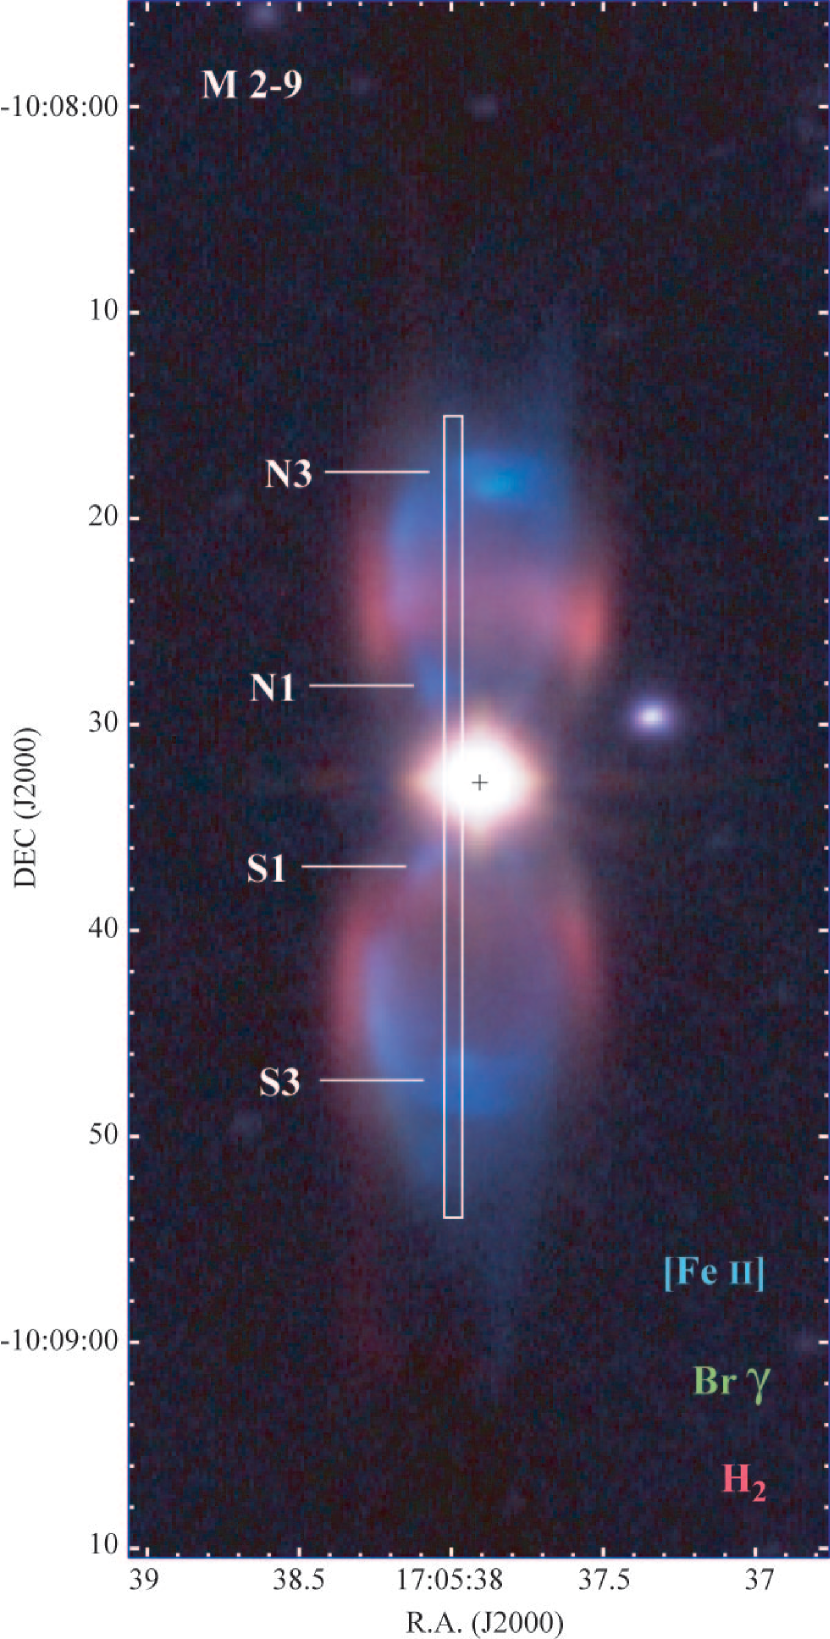
Figure 1 shows a three-color composite image of M 2-9, included here to illustrate the position of the spectroscopic aperture relative to the H2 and [Fe ii] emission. H2 21218 emission is red, Br and continuum is green, and [Fe ii] 16435 is blue. Extended green emission is very faint in Figure 1 because Br emission seen there is mainly reflected light (e.g., Trammell et al. 1995), whereas strong intrinsic [Fe ii] and H2 lines are emitted by the lobes. These images were taken on the University of Hawaii 2.2 m telescope on 1997 April 25 using the QUIRC instrument (Hodapp et al. 1996),222See also http://www.ifa.hawaii.edu/instrumentation/quirc/quirc.html. and the data reduction was similar to that described by HL94.
2.2 IR Spectroscopy
On 2004 Aug 20 we observed M 2-9 with the high-resolution spectrograph CSHELL (Greene et al. 1993) mounted on NASA’s Infrared Telescope Facility (IRTF). CSHELL has a 256256 SBRC InSb array with a spatial pixel scale of 02. Only 160 pixels are illuminated in the spatial direction, yielding an effective slit length of roughly 30″. We used a slit width of 05, providing a spectral resolving power of 43,000 or 7 km s-1. The circular variable filter (CVF) wheel isolates a single order of the echellette, and we chose central wavelengths corresponding to the bright [Fe ii] 16435 emission line (vacuum wavelength 16439.98 Å) and the S(1) line of molecular hydrogen at 21218.36 Å (vacuum).
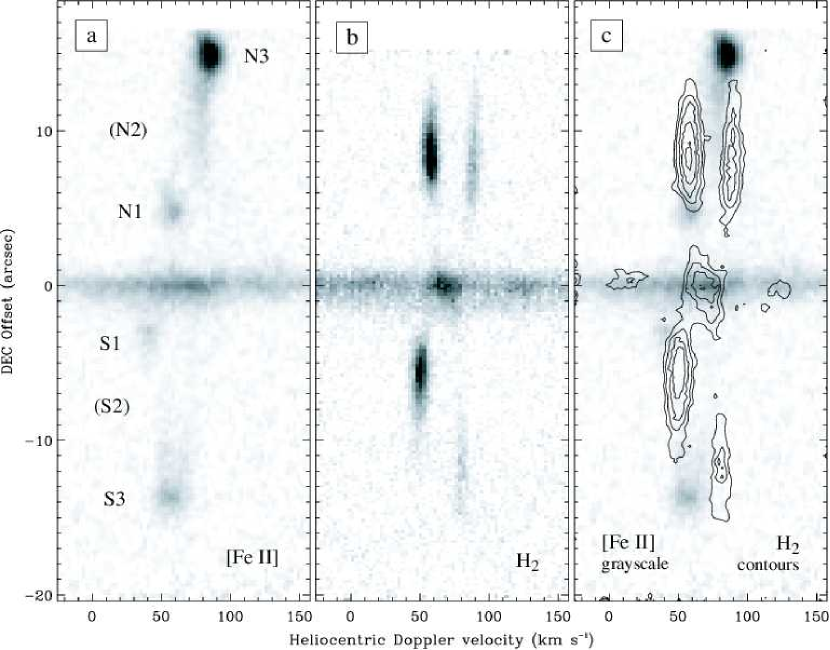
We oriented the slit at P.A.=0° and positioned it roughly 05 east the central star (see Fig. 1) in order to move the peak emission from the central star out of the slit so that we could take longer exposures of the faint nebula. We used total on-source integration times of 40 and 35 minutes for [Fe ii] and H2, respectively, and sky-subtraction was accomplished with identical observations of an off-source position. The resulting 2-D spectra are shown in Figure 2. Wavelengths were calibrated using telluric absorption lines, adopting wavelengths in the telluric spectrum available from NOAO. We also used OH airglow lines for wavelength calibration in the 2 region (wavelengths kindly provided by R. Joyce; private comm.). Uncertainty in the absolute wavelength calibration is roughly 1 km s-1. Velocities in Figure 2 are heliocentric, and have been corrected for the Earth’s motion (to convert to LSR velocities, add 14.7 km s-1). We did not attempt to flux calibrate the spectra due to intermittent clouds on the night the data were taken.
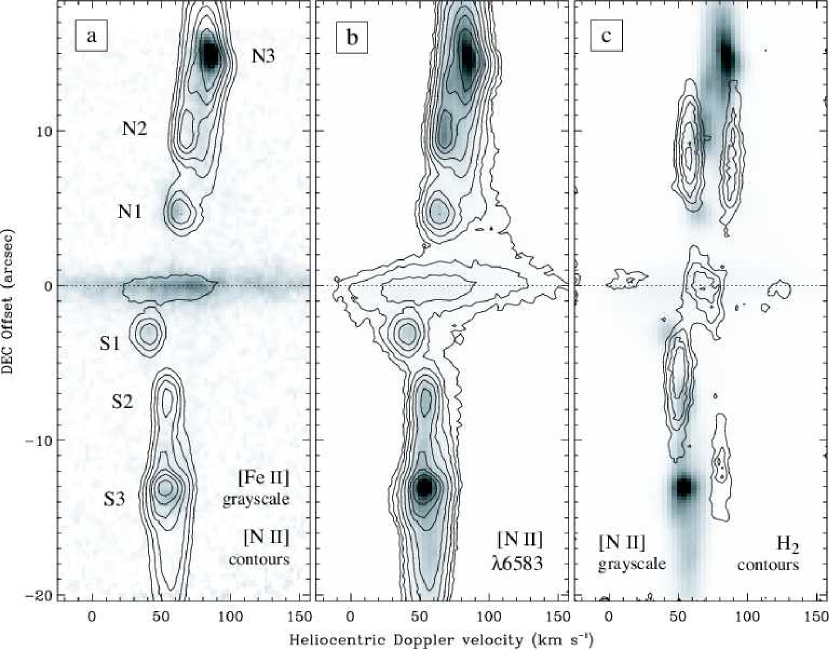
In Figure 3 we compare our new CSHELL spectra of [Fe ii] and H2 with similar long-slit spectra of [N ii] 6583, obtained in November 1998 and described already by Balick (1999). These observations were obtained at roughly the same slit position as is shown in Figure 1.
3 RESULTS
3.1 Kinematic Structure of H2 and [Fe ii]
One of the most striking properties of M 2-9 in images (Figure 1) is the double-shell structure, with an inner shell of [Fe ii] and an outer shell of H2. This structure is evident in kinematics seen in long-slit spectra in Figure 2 as well. Qualitatively, the similar morphology seen in images and in long-slit spectra suggests that the nebular expansion is homologous.333Our slit is not exactly along the polar axis, but it is close enough that this holds true within the resolution of our data. This is especially true for the outer shell of H2 emission. Overall, the [Fe ii] is confined within the H2 walls in long-slit spectra and appears to follow the same trend of increasing expansion velocity with distance from the star, so that both H2 and [Fe ii] follow the same basic “Hubble” flow. The similarity between morphology in H2 images and kinematic structure in spectra implies that second-order effects like non-radial motion at shock interfaces do not dominate the overall shaping of the outer nebula. Homologous expansion like this would usually indicate that all the material comprising the H2 shell was ejected at roughly the same time (see §3.5). [Fe ii] emission shows the apparent Doppler shift increasing with separation from the star; it does not resemble the body of a steady jet, where we would expect to see constant or even decreasing Doppler shifts at increasing distance from the star.
While the kinematic structure of H2 emission suggests homologous expansion, its brightness distribution is not perfectly symmetric. The near sides of the N and S polar lobes are 3.3 and 3.0 times brighter than their respective far sides (see Fig. 4). While this would normally be attributed to extinction of the far side of the nebula by dust, we cannot justify this assumption in the case of M 2-9 because the optical emission is known to vary with time due to a rotating illumination source, so the intrinsic brightness of the front and back sides may be very different. This is discussed further in §4.2. Also, there are some spatial asymmetries in the H2 brightness; for example, in the S polar lobe, the brightest H2 emission on the far side is much farther from the star than on the near side.
3.2 Comparison with [N ii] Kinematics and the Emission Knots
Since [Fe ii] emission comes from the same inner lobes seen in HST images of optical lines like [N ii], it is instructive to compare their kinematics. Figure 3 shows similar long-slit spectra for [N ii] 6583 at the same spatial offset from the star (Fig. 3; see also Icke et al. 1989), as well as [N ii] contours superposed on [Fe ii] (Fig. 3) and H 2 contours over [N ii] emission (Fig. 3).
In general, we see that [Fe ii] and [N ii] occupy the same kinematic space inside of and sheathed by the H2 emission. However, Figure 3 shows a subtle but important difference: the knots N2 and S2 are not seen in [Fe ii]. Knots N2 and S2 are the most prominent signposts of the moving excitation beams that make M 2-9 so unique. Their absence in [Fe ii] implies that this IR line is not influenced as strongly by the asymmetric rotating excitation source. While there are some concerns due to temporal effects444The [Fe ii] observation was obtained about six years after the [N ii] observation, and the N2 knots have moved somewhat during this time. However, based on their previous rate of motion, we would still expect these features to be easily included within the CSHELL aperture. Obviously, however, new high-resolution imags of [Fe ii] and continued monitoring of the optical lines would be useful to justify these comments., the N2 and S2 knots are missing in [Fe ii] images (Fig. 1), while they dominate the appearance of [N ii] images. Their absence in [Fe ii] may help unravel the nature of the excitation source, as discussed in §4.
Knots N1 and S1 are faintly visible in [Fe ii] emission in Figure 2. Both features are blueshifted and have no observable redshifted counterparts, indicating that the N1 and S1 knots are located only on the near side of the nebula. Interestingly, Figures 2 and 3 show that the N1 and S1 knots in [Fe ii] and [N ii] appear at the same velocity as H2 and mark the spatial position where the brightest H2 emission abruptly ends on the near side of the polar lobes. Do the N1 and S1 knots mark a position in the outer lobes where the H2 is dissociated and the gas is partially ionized? HST images certainly do not give the impression that the N1 and S1 knots are part of the outer shell (Balick 1999), so this is an interesting mystery. In any case, N1 and S1 are probably not isolated knots, but rather the illuminated part of a ring or inner edge of a cylinder.
While [Fe ii] and [N ii] emission from S1 line up perfectly in Figure 3, the two emission lines from N1 show a peculiar velocity difference of almost 10 km s-1. On the other hand, [Fe ii] emission from N3 overlaps perfectly with [N ii], while S3 shows a spatial difference of almost 1″ and a velocity difference of a few km s-1 compared to [N ii]. S3 is also relatively much fainter than N3 in [Fe ii]. These peculiar differences may be an effect of subtle changes in slit position or temporal effects (N1 and S1 also exhibit the consequences of the rotating excitation source), but further study is needed.
3.3 Emission from the Nucleus
Figures 2 and 4 reveal H2 21218 emission in the nucleus of M 2-9, in the immediate vicinity of the central star (within 1000 AU). HL94 did not detect any H2 emission from the central star in lower resolution spectra — our detection of H2 in this study is probably because the CSHELL slit aperture was offset 05 east of the star, excluding much of the central star’s bright continuum emission, and including more extended emission. Its detection in an offset position suggests that the H2 emission arises from a region within at least 1″ of the star perpendicular to the polar axis.
The contours in Figure 2 show that the nuclear H2 emission is also extended about 05 along the slit, showing a “tilt” in its kinematic structure, with blueshifted emission toward the north and redshifted emission toward the south. This indicates that the H2 emission arises in an equatorial molecular disk or torus, rather than in polar material (polar material is redshifted toward the north). This is consistent with the detection of a CO torus within 3″ of the star by Zweigle et al. (1997). The H2 emission arises closer to the central star, perhaps marking the irradiated inner edge of this larger torus.
The extracted spectrum in Figure 4 (which includes all emission within 15) reveals a narrow but resolved H2 emission line near the systemic velocity of M 2-9, with a FWHM of 25 km s-1. The width of this line is consistent with the conjecture that it is associated with the same molecular torus observed by Zweigle et al. (1997). This core region also shows strong [Fe ii] emission line that is broader and more asymmetric than the H2 emission line. The asymmetric profile of [Fe ii] is similar to that of [N ii] 6583 in the central star (Solf 2000). The core [Fe ii] emission is not spatially resolved in our data.
We see two high-velocity components of H2 emission, about 5 times fainter than the centroid component, at roughly 55 km s-1 with respect to the systemic velocity. Like the centroid component of H2, these two high velocity components are also spatially resolved (see the contours in Figs. 2 and 4), and follow the same kinematic trend as the tilt of the centroid component, indicating that they are equatorial. The faint blueshifted peak at +10.9 km s-1 (heliocentric) is offset 04 north, and the redshifted component at +123.7 km s-1 is offset 03 south. Solf (2000) detected analogous high velocity components in optical emission lines that were spatially extended by an amount similar to the fast components of H2 that we observe. However, the spatially-resolved kinematic structure of those atomic lines showed the opposite kinematic trend – i.e. they were redshifted to the north and blueshifted to the south, consistent with a fast polar outflow instead of an equatorial outflow. Solf (2000) proposed that the high-velocity components in atomic lines reveal a bipolar microjet near the star. The faintest broad [N ii] emission within 2″ of the star in Figure 3 (blueshifted to the south and redshifted to the north) extrapolates back to the position of the star at roughly the same velocity as the fast H2 emission at 55 km s-1. Balick (1999) pointed out that if this material arises in a bipolar jet near the star, then the jet decelerates rapidly even though no strong radiative shock emission is seen. One alternative interpretation is that the [N ii] emission originates in fast material in the walls of the polar lobes, and the H2 emission arises in a disk or ring where the [N ii] emission meets the equator; in that case, the rapid deceleration seen in [N ii] is an effect of the orientation angle rather than deceleration along the same path. The difference in H2 velocities between the slow and fast component at the same position is puzzling, since the implied shock velocity is strong enough to dissociate H2. Then again, the high velocity H2 emission we observe may be something more complicated like the equatorial H2 emission in the Egg nebula (Cox et al. 2000; Sahai et al. 1998; HL94). In any case, one might infer that future observations of H2 and atomic lines with high spatial resolution techniques would have the potential to reveal the wind collimation mechanism near the central star.
3.4 The Systemic Velocity of M 2-9
We find three independent potential indicators of M 2-9’s systemic radial velocity. These are: 1) the average of the velocities for [Fe ii] emission in the N3 and S3 knots at the ends of the polar lobes, 2) the average of the centers of expansion (i.e. halfway between the blue and redshifted surfaces) for the two polar lobes seen in narrow H2 emission at similar spatial offsets from the equator, and 3) the centroid velocity of the H2 emission from the central star, presumably from a circumstellar molecular disk in the core. Of these three, the second is arguably the most reliable (as is the case for Car; Smith 2004), given the narrow emission components and the apparent symmetry of the nebula in H2 images (HL94). The relevant velocity measurements are collected in Table 1, where the three methods just mentioned are shown in bold font. In Table 1, each measurement is the average of a Gaussian fit and a flux-weighted centroid; the difference between these two measurement methods was always less than 0.5 km s-1, which is less than the uncertainty in the wavelength calibration of 1 km s-1.
Taking the average of the three bold estimates in Table 1 gives Vsys=+69.2 km s-1 for the heliocentric systemic velocity of M 2-9. Measured with respect to the local standard of rest, the systemic velocity would be VLSR=+83.9 km s-1. This agrees with measurements of the molecular torus around M 2-9, which imply a systemic velocity at LSR values of +80 to +81 km s-1 (Bachiller et al. 1990; Zweigle et al. 1997).
3.5 The Dynamical Age of M 2-9
Figure 2 gives the first reliable information about the kinematics of the outer molecular shell in the bipolar lobes of M 2-9; comparing its expansion speed to its current size gives valuable clues to the age of this component of the nebula. Because of the degeneracy between the uncertain distance to M 2-9 and the lack of proper motion measurements for the outer shell, we cannot give an accurate value for the absolute age of the outer shell from our data. However, we can constrain the relative dynamical age of the molecular shell compared to the ionized gas in the inner lobes of M 2-9 for an assumed distance. Given the double-shell structure of M 2-9 (H2 vs. [Fe ii]), it would be very interesting to know if both components were ejected at the same time (as is the case for Car; Smith 2002), or if the ionized gas is expanding into and interacting hydrodynamically with an older and cooler molecular shell. Solf (2000) proposed that the cool outer shell is three times older than the hot inner shell, but that conjecture was based on velocities in stellar-wind lines reflected by dust in the cool shell, rather than a direct measure of the expansion of the cool shell itself.
The lateral expansion speed in the middle of the polar lobes (difference between the blue and redshifted H2 components in Table 1 and Fig. 4) is roughly 30 km s-1 when corrected for the 73° inclination angle of the nebula (e.g., Zweigle et al. 1997). In images (see Fig. 1 and HL94), the lateral size of the outer H2 shell (in the E/W direction) is 105 for the N lobe and 115 for the S lobe. We presume that the outer shell is expanding homologously and with approximate axial symmetry. Thus, the average dynamical age of the H2 shell would be 1750Dkpc yr (with an uncertainty of less than 10% beyond the uncertainty of the assumed distance). Thus, if D=650 pc (Schwarz et al. 1997), then the age of the outer H2 lobes is roughly 1140 yr.
Using optical forbidden lines, Solf (2000) found a dynamical age of 1300 yr for the ionized inner shell adopting the same distance of 650 pc to M 2-9. This is comparable to the dynamical age of 1365 yr derived by Zweigle et al. (1997) for the molecular torus (Zweigle et al. actually published an age of 2100 yr, but that was at a distance of 1 kpc). Both Schwarz et al. (1997) and Solf (2000) derived an age of 1200-1300 yr for the faint outer loops 1′ from the star along the polar axis.
The uncertainties in these various measurements are large enough to make it likely that all three components of the nebula are coeval, neglecting any potential acceleration or deceleration. Based on the nebula’s present kinematics, our measurements make it seem improbable that the outer molecular shell is significantly older than the inner ionized gas in the polar lobes. If the molecular shell was 3 times older than the inner ionized shell as Solf (2000) suggested, then the observed velocities of the [Fe ii] emission in Figure 2 would not be confined within the walls of the H2 emission. Caveat: Of course, the dynamical age we measure today is not necessarily a meaningful indicator of the true ejection age. For example, the outer H2 shell may have been ejected earlier than the [Fe ii] bulbs if the [Fe ii] bulbs were ejected more recently with higher speed, but have been decelerated upon interaction with the more massive H2 shell.
However, there is one nagging departure from this single-ejection hypothesis. The N3 and S3 knots seen in [Fe ii] appear to be slightly faster than other material in the inner ionized shell, suggesting one of two possible scenarios. Either they are younger than the other material emitting [Fe ii] because they have higher speeds at the same distance from the star, or their trajectories are tilted with respect to the assumed polar axis of 17. We cannot rule out the second possibility, but N3 and S3 appear exactly along a projection of the polar axis in images (Balick 1999; HL94), so the younger age seems to be a more likely hypothesis. The N3 and S3 knots have Doppler shifts of +15.2 and 13.0 km s-1 with respect to the systemic velocity (see Table 1), and they are located at positional offsets of +150 and 139 from the central star, respectively. If the inclination is 73 (Zweigle et al. 1997), the dynamical ages for the N3 and S3 knots are roughly 1500Dkpc yr and 1600Dkpc yr, respectively. At 650 pc, their ages are 975 and 1040 yr – about 15% younger than the rest of the nebula. With trajectories near 73° from the line of sight, their de-projected velocities are of order 50 km s-1, yet N3 and S3 show no detectable proper motions in HST/WFPC2 images (Balick et al. in prep.). This is puzzling, and sugggests that their locations may mark the position of a standing shock.
4 DISCUSSION
4.1 Double Shells: Multiple Ejections or Excitation Structure?
Our measurement that the inner [Fe ii] shell and the outer H2 shell have roughly the same dynamical age argues against the simplest explanation for the observed double-shell structure — i.e., that each shell is the product of a separate ejection event. As noted above, however, there is still room for multiple-ejections or post-ejection shaping if the inner shell has been decelerated or the outer shell accelerated by the interaction of the two shells, so that they mimic a single ejection. In either case, however, the double-shell structure is still likely to be the result of different layers in a photodissociation region through a single thick shell.
Naively, we might expect the stratified double-shell structure seen in M 2-9 from pure photoexcitation by a central source, because Fe+ and H2 should not occupy the same volume. Fe0 is ionized to Fe+ at 3.4 eV higher than the H2 molecule is dissociated. This type of stratified structure might be seen, for example, in the case of a strong source of far-UV photons incident upon a thick, uniform-density shell, resulting in an ionization gradient. In their spectral analysis of multiple near-IR H2 lines, HL94 concluded that the near-IR molecular hydrogen emission in the outer shell of M 2-9 is excited through absorption by the Lyman and Werner bands in the far-UV. Understanding the excitation of the [Fe ii] lines is a more difficult matter, because shock excitation, photoelectric heating through dust grains, or UV pumping can produce a similar near-IR [Fe ii] spectrum. Thus, to determine if shocks excite the bright [Fe ii] emission from the inner shell, more detailed shock models or photoionization calculations are in order. In any case, excitation in the far-UV must play an important role for the [Fe ii] lines, since UV radiation dominates the excitation of H2 at even larger distances from the star.
Even if the double-shell structure really represents two separate and distinct shells inside one another, the existence of nested bipolar lobes would not be unique in PNe. The most relevant comparison, perhaps, is the pair of bipolar nebulae at different radii seen around He 2-104, both having the same dynamical age (Corradi et al. 2001). It is not easy to imagine how nested coeval structures like these are produced, and it is not clear that invoking a close mass-transfer binary system will help (Balick & Frank 2002).
4.2 The Rotating Excitation Source
Figure 1 implies that H2 and [Fe ii] are more uniformly distributed than familiar optical lines like H. This conjecture is supported by our spectra, where we detect emission from the front and back of the nebula in H2, and in [Fe ii] we do not detect the strong front-back asymmetry evidenced by the N2 and S2 knots in [N ii]. While the H2 emission is brighter on the near side than on the back side of the nebula, this could be due in part to dust extinction of the far side. Also, it is clear from images that H2 shows a morphology very different from the highly-directed moving pattern seen in H. In any case, it is fair to say that the IR lines of [Fe ii] and H2 are not influenced by the moving ionization source to the same degree as lines like [O iii], H, and [N ii], where the observed morphology is dominated by this phenomenon. [Fe ii] and H2 (and [O i] at visual wavelengths) emission is more uniform, whereas [O iii], H, and [N ii] are very azimuth-dependent. What causes this difference?
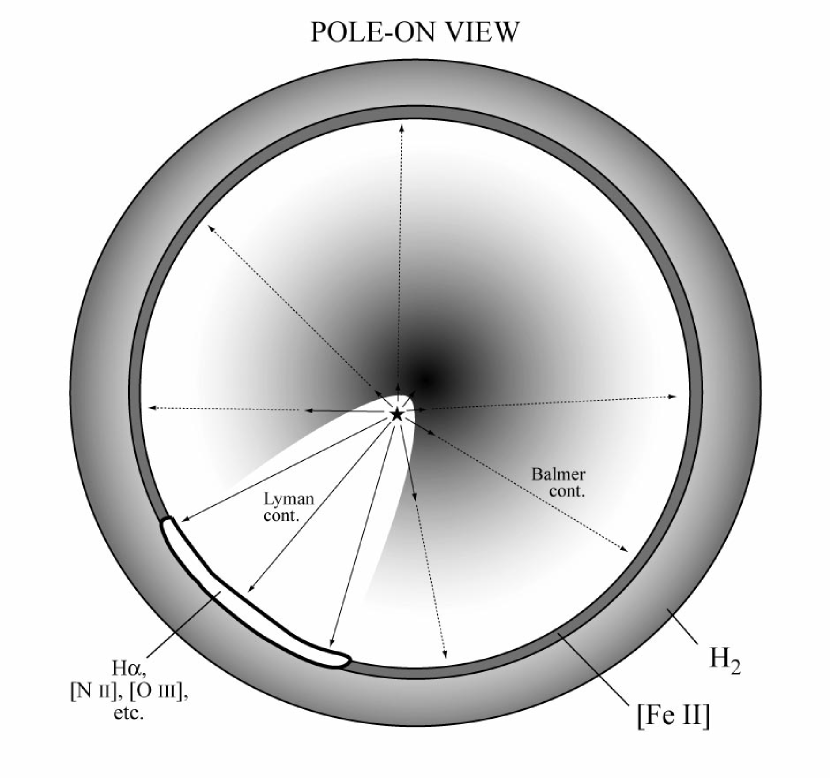
Suppose that the central engine of M 2-9 is a symbiotic binary system composed of a very hot source and a cooler star with a dense mass-loss wind. By “hot” we mean that the star is the dominant source of Lyman continuum photons in the system, and by “dense” we mean that the wind is optically thick in the Lyman continuum. If the powerful wind of the cooler star overwhelms the wind of the hot companion, or if a jet from the compact source clears a path through the dense wind (e.g., Livio & Soker 2001; Garcia-Arredondo & Frank 2004), then ionizing radiation from the hot star may be confined to escape only through a narrow range of azimuthal angles (see Fig. 5). This direction of escape will rotate with time as the orbit proceeds, sending a rotating searchlight beam of ionizing radiation out into the nebula. This is essentially the scenario favored by Livio & Soker (2001). However, the cool dense wind should be more transparent below 13.6 eV, so escape of Balmer continuum photons will be thwarted to a lesser degree than the Lyman continuum. Consequently, the Balmer continuum radiation may escape from a larger azimuthal angle, exhibiting only mild asymmetry by comparison.
Continuing with this qualitative scenario, the Lyman continuum photons from the hot star that are intercepted by the cool star’s optically-thick wind will ionize some fraction of that wind, regardless of the spectral type of the cool star. A dense partially-ionized wind would give rise to a strong P Cygni absorption feature and prominent electron scattering wings. In essence, the net spectrum of the system would mimic that of a hot evolved star with a strong wind. Both of these are observed in the H profile of the central star (Balick 1989). Electron scattering wings in a dense wind extend to apparent Doppler shifts larger than actual gas motions, so this would explain the very broad wings of H, which extend several thousand km s-1 to the blue and red.
In summary, then, the basic picture we favor is one where the infrared [Fe ii] and H2 emission is excited by relatively isotropic far-UV (Balmer continuum) photons, and H and other asymmtric visual-wavelength lines result from a highly direction-dependent rotating beam of Lyman continuum radiation from the central binary system (Fig. 5). The Balmer continuum need not be perfectly isotropic to explain the observations, so long as it is more isotropic than the ionizing radiation. Without a strong source of Lyman continuum, we may lack an explanation for the broad wings of H from the central star. A rotating UV illumination source also gives a more straightforward explanation for the observed mirror symmetry in the nebula above and below the equator, as opposed to the point-symmetric structure expected from a precessing jet (Cliffe et al. 1995; Garcia-Segura 1997; Livio & Soker 2001; Garcia-Arredondo & Frank 2004).
4.3 Comparing M 2-9 and Eta Carinae
At first glance, comparing M 2-9 with Carinae might seem like an exercise in futility. After all, Car is more than two orders of magnitude more luminous and almost two orders of magnitude more massive than the central star(s) of M 2-9, and the Homunculus nebula is about an order of magnitude more massive than the polar lobes of M 2-9 (Smith et al. 2003; Smith & Gehrz 2005). Car is an unstable hot supergiant teetering near the Eddington limit, it has never been and will never be a cool asymptotic giant branch star, and it will most likely end its life as an energetic supernova or hypernova instead of as a PN. These extreme differences in the central stars make the similarities in their two circumstellar nebulae even more remarkable.
Double Shells: As noted earlier, both M 2-9 and Car show the same double-shell structure, with a thin outer molecular skin and inner lobes seen in [Fe ii] (§3.1; HL94; Smith 2002). This points to similar excitation conditions and a similar density structure in the hollow bipolar lobes of each nebula, where far-UV from the central engine is attenuated by dust, allowing H2 to form in the outer lobes. This scenario – where Lyman continuum is quashed by a dense stellar wind while Balmer continuum photons still escape – certainly applies to Car. Given this similarily, it is peculiar that the clumpy mottled structure of the bipolar lobes around Car is so different from the smooth structure in M 2-9.
Hubble Flows: In both objects, the kinematics seen in long-slit spectra resemble the morphology in images, which is equivalent to saying that they exhibit homologous expansion or “Hubble” flows. This suggests either that most of the mass seen in images was ejected in a single outburst (ejected on a timescale small compared to the age of the nebula), or that material ejected in more than one event has interacted dynamically to mimic a coeval outflow. We know that the former is true for Car, because proper motions and linear expansion give an ejection date during the visually-observed outburst in the 19th century (Smith & Gehrz 1998). In any case, the Hubble flow observed in M 2-9 classifies it with several other bipolar nebulae exhibiting Hubble flows (e.g., Corradi 2004; Balick & Frank 2002; Corradi & Schwarz 1993).
Pinched Waists and Dust Tori: Both nebulae have tightly-pinched waists with the polar lobes meeting at a bright, obscured central star. In the case of Car, the polar lobes do not converge all the way to the star, but instead meet at the equator to form a hot dusty ring or torus with a radius of a few 103 AU (Smith et al. 2003). In M 2-9, the outer lobes also meet at the equator to form a molecular ring (Zweigle et al. 1997), and M 2-9 appears to harbor a warm dusty circumstellar torus (Smith & Gehrz 2005).
Rotating Excitation Source: M 2-9 is unique compared to other PNe – even bipolar and symbiotic PNe with a similar tight-waisted morphology. The ionzation structure in its polar lobes changes on short timescales (decades), where the brightest emission from ionized gas appears to move laterally, in a direction perpendicular to the polar axis (Doyle et al. 2000; Balick 1999; Goodrich 1991; Kohoutek & Surdej 1980; Allen & Swings 1972). This seems to be caused by a source of ionization escaping the nucleus in a preferred direction that rotates with time, as described in the previous section. Analogous behavior has been seen recently in Carinae (Smith et al. 2004), although its variable “Purple Haze” is revealed as scattered UV continuum light rather than changing tracers of ionized gas like the [O iii] emission in M 2-9. In both objects, the rotating excitation suggests that the central engine is a binary system, and that the stars are close enough that the dense wind of one star (an asymptotic giant branch star in M 2-9, or the luminous blue variable in Car) confines the UV radiation or wind from the secondary to escape only in certain directions as the stars orbit around one another.
References
- (1)
- (2) Allen, D.A., & Swings, J.P. 1972, ApJ, 174, 583
- (3)
- (4) Bachiller, R., Martin-Pintado, J., & Bujarrabal, V. 1990, A&A, 227, 188
- (5)
- (6) Balick, B. 1989, AJ, 97, 476
- (7)
- (8) Balick, B. 1999, in ASP Conf. Ser. 188, Optical and IR Spectroscopy of Circumstellar Matter, eds. E.W. Guenther, B. Stecklum, & S. Klose (San Francisco: ASP), 241
- (9)
- (10) Balick, B., & Frank, A. 2002, ARAA, 40, 439
- (11)
- (12) Cliffe, J.A., Frank, A., Livio, M., & Jones, T.W. 1995, ApJ, 447, L49
- (13)
- (14) Corradi, R.L.M., 2004, in ASP Conf. Ser. 199, Asymmetrical Planetary Nebulae III, eds. M. Meixner, J.H. Kastner, B. Balick, & N. Soker (San Francisco: ASP), 148
- (15)
- (16) Corradi, R.L.M., & Schwarz, H.E. 1993, A&A, 278, 247
- (17)
- (18) Corradi, R.L.M., Livio, M., Schwarz, H.E., & Munari, U. 2000, in ASP Conf. Ser. 199, Asymmetrical Planetary Nebulae II: From Origins to Microstructures, eds. J.H. Kastner, N. Soker, & Rappaport (San Francisco: ASP), 175
- (19)
- (20) Cox, P., Lucas, R., Huggins, P.J., Foreville, T., Bachiller, R., Guilloteau, S., Maillard, J.P., & Omont, A. 2000, A&A, 353, L25
- (21)
- (22) Doyle, S., Balick, B., Corradi, R.L.M., & Schwarz, H.E. 2000, AJ, 119, 1339
- (23)
- (24) Frank, A., Balick, B., & Livio, M. 1996, ApJ, 471, L53
- (25)
- (26) Garcia-Arredondo, F., & Frank, A. 2004, ApJ, 600, 992
- (27)
- (28) Garcia-Segura, G. 1997, ApJ, 489, L189
- (29)
- (30) Goodrich, R.W. 1991, ApJ, 366, 163
- (31)
- (32) Greene, T., et al. 1993, SPIE, 1946, 313
- (33)
- (34) Guerrero, M.A., Chu, Y.H., & Miranda, L.F. 2004, AJ, 128, 1694
- (35)
- (36) Hodapp, C. et al. 1996, New Astronomy, 1, 177
- (37)
- (38) Hora, J.L., & Latter, W.B. 1994, ApJ, 437, 281
- (39)
- (40) Hora, J.L., & Latter, W.B. 1996, ApJ, 461, 288
- (41)
- (42) Icke, V., Preston, H., & Balick, B. 1989, AJ, 97, 462
- (43)
- (44) Kastner, J.H., Weintraub, D.A., Gatley, I., Merrill, K.M., & Probst, R.G. 1996, ApJ, 462, 777
- (45)
- (46) King, D.J., Perkins, H.G., Scarrott, S.M., & Taylor, K.N.R. 1981, MNRAS, 196, 45
- (47)
- (48) Kohoutek, L., & Surdej, J. 1980, A&A, 85, 161
- (49)
- (50) Latter, W.B., Dayal, A., Bieging, J.H., Meakin, C., Hora, J.L., Kelly, D.M., & Tielens, A.G.G.M. 2000, ApJ, 539, 783
- (51)
- (52) Lim, J., & Kwok,S. 2000, in ASP Conf. Ser. 199, Asymmetrical Planetary Nebulae II: From Origins to Microstructures, eds. J.H. Kastner, N. Soker, & Rappaport (San Francisco: ASP), 259
- (53)
- (54) Livio, M., & Soker, N. 2001, ApJ, 552, 685
- (55)
- (56) Minkowski, R. 1947, PASP, 59, 257
- (57)
- (58) Sahai, R., Hines, D.C., Kastner, J.H., Weintraub, D.A., Trauger, J.T., Rieke, M., Thompson, R.I., & Schneider, G. 1998, ApJ, 492, L163
- (59)
- (60) Santander-Garcia, M., Corradi, R.L.M., Balick, B., & Mampaso, A. 2004, A&A, 426, 185
- (61)
- (62) Schwarz, H.E., Aspin, C., Corradi, R.L.M., & Reipurth, B. 1997, A&A, 319, 267
- (63)
- (64) Schwarz, H.E., Aspin, C., & Lutz, J.H. 1989, ApJ, 344, L29
- (65)
- (66) Smith, N. 2002, MNRAS, 337, 1252
- (67)
- (68) Smith, N. 2003, MNRAS, 342, 383
- (69)
- (70) Smith, N. 2004, MNRAS, 351, L15
- (71)
- (72) Smith, N. 2005, MNRAS, 357, 1330
- (73)
- (74) Smith, N., & Gehrz, R.D. 1998, AJ, 116, 823
- (75)
- (76) Smith, N., & Gehrz, R.D. 2005, AJ, 129, 969
- (77)
- (78) Smith, N., Gehrz, R.D., Hinz, P.M., Hoffmann, W.F., Hora, J.L., Mamajek, E.E., & Meyer, M.R. 2003, AJ, 125, 1458
- (79)
- (80) Smith, N., Morse, JA., Collins, N., & Gull, T.R. 2004, ApJ, 610, L105
- (81)
- (82) Solf, J. 2000, A&A, 354, 674
- (83)
- (84) Swings, J.P., & Andrillat, Y. 1979, A&A, 74, 85
- (85)
- (86) Trammell, S.R., Goodrich, R.W., & Dinerstein, H.L. 1995, ApJ, 453, 761
- (87)
- (88) Welch, C.A., Frank, A., Pipher, J.L., Forrest, W.J., & Woodward, C.E. 1999, ApJ, 522, L69
- (89)
- (90) Whitelock, P.A. 1987, PASP, 99, 573
- (91)
- (92) Zweigle, J., Neri, R., Bachiller, R., Bujarrabal, V., & Grewing, M. 1997, A&A, 324, 624
- (93)
| Line | Feature | V (km s-1) |
|---|---|---|
| Fe ii] | N3 | +84.4 |
| Fe ii] | S3 | +56.2 |
| Fe ii] | N3+S3 average | +70.3 |
| H2 | star (blue) | +10.9 |
| H2 | star (center) | +68.2 |
| H2 | star (red) | +123.7 |
| H2 | N lobe (blue) | +57.5 |
| H2 | N lobe (red) | +89.2 |
| H2 | N lobe (avg.) | +73.4 |
| H2 | S lobe (blue) | +49.5 |
| H2 | S lobe (red) | +80.2 |
| H2 | S lobe (avg.) | +64.8 |
| H2 | N+S average | +69.1 |
| Vsys | +69.2 |