Unusual high-redshift radio BAL quasar 1624+3758
Abstract
We present observations of the most radio-luminous BAL quasar
known, 1624+3758, at redshift = 3.377.
The quasar has several unusual properties:
(1) The FeII UV191 1787-Å emission line is very prominent.
(2) The BAL trough (BALnicity index 2990 kms-1)
is detached by 21000 kms-1 and extends to
velocity =
-29000 kms-1.
There are additional intrinsic absorbers at
-1900 and -2800 kms-1.
(3) The radio rotation measure of the quasar,
18350 rad m-2, is the second-highest known.
The radio luminosity is =
4.31027
WHz-1 ( = 50 kms-1Mpc-1, = 0.5),
radio loudness = 260.
The radio source is compact ( 2.8 kpc) and the radio spectrum is
GHz-peaked, consistent with it being relatively young.
The width of the CIV emission line, in conjunction with
the total optical luminosity, implies black-hole mass 109 , 2.
The high Eddington ratio, and the radio-loudness,
place this quasar in one corner of Boroson’s (2002) 2-component
scheme for the classification of AGN,
implying a very high accretion rate, and this may account for
some of the unusual observed properties.
The = -1900 kms-1 absorber is a possible Lyman-limit system, with
(HI) = 4 1018 cm-2, and covering factor 0.7.
A complex mini-BAL absorber at
= -2200 – -3400 kms-1 is detected
in each of CIV, NV and OVI.
The blue and red
components of the CIV doublet happen to be unblended, allowing
both the covering factor and optical depth to be determined
as a function of velocity.
Variation of covering factor with velocity
dominates the form of the mini-BAL, with the absorption
being saturated (e 0) over most of the
velocity range.
The velocity dependence of the covering factor,
and the large velocity width,
imply that the mini-BAL is intrinsic to the quasar.
There is some evidence of line-locking between
velocity components in the CIV mini-BAL,
suggesting that radiation pressure plays a role
in accelerating the outflow.
keywords:
quasars: general - quasars: absorption lines - quasars: emission lines - galaxies: high redshift - early Universe - galaxies: intergalactic medium1 Introduction
In 10 – 20% of optically-selected quasars, broad absorption lines (BALs) are seen in the blue wings of the UV resonance emission lines (e.g. CIV), due to gas with outflow velocities up to 0.2 c (Hewett & Foltz 2003). The absorption troughs can be highly structured, but are smooth compared with thermal line widths. 20% of BALs are detached from the corresponding emission line by several thousand kms-1 (see Korista et al 1993 for examples). The blue and red edges of the BAL absorption trough are often relatively abrupt, spanning 100s kms-1. These distinctive features would be hard to reconcile with absorption by individual clouds, but are consistent with the line of sight to a BAL quasar intersecting an outflow which is not entirely radial, e.g. an outflow which initially emerges perpendicular to the accretion disk, and is then accelerated radially (Murray et al 1995, Elvis 2000). NV BALs often absorb part of the Ly emission line, so the BAL region must typically lie outside at least some of the broad emission-line region (BLR), i.e. 0.1 pc from the quasar nucleus. BALs are generally saturated (optical depth few) but non-black, implying partial covering of the nuclear regions (or infilling of the absorption troughs by scattered light). This means that column densities cannot be measured directly from apparent absorption depths (in the past this has led to incorrect inference of super-solar metallicities).
Formally, a BAL quasar is one with BALnicity index (, Weymann et al 1991) greater than zero. is defined as the equivalent width of the CIV absorption, integrated over any contiguous region of the spectrum 3000 - 25000 kms-1 blueward of the quasar velocity, spanning at least 2000 kms-1, with continuum intensity 0.9 that of the assumed unabsorbed continuum. Shallower BAL-like features are seen in a larger fraction of quasars (Reichard et al 2004), suggesting that many quasars have similar outflows. Absorbers similar to quasar BALs are seen in Seyfert 1 galaxies, albeit with lower outflow velocities, typically few hundred kms-1 (see contributions in Crenshaw, Kraemer & George 2002).
The most prominent BALs are due to high-ionisation species, particularly Li-like ions with one electron in the outer orbit: CIV 1549 Å, SiIV 1400 Å, NV 1240 Å. Quasars whose absorption is dominated by these are known as high-ionisation BALs (HiBALs). 15% of BAL quasars also show absorption by lower-ionisation species, such as MgII 2798 Å and AlIII 1858 Å, and are known as LoBALs. FeLoBALs are a small subset of the LoBALs showing absorption by FeII and FeIII.
With few exceptions, no changes have been observed in the velocity structure of BALs on timescales 10 years. The intensity of the absorption does vary, probably due to changes in covering factor, which suggests that the absorbers are intrinsic to the quasar.
BAL quasars are typically weak in soft X-rays, probably because the X-ray emission is absorbed. The relationship between UV and X-ray absorbers was discussed by Blustin et al (2004).
Several useful catalogues of BAL quasars exist. Korista et al (1993) presented a sample of 72 CIV BALs. Becker et al (2000, 2001) found 43 BALs in 3300 deg2 of the FIRST Bright Quasar Survey ( 1 mJy). Large samples of quasars are now becoming available from the Sloan Digital Sky Survey (SDSS, York et al 2000). Reichard et al (2003a) found 224 BAL quasars in the SDSS Early Data Release quasar catalogue. This sample includes the 116 BALs found by Tolea, Krolik & Tsvetanov (2002), and it overlaps with that of Menou et al (2001), who sought identifications of SDSS quasars with FIRST sources in 290 deg2 (14 radio BALs). A catalogue of 23 unusual BALs found in SDSS (mainly LoBALs) was presented by Hall et al (2002).
Hypotheses about the nature of BAL quasars differ mainly in the emphasis placed on the role of orientation. On the one hand, BALs may be present in all quasars but are intercepted by only 10 – 20% of the lines of sight to the quasar, e.g. lines of sight skimming the edge of the accretion disk or torus (Weymann et al 1991, Elvis 2000). Alternatively, BALs may arise in a physically distinct population of quasars, e.g. newborn quasars shedding their cocoons of gas and dust, or quasars with unusually massive black holes, or with unusually high accretion rates (Briggs, Turnshek & Wolfe 1984, Boroson & Meyers 1992). Amongst optically-selected quasars, evidence has accumulated to favour the orientation hypothesis. E.g. in most respects, apart from the BAL itself, BAL quasars appear similar to normal quasars (Weymann et al 1991). The small differences from non-BAL quasars, e.g. slightly redder continua (Reichard et al 2003b), and higher polarisation, could also be a consequence of a preferred viewing angle. The sub-mm properties of BALs are similar to those of non-BALs (Willott, Rawlings & Grimes 2003, Lewis, Chapman & Kuncic 2003), implying similar dust properties. This is consistent with the orientation hypothesis, but difficult to reconcile with BAL quasars being an evolutionary stage associated with a large dust mass.
Until recently, very few radio-loud BAL quasars were known. This changed with the advent of the FIRST Bright Quasar Survey (FBQS, Becker et al 2001), but few BALs are known with log 2 (radio-loudness = , Stocke et al 1992). Becker et al (2001) estimated that BALs are four times less common amongst quasars with log 2 than amongst quasars with log 1. Hewett & Foltz (2003) note that optically-bright BAL quasars are half as likely as non-BALs to have 1 mJy. The dependence of BAL fraction on may reflect the higher ratio of X-ray to UV luminosity in radio-louder objects, which could over-ionise the gas, reducing the velocity to which line-driven winds can be accelerated (Murray et al 1995). Becker et al (2000) found that radio-selected BAL quasars have a range of spectral indices, which suggests a wide range of orientations, contrary to the favoured interpretation for optically-selected quasars. Radio-loud BALs tend to be compact in the radio, similar to GPS (GHz-peaked spectrum) or CSS (compact steep-spectrum) sources, and GPS/CSS sources are thought to be the young counterparts of powerful large-scale radio sources (O’Dea 1998). This supports the alternative hypothesis that BALs represent an early phase in the life of quasars (Gregg et al 2000).
In Boroson’s (2002) scheme for the classification of AGN, based on a principal-component analysis of AGN properties, the different observed types correspond to different combinations of (luminosity as a fraction of Eddington luminosity) and (the accretion rate). BAL quasars occupy one corner of this space, with 1, similar to narrow-line Sy1 galaxies, but with a much higher accretion rate. The BAL quasar accretion rates are similar to those of radio-loud quasars, but with larger (and lower-mass black holes). In Boroson’s scheme, the rare radio-loud BAL quasars may be objects with extremely high accretion rates.
Lamy & Hutsemekers (2004) carried out a principal-component analysis of 139 BAL quasars with good-quality spectra and/or polarisation measurements. They found that most of the variation is contained in two principal components. The first is dominated by a correlation between and the strength of the FeII emission, and may be driven by the accretion rate. The second is due to the fact that BALs with PCyg profiles (i.e. absorption just blueward of the emission line), are more polarised than those with detached BALs. Detachment is thought to correlate with orientation, with the more detached BALs being seen if the angle of the line of sight to the disk is larger.
Hewett & Foltz (2003) found no evidence that the fraction of quasars with BALs varies with redshift for 3. However, at higher redshift, the fraction may rise. Maiolino et al (2004) recently found that of 8 4.9 quasars observed, 4 showed strong BALs, with 2 of these having unusually high BALnicity index, and two being LoBALs (which are rare at low redshift). These results suggest that BALs are more common at high redshift, perhaps because of a higher accretion rate, which might affect the solid angle subtended at the quasar by the BAL flow, and thus the fraction of quasars observed to have BALs.
In short, the role of orientation in BALs is still not clear, and it’s likely that detailed measurements of physical conditions within the outflows are required to make further progress. Studies of BAL outflows are also important: (1) for understanding accretion in AGN, where the inflow (fuelling) and outflow rates may be related through the need to shed angular momentum; (2) as probes of chemical enrichment in the central regions of AGN; (3) because the outflowing gas may contribute significantly to the metallicity of the IGM; (4) because the outflows may affect the subsequent evolution of the host galaxy (Silk & Rees 1998, Fabian 1999); and (5) because the physics of the outflowing gas is not understood. No self-consistent physical model yet exists for the acceleration of the gas, or, if the filling factor is small (many small clouds), for its confinement. Possible mechanisms for the acceleration include radiation pressure, pressure from cosmic rays or centrifugally-driven magnetic disk winds (de Kool 1997). One possible signature of radiation pressure is absorption-absorption line-locking, and this has been observed in a few quasars (see Section 3.2.2).
1.1 NALs and mini-BALs
The blending of saturated features in BALs precludes measurement of the column densities, which are required to constrain the ionisation balance, the distance of the absorber from the quasar and the physics involved in accelerating the outflows. However, some quasars show additional narrow absorption lines (NALs) with velocity widths small enough (FWHM 300 km/s) that multiplets of individual ions can be resolved, allowing the covering factor and true optical depth to be determined independently (Arav et al 1999). Some NALs are intrinsic to the quasar (AALs, associated absorption lines, see e.g. Wise at al 2004) and may be related to the BAL phenomenon. Intermediate in FWHM are the rarer ( 1% of quasars, Hamann & Sabra 2004) mini-BALs, FWHM 2000 km s-1. The partial covering, variability and smooth absorption troughs indicate that mini-BALs are intrinsic outflows like those seen in BALs, but with the advantage that in some cases the covering factor and optical depth can be measured as a function of velocity. Mini-BALs are thus particularly useful for constraining physical conditions in the outflow.
Using mostly the HST, Keck and VLT, high-resolution spectra of several intrinsic NAL and mini-BAL absorbers have been obtained, including those in quasars (full names abbreviated) 0011+0055 (Hutsemékers, Hall & Brinkmann 2004), 0300+0048 (Hall et al 2003), 0449-13 (Barlow et al 1997), 08279+5255 (Srianand et al 2000), 0946+301 (Arav et al 2001), 1037-2703 (Srianand et al 2001), 1044+3656 (deKool et al 2001), 1230+0115 (Ganguly et al 2003), 1303+308 (Foltz et al 1987, Vilkoviskij & Irwin 2001), 1415+3408 (Churchill et al 1999), 1511+091 (Srianand et al 2002), 1603+3002 (Arav et al 1999), 1605-0112 (Gupta et al 2003), 2233-606 (Petitjean et al 1999), 2302+029 (Jannuzi et al 1996), UM675 (Hamann et al 1997), in 6 quasars studied by D’Odorico et al (2004), and in the Sy1 galaxy NGC 5548 (Arav et al 2002). The earlier of these papers established the intrinsic nature of the absorbers, and showed the importance, when measuring column densities, of taking into account saturation and the limited covering factor. These analyses also implied that the absorbers lie close to the quasar nucleus (although there are few actual measurements of distance), and might in some cases be identified with the X-ray warm absorbers.
Some of the quasars (0449-13, 0946+301, 1037-2703, 1303+308) show changes with time of covering factor. Only 1303+308 has shown any change in velocity (55 kms-1 increase in velocity over 5 rest-frame years). In some (0011+0055, 08279+5255, 2233-606), the covering factor varies with ion, perhaps because of inhomogeneous coverage (Hamann & Sabra 2004). In 1603+3002 the absorption covers the continuum, but not the broad-line region (BLR). 1415+3408 is unusual in that the covering factor in NV is close to 1, suggesting an unusual viewing angle. Several of these objects (see Section 3.2.2) show evidence of line-locking between individual velocity components.
In summary, intrinsic NALs and mini-BALs are excellent probes of the abundances and physical conditions in outflows close to the nuclei of quasars, with each object providing a fresh perspective.
1.2 Radio BAL quasar 1624+3758
Here we present a HiBAL quasar with unusual optical and radio properties. Quasar 1624+3758 (POSS = 18.1, = 2.5) was identified during a search for high-redshift quasars at the positions of FIRST radio sources, using the Isaac Newton Telescope (Benn et al 2002, Holt et al 2004). The radio source, = 56 mJy, is at RA 16h 24m 53.47s, Dec 37o 58′ 06.7′′ (J2000), 0.02s E, 0.0” N of the POSS-I/APM (Automated Plate Measuring Machine, Cambridge) optical position. 1624+3758 is the most radio-luminous BAL quasar known (Fig. 1), = 4.31027 WHz-1.
It is also highly luminous in the optical. The mag implies (1450-Å) -27.6, 51024 WHz-1, and 1047 ergs-1, corresponding to total luminosity 1047.6 ergs-1, using the bolometric correction of Warner, Hamann & Dietrich (2004).
1624+3758 is detected in the 2MASS survey (Cutri et al 2003), with = 16.9, = 16.3, = 15.6. No X-ray detection is recorded in the NED/IPAC extragalactic database (NED).
The radio loudness of the quasar (defined above), calculated from the radio spectrum reported in Section 2.2, and the 2MASS J mag (rest-frame 2800 Å), is = 260 (assuming no extinction in the UV). This meets the conventional definition of radio-loud, log 1. Few BAL quasars are known with log 2.
 |
In this paper, we report high-resolution ( = 10000) optical spectroscopy of the quasar, and radio observations. In Section 2, we present the optical and radio observations. The emission and absorption features are analysed in Section 3. In Section 4 we discuss the nature of the quasar. Our conclusions are summarised in Section 5.
For consistency with earlier papers, we use throughout a cosmology with = 50 kms-1Mpc-1, = 0.5, = 0. Wavelengths are corrected to vacuum, heliocentric.
2 Observations
2.1 Optical spectroscopy
Spectra of 1624+3758 were obtained with ISIS, the dual-arm spectrograph of the 4.2-m William Herschel Telescope on La Palma, on 2003 June 18 (service observation) and on 2003 July 2. The June spectrum covers the wavelength ranges 4200 - 5700 and 5700 - 7300 Å, with resolutions 2.3 and 1.8 Å respectively. The July spectrum covers the range 6200 - 7000 Å, with resolution 0.8 Å. The observing details are summarised in Table 1. All observations were carried out at the parallactic angle, in photometric conditions, and with the moon below the horizon.
The data were reduced in the usual way, using standard packages in IRAF for the bias subtraction, flat fielding, cosmic-ray removal, wavelength calibration and intensity calibration. The rms errors in wavelength calibration, determined by comparing the measured and published (Osterbrock et al 1996) wavelengths of night-sky emission lines, are given in column 11 of Table 1 (the value for the June 18 blue-arm observation is an upper limit, since only a few faint sky lines were detected). The spectral resolution (column 10) was measured from the widths of the sky lines.
Inter-comparison of the standard-star spectra suggests that the accuracy of the intensity calibration is 5%.
A low-resolution spectrum of the quasar (FWHM 4 Å in the red) was obtained in 2003 by the Sloan Digital Sky Survey (SDSS data release 3, Abazajian et al 2004). The SDSS apparent magnitudes are = 22.4, = 19.1, = 18.5, = 18.2, = 18.0.
| Date of | Airmass | Seeing | Dichroic | ISIS | Grating | CCD | Wavel. range | Exposure | Resolution | |
|---|---|---|---|---|---|---|---|---|---|---|
| observation | (arcsec) | used | arm | (Å ) | (s) | (Å ) | (Å ) | |||
| (1) | (2) | (3) | (4) | (5) | (6) | (7) | (8) | (9) | (10) | (11) |
| 2003 June 18 | 1.02 | 0.9 | 5700 Å | blue | R600B | EEV12 | 4200 – 5700 | 21800 | 2.3 | 0.15 |
| 2003 June 18 | 1.02 | 0.9 | 5700 Å | red | R600R | MAR2 | 5700 – 7300 | 21800 | 1.8 | 0.04 |
| 2003 July 2 | 1.73 | 0.9 | clear | red | R1200R | MAR2 | 6200 – 7000 | 31800 | 0.8 | 0.04 |
2.2 Radio observations
We observed 1624+3758 with the 100-m Effelsberg radio telescope at 4.85 and 10.45 GHz on 2003 Dec 18 and 2004 Jan 17 respectively. The cross-scanning technique used is described by Vigotti et al (1999) and references therein. 3C286 was used as a flux-density calibrator.
We also observed 1624+3758 with the VLA (Very Large Array) radio telescope in C configuration, at 8.5 GHz (exposure time 20 mins) and 22.5 GHz (exposure time 40 mins), on 2004 Mar 24. The nearby source 1613+342 was used as a phase calibrator. Initial images of the source contained sufficient flux density to permit local self-calibration to remove residual phase errors. 3C286 was used as a flux-density calibrator. The data were reduced with the IMAGR program in the AIPS package.
We also observed the quasar with the Westerbork Synthesis Radio Telescope (WSRT) for 3 hours on 2004 Jul 1. The 2.2-GHz flux density was measured, but only a 3-sigma upper limit on the polarisation could be obtained, due to a combination of radio interference and technical problems.
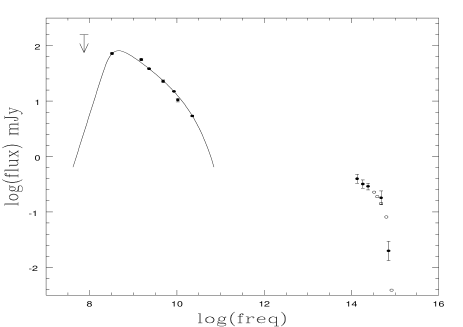
Our radio observations are summarised, with others from the literature, in Table 2, and the spectral energy distribution is shown in Fig 2. The spectrum is steep at high radio frequencies, = -0.9 ().
At 22.5 GHz, the source is resolved by the VLA, size 0.4 0.1 arcsec. This implies a projected linear size 2.8 kpc i.e. this is a Compact Steep Spectrum (CSS) source, as are most radio BAL quasars (Becker et al 2000). 1624+3758 is one of the most distant CSS sources known. The spectrum turns over at low frequency, probably due to synchrotron self-absorption. The rest-frame turnover frequency 2 GHz provides an independent estimate of size, 0.1 – 1 kpc (using the relationship given by O’Dea 1998).
The steep radio spectral index implies that the source is
lobe-dominated.
The spectrum at frequencies higher than 1 GHz shows significant
curvature (it cannot be fitted with a simple power law), which we
attribute to ageing of the population of relativistic electrons
responsible for the synchrotron emission
(Murgia et al 1999).
We fitted the observed spectrum with two popular ageing models:
the continuous-injection (CI) model of Pacholzcyk (1970),
which assumes continuous replenishment within each resolution element
of particles and energy lost through synchrotron radiation;
and the model of Jaffe & Perola (1973, JP),
which predicts spectral ageing assuming no replenishment.
Fitting the spectrum with these models yields the break frequency
at which the spectrum starts to turn down as a result of
synchrotron losses.
The particle ages are then given by:
My
(Murgia et al 1999),
where is
the source magnetic field in G,
is the magnetic field strength corresponding to the
cosmic microwave background (G),
and is in GHz.
The JP model fits the data better than the CI model, as
is often the case for relic sources in which activity has ceased.
The fitted break frequencies are GHz for
the CI model
and GHz for the JP model.
If equipartition of energy between magnetic field
and relativistic particles is assumed, then
(following Miley 1980)
= 740 G.
Even using the lower estimated
(from the CI model), this yields a
maximum particle age of y, is
typical of synchrotron ages found
for lobe-dominated CSS sources (e.g. Murgia et al
1999).
The radio emission in 1624+3758 is therefore of recent origin compared with the typical age of an evolved radio source, y.
The position angle of the polarisation PA was measured at each of 4.85, 8.46, 10.45 and 22.46 GHz (the source is depolarised at frequencies 2.2 GHz). From the variation with wavelength (Fig. 3), we determine the rotation measure () to be 960 30 rad m-2 which in the rest frame of the source is a factor (1 + z)2 higher, i.e. 18350 570 rad m-2. This is the second-highest known, after that of quasar OQ172 (Kato et al 1987, O’Dea 1998), = 22400 rad m-2. OQ172 is not a BAL quasar. In a recently published compilation of pc-scale in AGN, Zavala & Taylor (2004) found a median of 2000 and no AGN with 10000 .

Rotation measure is proportional to , where is the electron density, is the magnetic field strength along the line-of-sight and the effective path length along the line-of-sight, so an unusually high value of implies a high value of at least one of these parameters.
| Telescope | Freq. | Resolution | Flux density | Polarisation | Survey | ||||
|---|---|---|---|---|---|---|---|---|---|
| GHz | arcsec | mJy | % | deg | |||||
| VLA (B) | 0.074 | 80 | 220 | VLSS | |||||
| WSRT | 0.325 | 54 | 72 | 5.3 | WENSS | ||||
| VLA (D) | 1.40 | 45 | 55.6 | 1.7 | 2.2 | NVSS | |||
| VLA (B) | 1.40 | 5 | 56.4 | 1.5 | FIRST | ||||
| WSRT | 2.27 | 36 | 38.5 | 0.8 | 2.3 | this paper | |||
| Effelsberg | 4.85 | 120 | 23.3 | 1.1 | 1.7 | 0.7 | -152 | 7 | this paper |
| VLA (C) | 8.46 | 2.4 | 15.0 | 0.09 | 6.5 | 0.3 | -7 | 4 | this paper |
| Effelsberg | 10.45 | 270 | 10.5 | 0.8 | 11.0 | 3.0 | 19 | 5 | this paper |
| VLA (C) | 22.46 | 0.9 | 5.4 | 0.02 | 11.3 | 1.5 | 45 | 13 | this paper |
The flux densities are all on the scale of Baars et al (1977). The surveys are: VLSS = VLA Low-frequency Sky Survey (Kassim et al 2003); WENSS = Westerbork Northern Sky Survey (Rengelink et al 1997); NVSS = NRAO VLA Sky Survey (Condon et al 1998); FIRST = Faint Images of the Radio Sky at Twenty-cm (White et al 1997). = position angle of polarisation.
3 Results of optical spectroscopy
Fig. 4 shows the ISIS spectrum of 1624+3758 obtained 2003 Jun 18. Figs. 5 and 6 show the spectrum at higher dispersion. Emission and absorption features are listed in Tables 3 and 4 respectively. Derived column densities are listed in Table 5.
We discuss the emission lines in Section 3.1. The absorption features include: a mini-BAL (defined as a BAL-like feature spanning 2000 kms-1, Section 3.2, Figs. 8, 9, 10); a possible associated (i.e. -3000 kms-1) absorber with large HI column density (Section 3.3); a BAL (Section 3.4); and 9 NALs (2 probably associated, 7 intervening, Section 3.5).
The spectral index of the continuum between observed wavelengths 7000 and 9000 Å (rest-frame 1600 - 2060 Å) is = -0.7 (), = -1.3, slightly redder than most HiBAL quasars (Reichard et al 2003b), similar to the median for LoBAL quasars, and suggesting dust reddening 0.07 mag relative to non-BAL quasars, assuming extinction by SMC-type dust (Pei 1992). (The quasar’s much redder broad-band colour, = 2.5, is due to the drop in the continuum across Ly.)


3.1 Emission lines, and quasar redshift
The centroid wavelengths of the Ly, NV, OI, CII, SiIV and CIV emission lines are given in column 4 of Table 3. Ly 1026 Å, OVI 1035 Å and HeII 1640 Å are not detected in emission.
| Line | Notes | ||||||||
| Å | Å | Å | Å | kms-1 | kms-1 | ||||
| (1) | (2) | (3) | (4) | (5) | (6) | (7) | (8) | (9) | (10) |
| Lyα | 1215.67 | 1214.97 | 5314.7 | 3 | 3.3743 | 0.0025 | -350 | -180 | |
| NV | 1238.82 / 1242.80 | 1239.16 | 5420.2 | 2 | 3.3741 | 0.0016 | -430 | -200 | |
| OI | 1302/4/6 triplet | 1304.24 | 5713.6 | 5 | 3.3808 | 0.0038 | 210 | 260 | confused by SIV BAL? |
| CII | 1334.53 | 1334.53 | 5844.7 | 3 | 3.3796 | 0.0022 | 150 | 180 | |
| SiIV | 1393.75 / 1402.77 | 1398.62 | 6131.6 | 3 | 3.3840 | 0.0021 | 630 | 480 | SiIV/OIV∗ |
| CIV | 1548.20 / 1550.78 | 1547.46 | 6771.2 | 3 | 3.3757 | 0.0019 | -320 | -90 |
The columns give: (1) line; (2) laboratory vacuum wavelength; (3) representative wavelength tabulated by Tytler & Fan (1992) for obtaining ; (4, 5) observed wavelength and error; (6, 7) implied quasar redshift and error; (8) velocity of line relative to the assumed quasar = 3.377 (negative velocity = blueshift); (9) velocity of line relative to mean from Tytler & Fan; (10) notes.
The weaker emission lines detected in the SDSS spectrum redward of 7000 Å have not been used for estimating the redshift.
For convenience, we note here the laboratory vacuum wavelengths of the other lines mentioned in this paper: Ly 1025.72; OVI 1031.93, 1037.62; AlII 1670.79; FeII 1785/7/8; AlIII 1854.72 1862.79; CIII] 1908.73 Å.
The doublet wavelengths are for SiIV. The SiIV emission is usually blended with an OIV multiplet at 1402 Å.
The high-ionisation lines NV and CIV are blueshifted a few 100 kms-1 with respect to the low-ionisation lines, as in most quasars (Gaskell 1982, Tytler & Fan 1992, Richards et al 2002b). To obtain a system redshift (usually closer to that of the low-ionisation lines than that of the high-ionisation lines), we use the modified emission-line wavelengths tabulated by Tytler & Fan. These take into account the velocity shifts, and approximate . Tytler & Fan do not give a modified wavelength for CII, but this is a low-ionisation line, so we assume zero velocity shift relative to the quasar, i.e. = = 1334.53 Å. The observed emission-line wavelengths are consistent with a quasar redshift = 3.377 0.003. Column 8 of Table 3 gives the velocity of each line relative to this redshift. Column 9 gives the velocity relative to the mean for that line found by Tytler & Fan (typical dispersions 200 kms-1). The SiIV line in 1624+3758 is significantly redshifted relative to the other lines, but is blended with an OIV emission line, which might be strong in this quasar, given that the OI 1304 Å line is unusually strong.
The CIV emission line is blueshifted relative to the quasar by 320 kms-1, similar to the shifts found by Tytler & Fan for other quasars. The line is markedly asymmetric at its base (and the NV emission line has similar form, Fig. 7), consistent with the suggestion by Richards et al (2002b) that the apparent blueshift of CIV lines is due to the red wings of the lines being suppressed, perhaps in part due to dust obscuration of emission from outflows on the far side of the nucleus (see their fig. 11).
The rest-frame FWHM of the CIV line (inferred from the blue half of the line) is 2300 kms-1. In conjunction with the observed total luminosity (Section 1.2), this implies (Kaspi et al 2000; Warner, Hamann & Dietrich 2004) a black-hole-mass 10. This is similar to masses determined by Lacy et al (2001) for quasars of similar radio luminosity. It implies a high Eddington ratio 2.0, near the maximum found for quasars by Warner et al (2004).
The OI line is prominent, 4 Å, compared with 1.7 Å in the SDSS composite quasar spectrum of Vanden Berk et al (2001), and 1.8 and 5.0 Å in the composite HiBAL and LoBAL spectra of Reichard et al (2003a). Bright OI emission is more common amongst those Reichard et al BAL quasars with FIRST radio detections, 1 mJy (6 out of 9, 3) than amongst those without radio detection (7 out of 31, 3).
The prominent emission line at observed wavelength 7822.7 Å, = 3.8 Å, corresponding to rest-frame 1787.2 Å (Fig. 4), is detected in the SDSS composite spectrum, and is probably the FeII UV191 triplet at 1785/1787/1788 Å. In 1624+3758, this line is unusually strong, with rest-frame = 3.8 Å, compared to 0.3 Å in the SDSS composite spectrum, and 0.4 and 1.7 Å in the composite HiBAL and LoBAL spectra of Reichard et al (2003a). The FeII/CIV ratio is also high 0.5, compared to 0.01 for the SDSS composite, and 0.02 and 0.1 for the Reichard et al HiBAL and LoBAL composites.
FeII 1787-Å is detected in the SDSS spectra of only 1 out of 40 randomly-selected non-radio BALs (half 3, half 3) from the catalogue of Reichard et al (2003a), and in only 1 out of 20 non-radio LoBAL quasars from that catalogue. However, it’s detected in the spectra of 4 out of the 14 BALs from that catalogue which have radio counterparts in the FIRST catalogue, 1 mJy. The FeII/CIV ratio in 1624+3758 is higher than in any of these objects.
The two relatively-narrow emission lines at 1896.2 and 1915.1 Å, superimposed on the broad (and weak) CIII] emission line (Fig. 4) are probably the two bluer components of the FeIII UV34 triplet at 1895.5/1914.1/1926.3 Å.
These FeII and FeIII emission lines have also been observed in BAL quasar H0335-336 (Hartig & Baldwin 1986), and in quasar 2226-3905 (Graham et al 1996). Graham et al note that the FeII UV191 line is probably produced by dielectric recombination from Fe2+, i.e. it’s not surprising to observe it in asociation with FeIII lines.
3.2 Mini-BAL absorber, 3.3283 3.3450


The complex CIV absorption feature at outflow velocity -2200 – -3400 kms-1 (Fig. 8) is a ‘mini-BAL’, since the total velocity range is 2000 kms-1.
Five individual velocity components can be identified, with the CIV doublet well-resolved in each case. The velocity components are listed in Table 4. All are also detected in NV (Fig. 9), but with some blending of the components because of the lower spectral resolution. An additional absorber (13) is detected in NV. The mini-BAL is also detected in OVI (Fig. 10), but is confused by the Ly forest. Absorber 10 is detected in SiIV (Fig. 6).
The mini-BAL is observationally unusual in exhibiting significant velocity structure, but without blending between the two components of the CIV doublet. This allows the covering factor and optical depth to be measured independently.
The variation of covering factor with velocity (below) and the large velocity spread (much greater than that expected for a galaxy halo) suggest that the mini-BAL is intrinsic to the quasar.
3.2.1 Local covering factor and optical depth
The observed depth of an absorption feature depends on the optical depth of the absorbing cloud, and on the fraction of the source which the cloud covers (or, more generally, on as a function of ). The similarity of the CIV and NV mini-BAL profiles (Figs. 8, 9) suggests that the form of the mini-BAL is dominated by variations in local covering factor rather than by variations in optical depth. If the form of the mini-BAL were due to variation of optical depth, it’s unlikely, given the different ionisation potentials and abundances of CIV and NV, that this would result in similar CIV and NV absorption profiles.
Given observations with sufficient signal-to-noise of two absorption lines of a particular ion for which the ratio of the optical depths is known, one can solve for both and . For the CIV doublet, the ratio of the optical depths in the blue and red components is that of the oscillator strengths, (red) = (blue) / 2. Then the residual intensities in the red and blue components of the line, expressed as a fraction of the continuum intensity, are (Barlow & Sargent 1997, Arav et al 1999):
where is the optical depth in the blue component of the doublet. These equations can be solved for :
(as long as ) and for .
The derivation of and from and is shown graphically in Fig. 11. Permitted combinations of and (i.e. satisfying the above inequalities) fall in the unshaded region of the figure. The figure highlights the need for good S:N in carrying out this type of analysis, with the errors on derived and being comparable to the errors on , over much of the allowed range. It also gives an overview of the effects of errors in or due to inadequate spectral resolution or to contamination of one of the two lines. For example, with inadequate resolution, a narrow saturated feature, with = 1, = 0, and true = 0, = 0, may be observed as a broader unsaturated feature, with 0, 0, causing to be underestimated, and to be overestimated. Fig. 11 also illustrates how and are constrained by mere limits on and . E.g. if 0.2, must be 0.8.
The CIV mini-BAL shows similar velocity structure in each component of the doublet (Fig. 8), and the components are (just) unblended, with the intensity between them, near observed wavelength 6724 Å, being close to that of the continuum just blueward or redward of the mini-BAL. The derived values of and for the CIV mini-BAL (absorbers 10 - 12) are shown as a function of velocity in Fig. 12a. Note that the locus of measured , on Fig. 11 remains within the region of physically meaningful solutions (confirming that the spectrum has sufficient signal-to-noise to solve reliably for , ). Fig. 12a may be compared with fig. 2 of Arav et al (1999), who carried out a similar analysis, of a Keck spectrum of the mini-BAL in radio BAL-like quasar 1603+3002. In 1624+3758, the shape of the absorption in the CIV mini-BAL also appears to be dominated by variations with velocity of rather than variations of . For outflow velocities -2500 kms-1, the optical depth is consistent (within the errors, 0.03 in , ) with = 0, i.e. saturated, indicating that the true optical depth is much larger than is implied by the depth of the absorption feature. The limited covering factor 0.6, and the variation of with velocity, suggest that the mini-BAL is intrinsic to the quasar. The mean covering factor for -2500 km s-1 is 0.7, that for -2500 km s-1 is 0.6.
Four effects could complicate the above determination of and for the CIV mini-BAL.
(1) The covering factor of features narrower than the spectral resolution of ISIS (0.8 Å, 36 kms-1) may be underestimated. In particular, the observed absorption minima (FWHM 1.3, 0.9 and 1.5 Å, Fig. 8) might be due to saturated lines of similar equivalent widths. Saturation implies , = 0, = 1, = 0. In addition, inadequate spectral resolution can mimic partial covering, 1, in the (instrumental) wings of deep absorption features (Ganguly et al 1999). In the CIV mini-BAL anlaysed here, absorbers 10 and 11 are separated by five times the instrumental FWHM (0.8 Å), and absorbers 11 and 12 by four times the FWHM, so over most of the wavelength range in these intervals, there should be negligible contamination by the nearby absorption minima. We confirmed this by convolving with the instrumental PSF, a simulated spectrum comprising three saturated features (i.e. = 1) at the velocities of absorbers 10, 11 and 12, and with widths 1.0, 0.6 and 0.5 Å (36, 22 and 18 kms-1) respectively, to give the same equivalent widths as observed. The values of and measured from the convolved spectrum differ from those in the unconvolved spectrum by 0.05, over more than half of the total velocity range -2300 -2750 kms-1. This confirms that over most of the resolution elements between the absorption minima, is smaller than the lower limit on within the minima, i.e. it supports our conclusion that variations of dominate the shape of the observed absorption.
(2) The blue component of absorber 10 is blended with the red component of absorber 9 (Fig. 8), so the measured = 0.15 for the former could be underestimated by up to a few tenths. However, from Fig. 11 it can be seen that given the measured (and unblended) = 0.25 in the minimum of absorber 10, at this velocity (-2700 50 Å), is at most overestimated by 0.15.
(3) It is assumed above that the BAL clouds cover both the nucleus (continuum) and the broad-emission-line region (BLR). If the BAL covers the source of the continuum, but not the BLR (as is perhaps the case for the = 3.3498 absorber in 1624+3758, Section 3.3, and for the mini-BAL/NAL absorber discussed by Arav et al 1999), then the residual intensities would have to be measured relative to the continuum rather than continuum + BLR. Judging from Fig. 4, the contribution of the BLR at the wavelength of the mini-BAL adds 15% to the light from the continuum, and varies little with wavelength across the mini-BAL, so the measured , would have to be revised downwards by 0.15 if the mini-BAL does not cover the BLR. This would increase the estimate of the covering factor by 0.15, but leaves the estimate of almost unchanged.
(4) The equations relating , , and are based on the assumption of homogeneous partial coverage i.e. an opaque screen covering a fraction of the source. In reality, as emphasised by Hamann & Sabra (2004), absorbers are probably inhomogeneous, with different fractions of the source covered by absorbers of different opacity. However, the modelling of Hamann & Sabra suggests that as measured above will typically not differ by more than a few tens % from the true spatially-averaged value.
The residual intensities of the blue and red components of absorber 8, just blueward of the other components of the mini-BAL, but probably physically associated, imply covering factor 0.5, and near saturation. No attempt has been made to model the variation of covering factor with velocity, because of blending.
In NV (Fig. 9), the velocity structure is not well-resolved (the spectral resolution is poorer, 130 kms-1), so that a similar analysis (Fig. 12b) tends to underestimate the derived covering factor in the minima, but the mean covering factor 0.7, is similar to that found for CIV, and the opacity appears to be less at outflow velocities -2300 – -2450 kms-1, as for CIV.
A similar analysis in OVI (Figs. 10, 12c, same spectral resolution as for NV) is confused by the Ly forest (and also by Ly absorbers 15 and 16). The red component of the OVI doublet due to absorber 10 (which is unconfused by the Ly absorption) is black, i.e. the covering factor = 1, and = 0, in contrast to that for CIV and NV ions. Absorber 11 also appears to have 1. Not much can be said about the variation of and with velocity. The poor S:N in the OVI mini-BAL results in (non-physical, see Fig. 11) over some of the velocity range. For these velocities, the plotted curves in Fig. 12c give = 1 - , and = 0.
The variation of with ion (found also by Arav et al 1999, for 1603+3002) supports the suggestion by Hamann & Sabra (2004) that a given observed covering factor is often due to inhomogeneous partial coverage, in which optical depth changes across the source. The stronger transitions can then have 1 over larger areas than weak transitions.
Approximate column densities and limits for the apparently less-saturated part of the mini-BAL (-2300 – -2450 km s-1, 1), are given in Table 5. Column-density measurements of this accuracy do not justify detailed photoionisation calculations, but the HI, OVI, NV and CIV column densities are consistent with an ionisation parameter log = -1.5, log (Htotal) 18.4. using the photoionisation modelling of Hamman (1997, fig. 2c), with ionising continuum , and meteoritic solar abundances from Grevesse & Anders (1989). The lack of SiIV (and SiII) absorption implies log -2.0, i.e. is consistent with the above.

3.2.2 Possible line-locking
The CIV mini-BAL comprises 5 readily-identified CIV doublets (absorbers 8 - 12, Fig. 8). The blue component of the strongest, absorber 10, lies at 6715.8 Å, just 0.2 0.2 A blue of the 6716.0 expected wavelength of the red component of absorber 9. This suggests that the lines may be locked together. The chance of the red component of a given CIV doublet falling within of the blue component of any other CIV doublet, for doublets distributed at random over wavelength range , is . For = 40 Å, = 0.2, = 5, this probability is 0.05, i.e. the above coincidence is moderately significant.
The sixth absorber in the mini-BAL (no. 13) was identified in NV only (Fig. 9, expected CIV wavelengths marked on Fig. 8). Interestingly, the red component of the CIV doublet of absorber 10 lies at 6727.1 Å, 0.1 0.2 Å from the 6727.0 Å expected wavelength of the blue component of absorber 13. Absorbers 9, 10 and 13 might therefore be line-locked together (Fig. 8).
Absorption-absorption line-locking can occur when light of the wavelength required for a given transition in one cloud is absorbed by ions in a cloud closer to the quasar, with different velocity and undergoing a different transition. This reduces the radiation force on the shadowed cloud, and the cloud may lock at a velocity difference from the shadowing cloud corresponding to the wavelength difference of the two transitions. In general, several lines will contribute to the total radiation pressure on a cloud, but if this approximates the net force in the opposite direction (gravity, and perhaps drag), the effect of line-locking in one line could be significant (Korista et al 1993). Observation of line-locking lends support to the hypothesis that radiation pressure plays an important role in the acceleration of BAL gas (in at least some quasars). Line-locking is probably seen in the spectra of = 1.8 quasar 1303+308 (Foltz et al 1987, Vilkovskij & Irwin 2001) and = 2.9 quasar 1511+091 (Srianand et al 2002). The former includes several SiIV absorption doublets spaced by the separation of the two components of the doublet. Plausible examples of line-locking have also been noted in 08279+5255, 1230+0115, 1303+308, 1511+091, 1605-0112, NGC 5548 (references given in Section 1.1).
| Ref. | Velocity | Lines detected | d | FWHMb | FWHMr | Notes | ||||
| no. | km s-1 | Å | Å | Å | Å | Å | Å | |||
| (1) | (2) | (3) | (4) | (5) | (6) | (7) | (8) | (9) | (10) | (11) |
| 1 | 2.6379 | -54863 | Ly CIV | -0.1 | 2.3 | 2.1 | 0.24 | 1.7 | 0.19 | |
| 2 | 2.7977 | -42307 | Ly CIV | 1.8 | 1.6 | 0.16 | 0.15 | Second line of CIV | ||
| doublet obscured | ||||||||||
| by NaD sky line | ||||||||||
| 3 | 2.9722 | -29022 | Ly SiIV CIV | -0.1 | 1.8 | 1.6 | 0.14 | 2.5 | 0.21 | |
| 4 | 3.0438 | -23704 | Ly CIV | 0.2 | 1.8 | 3.1 | 0.30 | 1.6 | 0.11 | Resolved |
| 5 | 3.1182 | -18262 | Ly CIV | 0.5 | 1.8 | 2.2 | 0.12 | 2.0 | 0.05 | |
| 6 | 3.2251 | -10592 | Ly Ly CIV | 0.6 | 0.8 | 1.4 | 0.11 | 2.6 | 0.17 | Resolved |
| 7 | 3.2765 | -6967 | Ly Ly SiIV CIV | 0.0 | 0.8 | 2.5 | 0.34 | 4.1 | 0.24 | Resolved |
| 8 | 3.3283 | -3356 | OVI NV CIV | 0.1 | 0.8 | |||||
| 9 | 3.3307 | -3190 | CIV | 0.8 | ||||||
| 10 | 3.3378 | -2699 | OVI Ly NV SiIV CIV | 0.0 | 0.8 | |||||
| 11 | 3.3405 | -2512 | OVI Ly NV CIV | -0.3 | 0.8 | |||||
| 12 | 3.3429 | -2346 | NV CIV | -0.1 | 0.8 | |||||
| 13 | 3.3450 | -2201 | NV | 0.8 | ||||||
| 14 | 3.3498 | -1870 | Ly Ly | 0.8 | Possible LLS | |||||
| 15 | 3.3650 | -824 | Ly Ly SiIV CIV | 0.6 | 0.8 | 2.1 | 0.22 | 1.4 | 0.10 | Strong CIV, resolved |
| 16 | 3.3803 | 206 | Ly Ly SiIV CIV | 0.3 | 0.8 | 1.8 | 0.32 | 2.0 | 0.26 | Strong CIV, resolved |
The columns give: (1) Absorber reference number; (2) Redshift measured from the blue component of the CIV doublet (or NV for absorber 13, Ly for absorber 14), rms error 0.0001; (3) Absorber velocity relative to the assumed quasar redshift 3.377 (Section 3.1), calculated using , ; (4) Ions detected in absorption; (5) Observed - expected ( 11 Å) separation of CIV doublet (observed-frame); (6) Resolution of the spectrum from which the FWHM and equivalent widths were measured; (7-10) Observed-frame FWHM and rest-frame equivalent widths of blue and red components of CIV absorption line; (11) Notes. All of the CIV absorbers with 3.0 are detected in both the June 18 and July 2 ISIS red-arm spectra, except that absorber 9 is detected only in the (higher-resolution) July 2 spectrum.
Absorbers 1-7 are probably intervening absorbers (i.e. not associated with the quasar). Absorbers 8 - 13 are components of the mini-BAL. Absorbers 14 - 16 are probably intrinsic, ‘associated’, absorbers.
| Absorber | Velocity | log (cm-2) | Cov | ||||
|---|---|---|---|---|---|---|---|
| (and ref. no.) | kms-1 | HI | OVI | NV | SiIV | CIV | fac |
| (1) | (2) | (3) | (4) | (5) | (6) | (7) | (8) |
| BAL | -21000 – -29000 | 16.0 | 0.3 | ||||
| Mini-BAL (12) | -2300 – -2450 | 14 | 15.1 | 14.7 | 13.2 | 14.7 | 0.6 |
| LLS (14) | -1870 | 18.6 | 13.6 | 13.4 | 12.5 | 13.1 | 0.7 |
| AAL (15) | -824 | 18.0 | 13.0 | 13.7 | 1.0 | ||
| AAL (16) | 206 | 18.0 | 13.0 | 13.9 | 1.0 | ||
For the BAL and mini-BAL, the column densities or limits were calculated using cm-2 (Savage & Sembach 1991), where the oscillator strengths are taken from Verner, Barthel & Tytler (1994), laboratory wavelengths are given in Table 3, and is in km s-1. The metal-line column densities for the LLS and AALs were calculated from the rest-frame equivalent widths , using the alternative formulation: = cm-2 (Morton 2003). The (HI) column density of the LLS (absorber 14) is from a Voigt-profile fit to the damping wings (Fig. 13). The (HI) column density limits for the AALs are derived from the Ly curve of growth. The covering factors (column 8) are for CIV, except for the LLS, measured from Ly.
3.3 Possible Lyman-limit system at = 3.3498
 |
 |
 |
 |
The absorption feature at 5288 Å (Figs. 5, 13, 14) is flat-bottomed and shows possible damping wings, both suggesting saturation. The feature might be a blend of weaker lines, but here we explore the possibility that this is a saturated Ly absorber at = 3.3498. The residual flux at the base of line cannot be due to an intensity-calibration problem, since many of the nearby Ly-forest lines reach zero intensity. It therefore implies partial coverage of the source, = 0.7. The rest-frame equivalent width of the line is 1.5 Å. A Voigt-profile fit (Fig. 13) yields column density (HI) = 41018 cm-2, velocity parameter = 30 km s-1, i.e. a Lyman-limit system (LLS, 17.2 log(HI) 20.3, e.g. Lanzetta et al 1995).
The corresponding Ly falls in a heavily-absorbed part of the Ly forest, but may be detected, with the expected rest-frame equivalent width 1.0 Å. The Lyman limit would be at 3967 Å, but the SDSS spectrum has zero intensity bluewards of 3980 Å, perhaps due to Lyman-limit absorption by absorber 15 (see Section 3.5). Surprisingly, no metal lines are detected, (SiII), (SiIV), (CIV) 1013 cm-2. This cannot be due to very high ionisation, because no combination (Hamann 1997) of ionisation parameter log 0 and (H) 1024 cm-2 (above which the gas would be Thompson-thick) is consistent with the observed limits on metal column density. It might be due to low metallicity, which is one possible interpretation of the lack of metal lines in another non-black absorber: that found by Petitjean & Srianand (1999) in = 2.2 quasar J2233-606, with log(HI) = 14, = 0.7.
The limited covering factor, 1, implies that the putative absorber is intrinsic, and close to the nucleus of the quasar. The mini-BAL (Section 3.2) has similar covering factor, which might indicate similar physical location. Alternatively, the absorber might be covering the quasar continuum source only, and not the broad-line region (Fig. 14).


3.4 BAL (2.968 3.085)
The CIV BAL extends over observed wavelengths 6150 - 6330 Å, outflow velocity -29300 – -20700 kms-1. It is also detected in NV and SiIV, and perhaps in Ly (see Figs. 4, 5), although the SiIV trough is partially masked by the broad Ly and OI emission. The BALnicity index of 1624+3758 is 2990 kms-1. The BAL turns on and off over 700 kms-1. The feature bisecting the BAL at 6232 Å corresponds to no known emission line, and is probably just a gap in the velocity structure. The mean depth of the BAL is 0.35 times the intensity of the continuum. BALs are usually saturated (Hamann, Korista & Morris 1993), so the observed depth implies a covering factor of 0.35. The observed spectrum is consistent with similar covering factor in NV and SiIV.
The BAL is not detected in absorption in the AlIII (1855, 1863 Å) doublet, expected wavelengths 7373 - 7590 Å, (Fig. 4), suggesting that the quasar is a HiBAL (but see Section 4).
3.5 Narrow CIV absorption features (NALs)
In addition to the absorbers discussed above, 9 CIV NALs are detected (Table 4).
The CIV lines of absorbers 15 and 16 are deep, and have small velocities relative to the quasar ( -1000 kms-1). They are thus likely to be physically associated with the quasar. Absorber 16 is slightly redshifted relative to the emission-line redshift of the quasar, but by only one standard deviation. Both absorbers are resolved in velocity. The residual intensities in the blue and red components are consistent with covering factor = 1 (Fig. 11), and moderate optical depth. The Ly lines of both absorbers are saturated, with rest-frame equivalent width 0.8 Å, implying (HI) 1018 cm-2. The Ly lines are probably detected (Fig. 10), but are confused by the OVI mini-BAL. The Lyman limits for these two absorbers would fall at wavelengths 3981 and 3995 Å. The SDSS spectrum shows zero intensity below 3980 Å, so absorber 15 may be a Lyman-limit system (LLS, log (HI) 17.2).
The remaining narrow CIV lines (1 – 7), with -5000 km/s, are likely to be intervening absorbers, physically unrelated to the quasar. Misawa et al (2002) measured the number density per unit redshift, , of intervening CIV absorbers. Combining their results with those of Steidel (1990), the mean = 2 1 at 3, for rest-frame equivalent width 0.15 Å in both components of the doublet. For 1624+3758, we find three CIV doublets satisfying these criteria (absorbers 1, 2, 7) over a redshift range 0.7, i.e. 4.3 2 per unit redshift, not significantly different from that found by Misawa et al, and Steidel (and contrasting with the much higher = 7 found for 0747+2739 Richards et al 2002a). Of the absorbers noted here, 4, 6 and 7 are slightly resolved in velocity (Table 3), consistent with the internal velocity dispersions typical of normal galaxies, 50 kms-1. The rms errors on the equivalent widths in the blue and red components of each doublet (absorbers 1 – 7) are large, but the measurements are consistent with covering factor = 1, as expected for absorbers whose physical dimensions greatly exceed those of the emitting region.
Most of the NALs are detected in Ly, and several in Ly (Figs. 5, 10). None of the NALs are detected in absorption by OI (1302.17 Å), SiII (1526.71 Å), FeII (1608.45 Å), AlII (1670.79 Å) or AlIII (1854.72 Å).
4 The nature of 1624+3758
The lack of detectable BAL absorption in the AlIII doublet (Section 3.4) suggests that the quasar is a HiBAL, but the observed spectrum does not extend to MgII 2800 Å, so it could also be an atypical LoBAL with weak AlIII absorption. The OI equivalent width, and the presence of FeII/FeIII emission (Section 3.1) are typical of LoBALs, as is the continuum colour (although this also falls within the range of colours of HiBALs). The frequency of LoBALs amongst radio BAL quasars appears to be higher 30% (Becker et al 2000, 2001, Menou et al 2001), than amongst non-radio BAL quasars, 15%.
Regardless of whether the quasar is a HiBAL or a LoBAL, the FeII UV191 triplet emission line at 1787 Å (and FeIII at 1896/1914 Å) is unusually strong (Section 3.1). The association of unusually high radio luminosity (Section 1.2) and unusually strong FeII emission suggests a connection between the two. Such a connection is also suggested by the fact that the 1787-Å line is detectable in only 1 out of 40 SDSS BAL quasars with no FIRST counterparts, but in 4 out of 14 of the SDSS BAL quasars with 1 mJy (Section 3.1). Boroson (2002) and Lamy & Hutsemekers (2004) note that strong FeII emission might be a signature of the thickening of the accretion disk at accretion rates close to the Eddington limit, 1. Although the intensity of this ‘small blue bump’ FeII emission might not always be proportional to that of the FeII 1787 Å line (Vestergaard & Wilkes 2001), it’s plausible that the unusually strong FeII 1787-Å emission in 1624+3758 is related to the very high accretion rates posited for radio BAL quasars (Boroson 2002).
The detachment of the BAL by 21000 kms-1 from the CIV emission line is moderately unusual, being observed in 10% of BAL quasars with either 3 or 3. It suggests an angle of view well away from the plane of the accretion disk, so that the line of sight to the quasar nucleus exits the curving streamlines far above the disk (see fig. 8 of Lamy & Hutsemekers 2004).
The radio rotation measure of 1624+3758 is the second-largest known. It is due to the properties of gas lying between us and the radio-emitting region (size 1 kpc), and is unlikely to depend strongly on orientation. It implies a high value of at least one of the magnetic field, electron density or path length through the region responsible.
In summary, the observed properties of the quasar are more consistent with it being intrinsically unusual than with it being viewed at an unusual orientation. 1624+3758 is highly radio-luminous, and it may be a good example of an object which is accreting both at a very high rate (high ) and near the Eddington limit.
5 Conclusions
We report high-resolution spectroscopy and radio observations of the BAL quasar 1624+3758, = 3.377. 1624+3758 is the most radio-luminous BAL quasar known, = 4.31027 WHz-1. It is also highly luminous in the optical, (1450-Å) -27.6, luminosity 51024 WHz-1.
(1) The FeII UV191 1787-Å emission triplet is unusually prominent, rest-frame = 3.8 Å. FeIII UV34 1896/1914 Å is also detected.
(2) The BAL has BALnicity index = 2990 kms-1, outflow velocity -21000 – -29000 kms-1. The large detachment velocity suggests an angle of view well away from the plane of the accretion disk.
(3) A complex mini-BAL is detected in CIV, NV and OVI, with velocity -2200 – -3400 kms-1. For CIV, we have measured the covering factor and optical depth as a function of velocity -2300 – -2700 kms-1. The shape of the absorption is dominated by the variation with velocity of covering factor. This variation implies that the mini-BAL is intrinsic to the quasar.
(4) There is statistical evidence of line-locking between 2 (and perhaps 3) of the mini-BAL absorption components, supporting the hypothesis that the outflows are accelerated by radiation pressure.
(5) A possible non-black HI absorber is observed with velocity -1870 kms-1, (HI) = 4 1018 cm-2 (LLS). There are no associated metal lines. The covering factor is only 0.7, suggesting that the absorber is intrinsic to the quasar, perhaps covering the continuum source, but not the broad-line region.
(6) The velocities relative to the quasar of two of the CIV NALs are small (-824, 206 kms-1). They are likely to be intrinsic. The other 7 NALs ( -5000 kms-1) are probably intervening systems. The number density of CIV absorbers with -5000 kms-1, and rest-frame equivalent width 0.15 Å, is = 4.3 2, consistent with that measured for other quasars.
(7) The wings of the CIV and NV emission lines are markedly asymmetric, consistent with the red wings being suppressed, perhaps due to dust extinction of light emitted by gas outflows on the far side of the nucleus.
(8) The width of the CIV emission line, in conjunction with the optical luminosity , implies a black-hole mass 109 , and 2.
(9) The radio spectrum turns over at rest-frame 2 GHz, suggestive of a young compact source. The source is slightly resolved by the VLA observation, projected size 2.8 kpc.
(10) The radio source is 11% polarised at 10 GHz, and the rest-frame rotation measure, 18350 rad m-2 is the second-highest known for any extragalactic source.
(11) The conjunction of several unusual features, particularly the strong FeII 1787-Å emission, and the high radio rotation measure, favour the quasar being intrinsically unusual rather than being viewed at an unusual orientation. Given the high radio luminosity, the unusual features may be due to a combination of a very high accretion rate and high , i.e. this quasar may occupy an extreme position in Boroson’s (2002) classification scheme for AGN.
Acknowledgments
We are grateful to Pierre Leisy for obtaining one of the spectra
during WHT service time,
to Marek Jamrozy for making the Effelsberg observations, and
to the anonymous referee for helpful suggestions.
CRB, RC, MV and JIGS acknowledge financial support from the
Spanish Ministerio de Ciencia y Tecnología under project
AYA2002-03326.
The William Herschel Telescope is operated on the island of La Palma
by the Isaac Newton Group in the Spanish Observatorio del Roque de
Los Muchachos of the Instituto de Astrofisica de Canarias.
The 100-m Effelsberg radio telescope is operated by the Max Planck Institut
für Radioastronomie.
The National Radio Astronomy Observatory is operated by Associated
Universities, Inc., under cooperative agreement with the National Science
Foundation.
The Westerbork Synthesis Radio Telescope (WSRT) is operated by the Netherlands
Foundation for Research in Astronomy (ASTRON) with financial support of the
Netherlands Organization for Scientific Research (NWO).
The Two Micron All Sky Survey
is a joint project of the University of Massachusetts and the Infrared
Processing and Analysis Center / California Institute of Technology, funded by
NASA and the NSF.
The Sloan Digital Sky Survey is funded by the Alfred P. Sloan foundation,
the SDSS member institutions, NASA, NSF, the US Dept. Energy,
the Japanese Monbukagakusho and the Max Planck Society.
References
- [1] Abazajian K. et al, astro-ph/0410239
- [2] Arav N., Becker R.H., Laurent-Muehleisen S.A., Gregg M.D., White R.L., Brotherton M.S., de Kool M., 1999, ApJ, 524, 566
- [3] Arav N. et al, 2001, ApJ, 561, 118
- [4] Arav N., Korista K.T., de Kool M., 2002, ApJ, 566, 699
- [5] Baars J.W.M., Genzel R., Pauliny-Toth I.I.K., Witzel A., 1977, A&A, 61, 99
- [6] Barlow T.A., Hamann F., Sargent W.L.W., 1997, in “Mass Ejection from Active Galactic Nuclei”; (ASP Conference Series vol. 128, ed. N. Arav; I. Shlosman, R.J. Weymann) p.13
- [7] Barlow T.A., Sargent W.L.W., 1997, AJ, 113, 136
- [8] Becker R.H., White R.L., Gregg M.D., Brotherton M.S., Laurent-Muehleisen S.A., Arav N., 2000, ApJ, 538, 72
- [9] Becker R.H. et al, 2001, ApJS, 135, 227
- [10] Benn C.R., Vigotti M., Pedani M., Holt J., Mack K.-H., Curran R., Sánchez S.F., 2002, MNRAS, 329, 221
- [11] Blustin A.J., Page M.J., Fuerst S.V., Branduardi-Raymont G., Ashton C.E., 2004, astro-ph/0411297
- [12] Boroson T., 2002, ApJ, 565, 78
- [13] Boroson T., Meyers K.A., 1992, ApJ, 397, 442
- [14] Briggs F.H., Turnshek D.A., Wolfe A.M., 1984, ApJ, 287, 549
- [15] Brotherton M.S., van Breugel W., Smith R.J., Boyle B.J., Shanks T., Croom S.M., Miller L., Becker R.H., 1998, ApJ, 505, L7
- [16] Brotherton M.S., Croom S.M., De Breuck C., Becker R.H., Gregg M.D., 2002, AJ, 124, 2575
- [17] Churchill C.W., Schneider D.P., Schmidt M., Gunn J.E., 1999, AJ, 117, 2573
- [18] Condon J.J., Cotton W.D., Greisen E.W., Yin Q.F., Perley R.A., Taylor G.B., Broderick J.J., 1998, AJ, 115, 1693
- [19] Crenshaw D.M., Kraemer S.B., George I.M., 2002, “Mass outflow in AGN: new perspectives” (ASP conference Series vol. 255)
- [20] Cutri R.M. et al, 2003, CDS/ADC collection of electronic catalogues, 2246
- [21] de Kool M., 1997, in “Mass Ejection from Active Galactic Nuclei”; (ASP Conference Series vol. 128, ed. N. Arav; I. Shlosman, R.J. Weymann) p.233
- [22] de Kool M., Arav N., Becker R.H., Gregg M.D., White R.L., Laurent-Muehleisen S.A., Price T., Korista K.T., 2001, ApJ, 548, 609
- [23] D’Odorico V., Cristiani S., Romano D., Granato G.L., Danese L., 2004, MNRAS, 351, 976
- [24] Elvis M., 2000, ApJ, 545, 63
- [25] Fabian A.C., 1999, MNRAS, 308, L39
- [26] Foltz C.B., Weymann R.J., Morris S.L., Turnshek D.A., 1987, ApJ, 317, 450
- [27] Ganguly R., Eracleous M., Charlton J.C., Churchill C.W., 1999, AJ, 117, 2594
- [28] Ganguly R., Masiero J., Charlton J.C., Sembach K.R., 2003, ApJ, 598, 922
- [29] Gaskell C.M., 1982, ApJ, 263, 79
- [30] Gregg M.D., Becker R.H., Brotherton M.S., Laurent-Muehleisen S.A., Lacy M., White R.L., 2000, ApJ, 544, 142
- [31] Grevesse N., Anders E., 1989, in AIP Conf. Proc. 183, Cosmic Abundances of matter (ed. C.I. Waddington) (New York: AIP), p1
- [32] Gupta N., Srianand R., Petitjean P., Ledoux C., 2003, A&A, 406, 65
- [33] Hall P.B. et al, 2002, ApJS, 141, 267
- [34] Hall P.B., Hutsemekers D., Anderson S.F., Brinkmann J., Fan X., Schneider P., York D.G., 2003, 593, 189
- [35] Hamann F., 1997, ApJS, 109, 279
- [36] Hamann F., Korista K.T., Morris S.L., 1993, ApJ, 415, 541
- [37] Hamann F., Barlow T.A., Junkkarinen V., Burbidge E.M. 1997, ApJ, 478, 80
- [38] Hamann F., Sabra B., 2004 in “AGN physics with the Sloan Digital Sky Survey” (eds. G.T. Richards, P.B. Hall), ASP conf. series 311, 203
- [39] Hartig G.F., Baldwin J.A., 1986, ApJ, 302, 64
- [40] Hewett P.C., Foltz C.B., 2003, AJ, 125, 1784
- [41] Holt J., Benn C.R., Vigotti M., Pedani M., Carballo R., Gonzalez-Serrano J.I., Mack K.-H., Garcia B., 2004, MNRAS, 348, 857
- [42] Hutsemékers D., Hall P.B., Brinkmann J., 2004, A&A, 415, 77
- [43] Jaffe W.J., Perola G.C., 1973, A&A, 26, 423
- [44] Jannuzi B.T. et al, 1996, ApJ, 470, L11
- [45] Kaspi S., Smith P.S., Netzer H., Maoz D., Jannuzi B.T., 2000, ApJ, 533, 631
- [46] Kassim N.E., Lane W.M., Cohen A.S., Lazio T.J.W., Perley R.A., Cotton W.D., Condon J.J., Erickson W.C., 2003, A&AS, 203, 5709
- [47] Kato T., Tabara H., Inoue M., Aizu K., 1987, Nature 329, 223
- [48] Korista K.T., Voit G.M., Morris S.L., Weymann R.J., 1993, ApJS, 88, 357
- [49] Lacy M., Laurent-Muehleisen S.A., Ridgway S.E., Becker R.H., White R.L., 2001, ApJ, 551, L17
- [50] Lamy H., Hutsemekers D., 2004, A&A, 427, 107
- [51] Lanzetta K.M., Wolfe A.M., Turnshek D.A., 1995, ApJ, 440, 435
- [52] Lewis G.F., Chapman S.C., Kuncic Z., 2003, ApJ, 596, L35
- [53] Maiolino R., Oliva E., Ghinassi F., Pedani M., Mannucci F., Mujica R., Juarez Y., 2004, A&A, 420, 889
- [54] Menou K. et al, 2001, ApJ, 561, 645
- [55] Miley G., 1980, ARAA, 18, 165
- [56] Misawa T., Tytler D., Iye M., Storrie-Lombardi L.J., Suzuki N., Wolfe A.M., 2002, AJ, 123, 1847
- [57] Morton D.C., 2003, ApJS, 149, 205
- [58] Murgia M., Fanti C., Fanti R., Gregorini L., Klein U., Mack K.-H., Vigotti M.,1999,A&A 345, 769
- [59] Murray N., Chiang J., Grossman S.A., Voit G.M., 1995, ApJ, 451, 498
- [60] O’Dea C.P., 1998, PASP, 110, 493
- [61] Osterbrock D. E., Fulbright J. P., Martel A.R., Keane M. J., Trager S. C., Basri G., 1996, PASP, 108, 277
- [62] Pacholzcyk A.G., 1970, in ‘Radio Astrophysics’ (publ. Freeman, San Francisco)
- [63] Pei Y.C., 1992, AJ, 395, 130
- [64] Petitjean P, Srianand R., 1999, A&A, 345, 73
- [65] Reichard T.A. et al, 2003a, AJ, 125, 1711
- [66] Reichard T.A. et al, 2003b, AJ, 126, 2594
- [67] Reichard T.A. Richards G.T., Hall P.B., Schneider D.P., 2004, in “AGN physics with the Sloan Digital Sky Survey” (eds. G.T. Richards, P.B. Hall), ASP conf. series 311, 219
- [68] Rengelink R.B., Tang Y., de Bruyn A.G., Miley G.K., Bremer M.N., Röttgering H.J.A., Bremer M.A.R., 1997, A&AS, 124, 259
- [69] Richards G.T., Gregg M.D., Becker R.H., White R.L., 2002a, ApJ, 567, L13
- [70] Richards G.T., vanden Berk D.E., Reichard T.A., Hall P.B., Schneider D.P., SubbaRao M., Thakar A.R., York D.G., 2002b, AJ, 124, 1
- [71] Savage B.D., Sembach K.R., 1991, ApJ, 379, 245
- [72] Silk J., Rees M.J., 1998, A&A, 331, L1
- [73] Srianand R., Petitjean P., 2000, A&A, 357, 414
- [74] Srianand R., Petitjean P., 2001, A&A, 373, 816
- [75] Srianand R., Petitjean P., Ledoux C., Hazard C., 2002, MNRAS, 336, 753
- [76] Steidel C.C., 1990, ApJS, 72, 1
- [77] Stocke J., Morris S.L., Weymann R.J., Foltz C.B., 1992, ApJ, 396, 487
- [78] Tolea A., Krolik J.H., Tsvetanov Z., 2002, ApJ, 578, L31
- [79] Tytler D., Fan X.-M., 1992, ApJS, 79, 1
- [80] Vanden Berk D.E. et al, 2001, AJ, 122, 549
- [81] Verner D.A., Barthel P.D., Tytler D., 1994, A&AS, 108, 287
- [82] Vestergaard M., Wilkes B., 2001, ApJS, 134, 1
- [83] Vigotti M., Gregorini L., Klein U., Mack K.-H., 1999, A&AS, 139, 359
- [84] Vilkovskij E.Y., Irwin M.J., 2001, MNRAS, 321, 4
- [85] Warner C., Hamann F., Dietrich M., 2004, ApJ, 608, 136
- [86] Weymann R.J., Morris S.L., Foltz C.B., Hewett P.C., 1991, ApJ, 373, 23
- [87] White R.L., Becker R.H., Helfand D.J., Gregg M.D., 1997, ApJ, 475, 479
- [88] Willott C., Rawlings S., Grimes J.A., 2003, ApJ, 598, 909
- [89] Wise J.H., Eracleous M., Charlton J.C., Ganguly R., 2004, ApJ, 613, 129
- [90] York D.G. et al, 2000, AJ, 120, 1579
- [91] Zavala R.T., Taylor G.B., 2004, ApJ, 612, 749