A New Wolf-Rayet Star and its Ring Nebula: PCG 11
Abstract
In a search for new Galactic planetary nebulae from our systematic scans of the Anglo-Australian Observatory/United Kingdom Schmidt Telescope (AAO/UKST) H survey of the Southern Galactic Plane, we have identified a Population I Wolf-Rayet star of type WN7h associated with an unusual ring nebula that has a fractured rim. We present imagery in H, the 843-MHz continuum from the Molonglo Observatory Synthesis Telescope (MOST), the mid-infrared from the Midcourse Space Experiment (MSX), and confirmatory optical spectroscopy of the character of the nebula and of its central star. The inner edge of the H shell shows gravitational instabilities with a well-defined wavelength around its complete circumference.
keywords:
stars: Wolf-Rayet - ISM: bubbles - instabilities1 INTRODUCTION
The high-resolution AAO/UKST H Survey of the Southern Galactic plane (Parker & Phillipps 1998) is providing an unprecedented new source of Galactic planetary nebulae (PNe) thanks to the survey’s powerful combination of coverage, resolution and sensitivity (Parker & Phillipps 2003). A systematic visual search of all the survey material together with follow-up spectroscopy of identified PN candidates is now essentially complete and has yielded confirmed new PNe. This work, known as the Macquarie-AAO-Strasbourg H PN project or “MASH” (Parker et al. 2004 and in preparation), has effectively doubled the known population of Galactic PNe as recorded by Acker et al. (1992, 1996). Obvious candidate central stars of these PNe (CSPNs) can be seen only in 10% of these nebulae when the original H and -band matching survey exposures are examined. A systematic search for the hot, blue CSPNs, based on the on-line SuperCOSMOS -band images (Hambly et al. 2001), is under way and should significantly improve this statistic. Planned deep -band imaging would aid further and permit photometric and spectroscopic follow-up of many more candidate CSPNs. Nevertheless, during the 6-year spectro-
scopic follow-up programme, we have also discovered seventeen PNe with central stars that show Wolf-Rayet [WR] emission features. This represents a 30% increase in the previous 56 known such objects listed by Jeffery et al. (1996). A further 14 [WR] CSPN have also been recently reported by Górny et al. (2005) for PN in the Galactic Bulge.
Preliminary details for the first group of the new [WR] CSPN from MASH are documented in a series of papers: Morgan, Parker & Russeil (2001: “PMR 1,2”); Parker & Morgan (2003: “PM 3,4,6,7”); Morgan, Parker & Cohen (2003: “PM 5”). Several other papers are in preparation dealing with most of the remaining sample discovered so far. Almost all the stars are of the late [WC] or early [WC]/[WO] types with no confirmed intermediates. Furthermore, we have discovered PM 5, the sole, bona fide, Galactic PN with a WN central star. The only other confirmed WN CSPN is N66 in the Large Magellanic Cloud (e.g. Pena, 2000). Unlike the previously published [WR] CPSN, many of our new [WR] CSPNs are frequently found to be nitrogen enriched, hinting that some subtle selection effect might be operating. In the present paper we describe a ring nebula of rather unusual structure that was discovered by one of us (QAP) during the search for PNe and originally catalogued as a new PN candidate. Interestingly its central star is also of the nitrogen sequence.
At the nebular location, Vega et al. (1980) find a weak unresolved object (VRMF 61) found from a photographic, objective-prism, H survey. This again neatly indicates the ability of the AAO/UKST H survey to uncover new low surface brightness nebulosities due to its unrivalled combination of sensitivity, resolution and coverage. A 60-m IRAS source (16300-4922) is also listed, with no detections in the other three bands. The central star of the ring is a WR star that we believe is a Population I object rather than a CSPN. In §2 we discuss the morphology of the nebula; in §3 the optical spectra of nebula and star; §4 radio continuum imagery from Molonglo; §5, mid-infrared (MIR) MSX images; §6, 2MASS near-infrared (NIR) images; §7, optical and IR photometry; and in §8 the distance estimates to the nebula and the stellar spectral energy distribution (SED). Our discussion is given in §9 and covers the nature of the nebula and the physical processes that have shaped it.
| MASH data | |
|---|---|
| Nebular centre RA (J2000) | |
| Nebular centre Dec (J2000) | |
| l,b | 335.35∘, 1.14∘ |
| Star RA (J2000) | |
| Star Dec (J2000) | |
| H Survey Field | HA349 |
| H Survey Film | HA18885 |
| Short Red (SR) Survey Film | SR18884 |
| Date of survey images | 2000 July 8 |
| PHR designation | PHR1633-4928 |
| Outer dimensions (arcsec) | 91 77 |
| Literature | |
| IRAS Source | 163004922 |
| 2MASS source number | J16334874-4928439 |
| Parameters derived in this paper | |
| Best fitting circle radius | 363 arcsec |
| Nebular radial velocity (LSR) | 49 km s-1 |
| Distance | 4.10.4 kpc |
| Radius of shell | 0.71 pc |
| Characteristic RT scale of ring | 0.240.02 pc |
| 843-MHz flux density of ring | 47 mJy |
2 The nebula
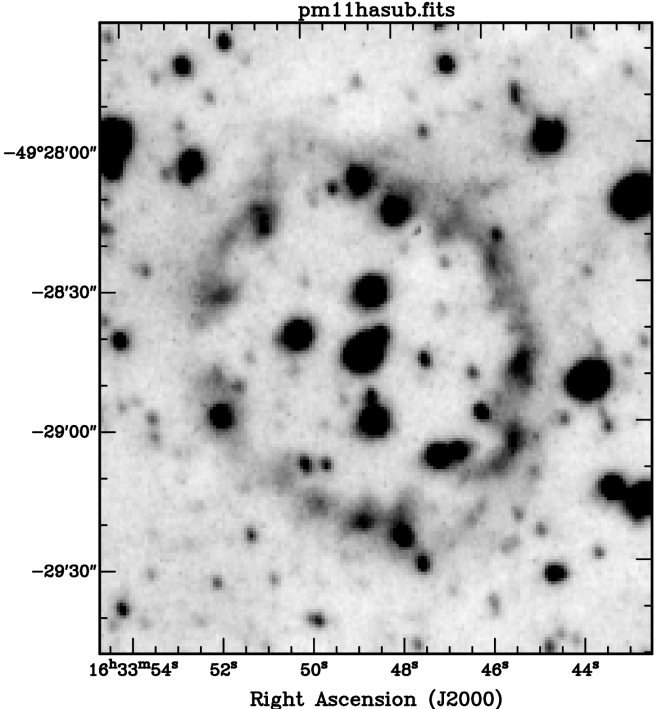
PCG 11, or PHR1633-4928, was identified as a candidate PN during the MASH visual scanning phase, and targeted as a high priority for spectroscopic follow-up due to the unusual morphology of the nebular ring, as illustrated in Figure 1. Table 1 presents parameters for this nebula and its exciting star, separated into results drawn from the MASH survey, from the literature, and derived in this paper. The overall outer dimensions of the nebulae are 91′′ (major axis) by 77′′ (minor axis). The first impression is that the nebula is oval, due primarily to the “blow-outs” to the N-E and S-W of the nebulae lending it a lemon-like overall outer shape. In fact, if these two opposing regions are ignored, its periphery is very closely circular with a radius of 36′′, centred on the coordinates given at the top of Table 1. We identify the exciting star as the bright SE component of the central blend of two stellar images because of its location at the geometric centre of this circle and its WR spectrum (§3). Ansae extend beyond the ring to the north and south where the rim is punctured by a pair of symmetric blow-outs along a diameter through the central star in position angle (PA) 25∘-205∘. A third gap ocurs to the east. Arcuate filaments are seen outside the northwest rim where there is no gap in the ring, but these may be merely part of the general, faint, diffuse background of H emission that extends to the NW for 2 arcmin. The nebular structure is unique when compared with all the extant MASH PNe. A remarkable feature of the ring is the presence of a series of scallops around the inner rim. These have a characteristic angular scale of 121′′ (the weighted average of 18 individual features). These strongly resemble textbook examples of Rayleigh-Taylor (RT) instabilities. Several of these fingers of gas are more obvious than the nebulous rim in general, but are brightened by foreground or background stars (§6). Within the ring there is even less emission (appearing “lighter” in this negative image) than the surrounding interstellar medium (ISM). The dark cloud “DC 328”, from the catalogue by Feitzinger & Stuwe (1984), is centred at l = 335.37∘, b = 1.14∘, very close to the centre of PCG 11, with an area of 1.38 deg2. A powerful stellar wind could have evacuated the inner volume of this presumably ellipsoidal nebula, reducing the projected H emission except at the limb-brightened rim. Alternatively, the dark nebular interior may indicate that its inner volume suffers heavy local extinction due to ISM dust swept up by the stellar wind, or perhaps formed within the wind. If so, a large Balmer decrement might be expected in any internal emission detected.
3 Optical spectroscopy
During the programme of spectroscopic follow-up of MASH PN candidates, long-slit red spectra of the rim and central star of PCG 11 were obtained on the Mount Stromlo & Siding Springs Observatory ANU 2.3 m telescope on 2002 July 8 using the double beam spectrograph with G1200R in the red arm. The spectral range was 6183-6799Å , the exposure was 600s, and the dispersion 0.55Å pixel-1. Instrumental resolution was the FWHM of an arc line, 1.8 pixels, or 1Å. The slit width was 2′′. Wavelength calibration was via a standard Copper-Argon lamp. The spectrum was flux calibrated using observations of LT7987, a spectrophotometric standard star from the list of Stone & Baldwin (1983). Additional spectra were taken on the South African Astronomical Observatory 1.9m telescope, with a 2′ long slit, through both the ring and its central star, on 2002 July 17. The spectral range was 3220-7232Å at a lower dispersion of 2.3Å pixel-1 with grating G300B, and a resolution of 5Å. The exposure was 600s. Wavelength calibration was again via Copper-Argon arc lamp exposures, and flux calibration was achieved through observations of the same standard star LTT6248 taken 15 minutes prior to the target exposure. The slit was set wide () to allow more flux onto the detector for the nebula observations. The reported seeing was 1′′ so most of the flux of the central star should have passed through the slit. The spectra were reduced using standard IRAF routines.
3.1 The nebula
Nebular emission lines from H and the [Nii] lines were detected in three locations around the optical shell but with no hint of other common nebular lines nor of a continuum over the wavelength range covered. The spectrum in Figure 2 obtained with the ANU 2.3m has our best signal-to-noise ratio (SNR) and spectral resolution for the nebula. Barycentric radial velocities were obtained for the three strong lines as follows: H, 36; N1, 43; and N2, 44 km s-1. The weighted mean velocity, corrected to the LSR, is 495 km s-1. Assuming that PCG 11’s radial velocity is due solely to Galactic rotation, one derives a distance of 3.50.3 kpc (Fich, Blitz & Stark 1989; their assumed solar Galactocentric distance is 8.5 kpc). The absence of the red [Sii] doublet argues against an identification as a PN although it would be consistent with WR ring nebulae. In their photographic survey of WR nebulae, Heckathorn, Bruhweiler & Gull (1982) found [Sii] lines either undetected or very faint in 8 of 10 objects associated with single stars of types WN5-8.

3.2 The central star
The two independent lower-resolution stellar spectra of the central star of PCG 11 taken at SAAO were co-added. Figure 3 presents the resulting flux-calibrated spectrum over the complete spectral range, while Figure 4 offers a continuum-subtracted version in which the lines are more readily compared. These spectra are perfectly adequate for line identification but not for the derivation of accurate radial velocities. Our ANU 2.3 m high-resolution spectrum can provide good radial velocities but many of the lines included in its wavelength range are blends. Table 2 summarizes line wavelengths, equivalent widths, and identifications.
We have firmly classified PCG 11 as WN7h using three different approaches. van der Hucht (2001, Table 2) lists descriptive criteria for line strengths, namely that: the 4640 Niii blend 4605,4621 Nv; 4640 Niii Heii 4686; and there is a weak P Cyg profile to the 5876 Hei line. Smith, Shara & Moffat (1996, Table 4a) describe their 3-dimensional classification scheme for WN stars, in which the ratio of 5411 Heii to 5875 Hei is the “primary discriminant of ionization subclass”. They quantify a series of secondary criteria, relying upon the simple ratio of line-peak-above-continuum to continuum as the most useful measure of line strength, and tabulating ratios of these measures for pairs of lines against spectral subtype. For PCG 11: 5411/5875 is 0.78 (WN7); 5808/5875 is 0.27 (WN7); and 5808/5411 is 0.33 (WN7 or 8); 4057 of Niv is too weak to measure; and 4605 of Nv cannot be separated adequately from 4621 in our spectrum. All these ratios indicate a WN7 star. Direct comparisons have been made of PCG 11’s spectrum with the spectra of Population I WR stars presented both by Smith et al. (1996) (as far as 6000Å) and by Vreux et al. (1989) at longer wavelengths. We have focused on the appearance and relative line strengths of the 5801-12 Civ and 5876 Hei features, and of the trio of the 7065 Hei, 7103-28 Niv, and Heii 7177 lines. All unequivocally suggest that PCG 11’s exciting star is most similar to a WN7. On the basis of the presence of H in the spectrum (according to the criteria of Smith et al. (1996), who compare the heights of lines due to H+He with a line connecting pure HeII peaks), we assign the type WN7h.
Several unblended lines show P Cyg absorption features from the WR stellar wind, namely 5876Å Hei, 5411Å Heii, and 5801Å Civ lines. However, only the Hei line represents the true wind velocity (the other lines are formed in the inner WR wind). From our high-resolution red spectrum we have measured the velocity for the 5876Å line, vedge, defined by Prinja, Barlow & Howarth (1990) as the transition from stellar continuum to the beginning of the P Cyg absorption. This is LSR), so the central star of PCG 11 has v. Van der Hucht (2001, Table 15) compiles estimates of terminal velocity for all the Galactic WR stars in the Seventh Catalogue. The average terminal velocity for the six WN7 stars in his table, without spectroscopic evidence of binarity, is 1300100 km s-1 (standard error of the mean). Therefore, PCG 11’s wind velocity is consistent with a Population I WN7 star.


| observed | EW | Identification |
| (Å) | (Å) | Ion, air wavelength (Å) |
| 4610 | 2.9 | Nv 4605.0,4621.3 |
| 4634-41 | 36 | Niii 4634.2,4640.6,4641.2 |
| 4686 | 42 | Heii 4687.0 |
| 4864 | 15 | Niii 4858.7,4867.2; Heii 4859.3; |
| Niv 4867.2 | ||
| 5412 | 16 | Heii 5411.2 |
| 5801,12 | 2.0 | Civ 5801,12 |
| 5876 | 9.1 | Hei 5875.6 |
| 6219 | 3.5 | Niv 6219 |
| 6239 | 2.0 | Heii 6234? |
| 6311 | 1.8 | Heii 6310.8 |
| 6409 | 3.3 | Heii 6406.? |
| 6450-80 blend | 3.6 | Niii 6450,60;+? |
| 6527 | 1.9 | Niv 6527.8 |
| 6562 | 58 | Heii 6560.1; Hi 6562.80 |
| 6678 | 13 | Hei 6678.1; Niv 6678 |
| 6892 | 0.9 | Heii 6890 |
| 7063 | 12 | Hei 7065.20 |
| 7100-7130 | 33 | Niv 71037128 |
| 7177 | 4.5 | Heii 7177.52 |
4 Molonglo radio continuum images
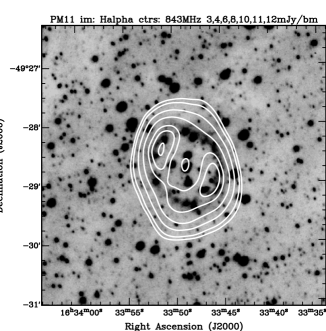
Three independent images are available from the Molonglo Galactic Plane Surveys (MGPS1, MGPS2: Green et al. 1999; Green 2002) at 843 MHz: from MGPS1 on 1989 May 15; and from MGPS2 on 2000 August 17 and 22. The r.m.s. noise in each image is 3.0, 1.5, and 2.0 mJy beam-1, respectively. We used the task imcomb in miriad to combine the three images using inverse-variance weighting. The resultant image appears in the form of white contours overlaid on the H image in Figure 5. The noise in the combined image is 1.0 mJy beam-1.
There are twin peaks in the radio map on the northeast and southwest rims of the H ring, both with values of 12 mJy beam-1. The emission falls at the middle of the image to a local minimum of 8 mJy beam-1 at the location of the central star. The MGPS beam size is 43′′ (in RA) by 56′′ (in DEC). Given the angular resolution, we can conclude only that the radio continuum emission is resolved and appears to be associated with the H rim with two peaks, diametrically opposed on the ring, and likely not aligned with the brightest sections of the H ring. The spatial integration of the combined MGPS image yields a total flux density of 47 mJy (corrected for the local background). The total integrated radio continuum flux densities of well-known, previously studied WR ring nebulae lie between 2.6 and 11 Jy (Johnson & Hogg 1965; Wendker et al. 1975; Cappa, Goss & Pineault 2002). If we compute 1.4-GHz luminosities for WR ring nebulae (4 distance2 S(1.4-GHz)) from the literature these average W Hz-1 (NGC 6888, 1.26 kpc; NGC 2359, 3.67 kpc; WR 101, 3.18 kpc; WR 113, 1.79 kpc; all distances are taken from van der Hucht (2001, Table 28)). The corresponding figure for PCG 11 is W Hz-1, some 40 times smaller. This suggests that PCG 11 is more distant than the 1.3-3.7 kpc of these previously known Galactic WR ring nebulae, and/or that the mass loss rate of its exciting star is substantially below those of WR stars associated with such nebulae. Unfortunately, the NRAO VLA Sky Survey (NVSS) has a southern declination limit of 40∘ while the Southern Galactic Plane Survey (SGPS) has a Galactic latitude limit of 1.0∘ for its continuum data. In the Parkes-MIT-NRAO (PMN) Surveys, PCG 11 can be identified as a local peak on a ridge of bright emission in PMN 4850-MHz images but the source is so weak against this confusion that it was excluded from the point source catalogue of the Southern Survey (declination to ).
5 Mid-infrared images from the Midcourse Space eXperiment (MSX)
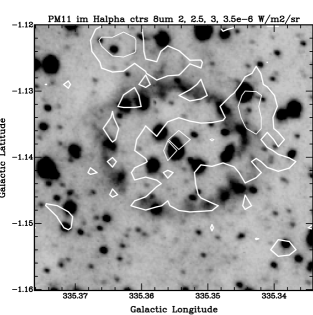
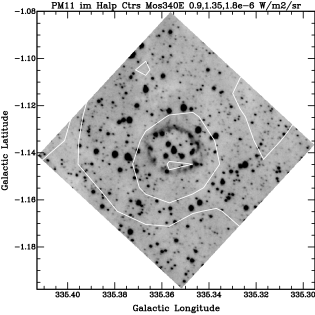
The MSX images of the Galactic Plane with 6′′ pixels and 20′′ resolution (Price et al. 2001) show detections of the central star at 8.3 m, and of the adjacent star (seen in the H image: Figure 1) at 8.3 and 12.1 m. Weak diffuse MSX 8.3-m and 12-m emission are found in this area and most of the interior and rim of the nebula are detected at 8.3 m (Figure 6). At 21.3 m four diffuse patches are detected around the nebular rim, all at the 4 level. Examination of the low-resolution MSX mosaic products with 36′′ pixels and 72′′ resolution discloses diffuse emission covering PCG 11’s whole ring at 8.3, 14.6, and 21.3 m. The 21.3-m mosaic image (Figure 7) essentially mimics the Sky Survey Atlas (ISSA) image at 25 m, but at higher spatial resolution.
Spatial integrations of the 8.3-m emission associated with PCG 11’s ring indicate 0.80.1 Jy (Fig. 6) and 0.850.2 mJy (from the MSX deep mosaic image), each corrected for local background emission.
6 2MASS images
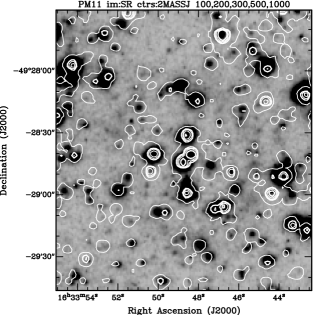
The 2MASS images in , , and were extracted and overlaid on both the H image and the matching Short Red (SR) exposure. There are no signs of diffuse NIR emission associated with the rim of the H oval. Hints of the nebulous ring are seen in the SR image where it is easier to distinguish faint stars from H nebulosities. Of particular interest is whether any of the Rayleigh-Taylor-like fingers of H nebulosity emit in the NIR, but the low latitude of PCG 11 means there are many field stars projected against the rim. We have superimposed the 2MASS image as white contours on the SR exposure of PCG 11 (Figure 8). All the seeming NIR detections of the nebular rim can be identified with faint stars in the SR image (the same is true for the and band images). We conclude that none of the H fingers of gas is detected by 2MASS, eliminating the possibility of significant shock emission in the [Feii] 1.64-m in the -band, and both the Br and H2 S1 1-0 2.12-m lines in the -band.
7 Optical and infrared photometry
SuperCOSMOS photometry is available on-line for PCG 11 from digitizations of the broadband UKST , , , ESO , and the H and associated SR images. The faint companion is not deblended into a separate object in any of these photometric parameterizations. Rather similar photometry can be formed from magnitudes for PCG 11 from the USNO-B1.0 archives (Monet et al. 2003: the star identifier is 0405-0535599) although we prefer the SuperCOSMOS data because of its direct traceability to CCD calibrations from field to field, that assures consistency of photometry. Vega et al. (1980) report a magnitude from a photographic plate which surely refers to both stars because these would have been unresolved at their plate scale. The SuperCOSMOS is considered unreliable (the IV-N emulsion used for this band is hypersensitised with liquid silver nitrate solution often resulting in gross background variations) as the companion brightens with wavelength, while the SuperCOSMOS will be most accurate as the companion has a negligible influence on the blend. For the magnitudes, the faint companion is , and affects the photometry very little, but the strong red emission lines contaminate the bandpasses. Consequently, we are left solely with the UKST point to compare with the calibrated SED. This point lies approximately 15% below the spectrum, or 0.15m, equal to the the expected 1 uncertainty on the UKST photographic plate. This precludes any substantial miscalibration of the SED of the central star of PCG 11. We plan to pursue multi-colour CCD photometry at higher angular resolution for this source to refine the photometry and demarcation between the close stellar companions at the centre.
Table 3 summarizes our SuperCOSMOS photometry for the central star of PCG 11 together with 2MASS , and the MSX detections obtained by aperture photometry from the images. There is excellent agreement between our optically determined positions for both the central star and its companion and those measured by 2MASS. The average position for the central star is (J2000) (Table 1), and for the companion is .
Thus, the star adjacent to the exciting star of PCG 11 is both redder and brighter in the NIR and MIR than the exciting star itself. It is even detected by MSX at 12.1 m as well as at 8.3 m, while PCG 11’s central star is not. Nonetheless, the companion lies 5.4′′ away from the WR star and is offset from the ring’s centre, making it unlikely to be responsible for the nebula. One can match this star’s NIR colors and magnitudes to either an M-giant or an O-rich AGB star, with an estimated distance of 2.4 kpc and extinction, AV of 5.80.4. With these properties it represents a chance projection along our line-of-sight to the WR star.
The Point Source Catalog contains a 60-m-only object at the location of PCG 11. does detect emission from the relevant ISSA field, but securely only at 25 and 60 m. This information appears in Table 3, in the central star section, although the companion could also contribute to this FIR emission if it possessed a cool, detached, circumstellar dust envelope.
8 Distance to PCG 11
The stellar coadded spectrum is validated by the magnitude; i.e. essentially all the stellar flux passed into the 2.4′′ slit. Synthetic photometry derived from the spectrum gives =17.72, =15.80, in the nomenclature of the narrowband, line-free, optical magnitudes devised by Westerlund (1966) and Smith (1968a,b). The observed of 1.92 together with an intrinsic index of 0.18 (van der Hucht 2001), indicates an extinction, A (equivalent to A). A more precise estimate of AV comes from dereddening our spectrum of PCG 11’s central star to match the optical slope of the modeled SED for a single WN7h star (HD 151932), kindly provided by Crowther(2005). We settled on the range 4500-7200Å to avoid the high noise at the blue end of our spectrum) and carried out formal fitting for a variety of different extinctions. This suggests Av = or AV = (see Figure 9). We adopt these values as more robust than depending on synthesized and , and on an average intrinsic . There is no difference between the mean Mv of 3 binary WN7h stars () and the only single WN7h star () (van der Hucht 2001, Table 25) which are associated with OB associations at known distances. Therefore, we take Mv= for all WN7h stars. This yields a photometric distance to PCG 11 of kpc. Using inverse-variance weighting we combine the photometric distance estimate with that based on the nebular radial velocity (§3.1) to obtain kpc, which we adopt hereafter.
Out to distances of 2 and 3 kpc from the sun, in the Galactic direction of PCG 11 in the plane, one expects a total interstellar extinction of 3m (Fitzgerald (1968: Fig. 3(j), zone 68); Lucke (1978: Fig. 6)). From the upper limit to the H line in our high-resolution nebular spectra ( erg cm-2 s-1) we obtain an intensity ratio of H/H , compared with Case-B recombination at Te104 K of 2.86, so the total extinction to PCG 11’s rim is . Using the extinction maps of Schlegel, Finkbeiner, & Davis (1998), the total Galactic extinction along the line-of-sight through PCG 11 is AV 12m. Distributing this evenly along the line-of-sight suggests that at least 3m occurs in front of PCG 11. The most direct estimate of the line-of-sight nebular extinction comes from comparing the predicted and observed H fluxes from PCG 11. The thermal radio emission provides an estimate of the intrinsic emission line flux in H (see Condon (1992), eqns. (3) and (4a)). Using this formulation predicts 3.7 erg cm-2 s-1 for the integrated intrinsic H flux, before the effects of extinction. We estimate the observed, spatially integrated H line flux of PCG 11 from the absolutely calibrated, but spatially much lower-resolution, Southern H Sky Survey Atlas (SHASSA: Gaustad et al. 2001). At PCG ’s location this survey shows 122 Rayleighs, equivalent to 10-12 erg cm-2 s-1). The SHASSA H filter also includes the red [Nii] lines. We have corrected for these based on the profile of the SHASSA filter shown by Gaustad et al. (2001) and on our spectrum of PCG 11’s nebula (Figure 2). The corrected SHASSA H line flux is then 10-12 erg cm-2 s-1. The ratio of observed to predicted line fluxes indicates AV = 4.6 magnitudes, including estimated uncertainties. We adopt this as the most reliable estimate of the line-of-sight extinction between the Sun and PCG 11. Comparing with the stellar reddening nebular Balmer decrement (above) we find unaccounted for extinctions of toward the central star, and toward the nebular rim. The roughly we attribute to the shell of swept up ISM surrounding PCG 11. This would explain why the interior of the nebula has so little emission compared with the environs of PCG 11 (Fig. 1).

The resulting dereddened spectrum follows the Crowther model as far as the limit of our optical spectra (Fig. 9), after which it declines more rapidly than the model SED. PCG 11’s smaller IR free-free emission implies a lower mass loss rate than that of HD 151932 which is 6.610-5 M⊙ yr-1, assuming a homogeneous shell (Crowther 2005). Typical values for WN7 stars are M⊙ yr-1 (Leitherer, Chapman & Koribalski 1995; Prinja et al. 1990). A rough estimate can be made for the mass loss rate of PCG 11’s star based on the excess 8.3-m flux density above the stellar photosphere. Allowing for a Rayleigh-Jeans contribution of the hot photosphere at 8.3 m, the excess, dereddened (for AV=8.1m), flux density at this wavelength is 15 mJy. We assume that this emission is entirely due to free-free emission. The mass loss rate (Wright & Barlow 1975) would be M⊙ yr-1 (with MIR Gaunt factor from Beckert et al. (2000), and mean molecular weight, ionic charge, and number of electrons per ion for a WN7 star from Barlow, Smith & Willis (1981)). The error is dominated by the uncertainty in the photospheric level, with a component from the error in extinction correction. No corresponding estimate of stellar mass loss is possible from the 843-MHz radio continuum because this is resolved and comes from the nebula at large, not just the central star.
9 Discussion
The emission-line spectrum of PCG 11 marks it as a WN7h star. At a distance of 4.1 kpc it lies 80 pc below the plane. This is in accord with the distribution of Galactic WR stars (van der Hucht 2001, Fig. 8), their mean absolute z-distance (49 pc: van der Hucht 2001), and the 45-pc scale height of WRs (Conti & Vacca (1990) and of OB stars (Garmany et al. 1982). From the N-richness of PCG 11’s central star and this apparent kinship with massive stars we conclude that PCG 11 is not a PN but rather a Population I WR ring nebula. Are other properties of this nebula in accord with this classification?
Two classical ring nebulae associated with Population I WN stars are NGC 2359 (HD 56925: WN4) and NGC 6888 (HD 192163: WN6(h)), and both were first studied in the radio continuum by Johnson & Hogg (1965). Their single-dish measurements indicated a thermal radio spectrum. This result was confirmed by Wendker et al. (1975) using the Effelsberg 100-m dish and aperture synthesis at three frequencies. Wendker et al. also commented on the close agreement between the H and radio continuum morphologies. Furthermore, thermal spectra were derived for two ring nebulae around WC8 stars (WR 101 and 113) by Cappa et al. (2002), who compared spatially integrated 1.465-GHz VLA flux densities with those from the 4.85-GHz survey by Haynes, Caswell & Simons (1978).
Although PCG 11 has only a single radio continuum measurement (from the MGPS), Cohen & Green (2001) have calibrated the ratio of the spatially integrated 8.3-m and MGPS 843-MHz flux densities for a wide range of thermal and nonthermal structures in their study of the ISM near l=312∘. These authors found a characteristic ratio of flux densities with a median of 24 for thermal sources, and 3 for nonthermal. We have calculated this ratio for PCG 11’s ring using both the 6′′ pixellated MSX image and the coarser resolution but deeper mosaic image at 8.3 m against the 843-MHz flux. The ratio is 19, confirming that this emission is thermal in nature.
Spatial integration of the identical area of the ring from the 8.3, 14.6, and 21.3-m mosaic images yields flux densities at three wavelengths of 0.85, 5.5, and 11.0 Jy, respectively. Combining these with the 60-m flux density of 14.6 Jy (because the beam is large enough to accommodate the entire ring), leads to an SED well fitted by a 170 K blackbody at the three longest wavelengths. At 8.3 m the blackbody accounts for only about 60% of the observed emission. But we expect the diffuse ISM to contribute significant flux in the 8.3-m bandpass due to polycylic aromatic hydrocarbon (PAH) emissions at 6.2, 7.7 and 8.7 m, elevating and perhaps overcorrecting for sky emission in our off-source locations. Mathis et al. (1992) analyzed the IRAS emission from three WR ring nebulae. They interpreted the low levels of 12-m emission to imply that the dominant mechanism was continuum radiation from dust grains, rather than PAH emission bands. Thermal dust emission also characterizes these nebulae at 25, 60, and 100 m but, to explain the brightness at 25 m, Mathis et al. (1992) argued for transient heating of small grains in excess of 100 K. Our 170 K derived color temperature between 14.6, 21.3 and 60 m in PCG 11 would be consistent with transiently heated small grains. The weakness of the 8.3-m emission detected in PCG 11 (Fig. 6) also suggests the absence of PAH emission, probably due to destruction by the WR star’s wind.
Following Mezger & Henderson (1967, Appendix A, equations A.12, A.13, and A.14), the observed radio flux density can be converted into the mean density and mass of an ionized nebula. Deconvolving the 843-MHz image (Fig. 5) leads to an average full power width (FPW) of 1.6′. Adopting the simplest model of a uniformly filled sphere to represent PCG 11, we derive an equivalent Gaussian FPW 1.1′ that can be used in the formulation of Mezger & Henderson. For an electron temperature of 104 K, the 843-MHz flux density indicates ionized mass of 4.2 M⊙. To inject this much ionized matter into the ISM with the mass loss rate typical of a WN7 star (cited above) would have taken 100,000 yr. McCray (1983, Table 1) summarizes the properties that characterize WR ring nebulae as radii 0.310 pc, ages 20,000-200,000 yr, and shell masses 5-20 M⊙. PCG 11, therefore, presents a consistent picture as a small WR ring nebula.
The total mass (neutral and ionized) of the ISM outside the H shell is constrained by the need to produce the additional extinction, local to the nebula, of (§8). The column density in Hi would be H cm-2, above a shell of radius 0.71 pc. The total mass required is 200 M⊙, quite acceptable for a WR shell (e.g. Chu 1982). It is clear that the accumulated ISM mass dominates the ejecta from the red supergiant precursor of the WN7 star, and that only a small fraction of the matter is ionized. Diffuse 21.3-m emission appears confined to the rim where it is enhanced by limb-brightening (7). In §4 we derived a dust temperature of 170 K from this emission. Assuming that dust and gas are well-coupled at the periphery of the shell, we can assign the same temperature to the gas, leading to a sound speed of 0.7 km s-1.
Scalloping appears around the whole interior of PCG 11 in gas that is a combination of swept up ISM and stellar ejecta. This is sandwiched between shocked ambient gas and an inner contact discontinuity at the interface with the stellar wind. Weaver et al. (1977) demonstrate that RT instability commonly develops in expanding bubbles due to the collapse of this thin boundary. The fastest-growing RT mode dominates the observed structure. From McCray & Kafatos (1987), but neglecting magnetic fields, the scale size of the dominant RT instability is given by 92/(4GRs), with G the gravitational constant, the density of the shocked ISM (1.3 n0 MH), and Rs the shell radius. With as of 0.7 km s-1, a wavelength for the observed structure of 0.24 pc, and a shell radius of 0.71 pc, the shocked ISM density (n0) would be 48000 cm-3. Such a density would explain the absence of [Sii] lines and the presence of [Nii] emission in the rim because it lies between the critical densities of 6731Å of [Sii] and 6584Å of [Nii]. The red [Sii] doublet lines would be quenched. Allowing for the projection of the curved shell and for blurring by seeing, we estimate the thickness of the limb-brightened H-emitting rim of PCG 11 to be . To accommodate the 4.2 M⊙ of ionized gas within this region implies a density of roughly 500 H cm-3. This region is at least partially ionized and for simplicity we take Ni=Ne. The resulting filling factor for ionized gas would thus be 0.02, consistent with the range derived for the nebula around WR113 by Cappa et al. 2002). Once instabilities are established, their growth proceeds with a growth time of 130,000 yr, comparable to the time required to create the bubble (see above).
10 Conclusions
We characterize PCG 11 as a wind-blown bubble generated by a well-centred Population I Wolf-Rayet star of type WN7h. The stellar mass loss rate is much smaller than those of other WR stars in ring nebulae, and the ring is more distant from the Sun than these. Both contribute to PCG 11’s very low radio luminosity. This is proportional to Ṁ4/3 (Wright & Barlow 1975). The factor of 5 between PCG 11’s Ṁ and the average for WN7 stars ( M⊙ yr-1) reduces radio luminosity by almost an order of magnitude. Further reduction may be due to the low filling factor for ionized gas. In producing the almost spherical ionized volume, approximately 200 M⊙ of the ISM was swept up by the advancing shell. Material at the inner boundary of that enveloping material suffers Rayleigh-Taylor instability. This appears as a highly regular scalloping of the inner margin of the nebulous H ring, defined by fingers of infalling ionized matter. There is a very well-defined wavelength for this phenomenon in PCG 11 and it is observed around the entire nebular rim. No PN has the character of PCG 11’s shell. The closest approach might be NGC 6894 which shows two or three large-scale scallops inside its bright rim. However, the outer edge of the rim is distorted, not circular, where these indentations occur and its overall structure may owe more to stripping by the ISM than to gravitational instabilities (Soker & Zucker 1997). Although RT instabilities are known on larger scales (e.g. McClure-Griffiths et al. 2003), PCG 11 is the only example of a complete shell of these instabilities of which we are aware, on any observable spatial scale.
11 Acknowledgments
We thank Mark Wardle, Jessica Chapman, Naomi McClure-Griffiths, and David Frew for valuable discussions. We are grateful to the referee, Paul Crowther, for his extremely useful comments on this paper, and for offering his model energy distribution of a WN7 star. MC thanks NASA for supporting this work under LTSA grant, NAG5-7936, and ADP grant, NNG04GD43G, with UC Berkeley. QAP acknowledges the joint support of the AAO and Macquarie University. The MOST is owned and operated by the School of Physics, within the University of Sydney, and supported by the Australian Research Council and the University of Sydney. We thank ANSTO for the provision of observing support to QAP to enable spectroscopic follow-up. This research made use of the AAO UKST H survey made available to the community on-line from the Wide Field Astronomy Unit at the Royal Observatory Edinburgh. This work also made use of data products from the Midcourse Space Experiment. Processing of the data was funded by the Ballistic Missile Defense Organization with additional support from NASA Office of Space Science. This research has also made use of the NASA/IPAC Infrared Science Archive, which is operated by the Jet Propulsion Laboratory, California Institute of Technology, under contract with the National Aeronautics and Space Administration.
| Waveband | Mag/Flux Density |
|---|---|
| The Central Star | |
| b[synthetic] | 17.72 |
| v[synthetic] | 15.80 |
| 16.30.2 | |
| 12.90.1 | |
| 13.10.1 | |
| MSX F(8.3-m) (mag)[mJy] | 8.60 [21] |
| The companion star | |
| MSX F(8.3-m) (mag) [mJy] | 7.71 [46] |
| MSX F(12.1-m) (mag) [mJy] | 7.84 [19] |
| PCG 11 nebula | |
| MSX F(8m: 6′′ pix) [Jy] | |
| MSX F(8m: 36′′ pix) [Jy] | |
| MSX F(15m: 36′′ pix) [Jy] | |
| MSX F(21m: 36′′ pix) [Jy] | |
| IRAS F(12m) (Jy) | |
| IRAS F(25m) (Jy) | |
| IRAS F(60m) (Jy) | |
| IRAS F(100m) (Jy) |
References
- [] Acker A., Marcout J., Ochsenbein F., 1996, First supplement to the Strasbourg-ESO Catalogue of Galactic Planetary Nebulae, Observatoire de Strasbourg
- [] Barlow, M.J., Smith, L.J., Willis, A.J. 1981, MNRAS, 196, 101
- [] Beckert, T., Duschl, W.J, & Mezger, P.G. 2000, A&A, 356, 1149
- [] Cappa, C.E., Goss, W.M., Pineault, S. 2002, ApJ, 123, 3348
- [] Chu, Y.-H. 1982, ApJ, 254, 578
- [] Cohen, M., Barlow, M.J., Kuhi, L.V. 1975, A&A, 40, 291
- [] Cohen, M., Green, A. 2001, MNRAS, 325, 531
- [] Condon, J.J. 1992, ARA&A, 30, 575
- [] Crowther, P.A. 2005, personal communication
- [] Feitzinger. J.V., Stuwe. J.A. 1984, A&AS, 58, 365
- [] Fich, M., Blitz, L., & Stark, A.A. 1989, ApJ, 342, 272
- [] Fitzgerald, M.P. 1968, AJ, 73, 983
- [] Garmany, C.D., Conti, P.S., Chiosi, C. 1982, ApJ, 263, 777
- [] Gaustad, J.E., McCullough, P.R., Rosing, W., Van Buren, D. 2001, PASP, 113, 1326
- [] Green, A.J., Cram, L.E., Large, M.I., Ye, T. 1999, ApJS, 122, 207
- [] Green, A.J. 2002, Proc. IAU Symp. 199, eds. A. Pramesh Rao, G. Swarup, & Gopal-Krishna, p.259
- [] Górny, S.K., Stasinska, G., Escudero, A.V, Costa, R.D.D. 2005, A&A, in press (astro-ph /0409532)
- [] Haynes, R.F., Caswell, J.L., Simons, L.W.J. 1978, Aust. J. Phys. Astron., 45, 1
- [] Heckathorn, J.N., Bruhweiler, F.C., Gull, T.R. 1982, ApJ, 252, 230
- [] Johnson, H.M. & Hogg, D.E. 1965, ApJ, 142, 1033
- [] Leitherer, C., Chapman. J.M., Koribalski, B. 1995, ApJ, 450, 289
- [] Lucke, P.B. 1978, A&A, 64, 367
- [] Mathis, J.S., Cassinelli, J.P., van der Hucht, K.A., Prusti, T., Wesselius, P.R., Williams, P.M. 1992, ApJ, 384, 197
- [] McClure-Griffiths, N.M., Dickey, J.M., Gaensler, B.M., Green, A.J. 2003, ApJ, 594, 833
- [] McCray, R. 1983, Highlights in Astron., 6, 565
- [] McCray, R., Kafatos, M. 1987, ApJ, 317, 190
- [] Mezger, P.G., Henderson, A.P. 1967, ApJ, 147, 471
- [] Monet, D.G. & 28 authors 2003, AJ, 125, 984
- [] Morgan, D.H., Parker, Q.A., Cohen, M. 2003, MNRAS, 346, 719
- [] Morgan, D.H., Parker, Q.A., Russeil D. 2001, MNRAS 322, 877
- [] Parker, Q.A., Hartley,M, Russeil,D., Acker,A., Morgan,D.H., Beaulieu,S., Morris,R., Phillipps,S., Cohen,M., 2003, “A rich new vein of Planetary Nebulae from the AAO/UKST H survey” in Planetary nebulae and their role in the Universe, ASP Conf.Ser., eds. M.Dopita, S.Kwok and R. Sutherland, p25
- [] Parker Q.A., Morgan, D.H., 2003, MNRAS, 341, 961
- [] Parker Q.A., Peyaud, A., Acker, A. 2004, in preparation
- [] Parker, Q.A., Phillipps, S. 1998, A&G, 39, 10
- [] Parker, Q.A., Phillipps, S. 2003, IAU 8th Asia-Pacific Regional Mtg., ASP Conf. Ser., 289, eds. S. Ikeuchi, J. Hearnshaw & T. Hanawa, pg.165
- [] Prinja, R.K., Barlow, M.J. & Howarth, I.D. 1990, ApJ, 361, 607 (Erratum ApJ, 383, 466, 1991)
- [] Price, S.D., Egan, M.P., Carey, S.J., Mizuno, D., Kuchar, T. 2001, A&A, 121, 2819
- [] Schlegel, D., Finkbeiner, D., & Davis, M. 1998, ApJ, 500, 525
- [] Smith, L.F. 1968a, MNRAS, 138, 109
- [] Smith, L.F. 1968b, MNRAS, 140, 409
- [] Smith, L.F., Shara, M.M., Moffatt, A.F.J. 1996, MNRAS, 281, 163
- [] Soker, N. & Zucker, D. B. 1997, MNRAS, 289, 665
- [] van der Hucht, K.A. 2001, New Astron. Rev., 45, 135
- [] Vega, E.I., Rabolli, M., Muzzio, J.C., Feinstein, A. 1980, AJ, 85, 1207
- [] Vreux, J.M., Dennefeld, M., Andrillat, Y. Rochowicz, K. 1989, A&A, 81, 353
- [] Weaver, R., McCray, R., Castor, J., Shapiro, P, Moore, R. 1977, ApJ, 218, 377
- [] Wendker, H.J., Smith, L.F., Israel, F.P., Habing, H.J., Dickel, H.R. 1975, A&A, 42, 173
- [] Westerlund, B.E. 1966, ApJ, 145, 724
- [] Wright, A.E., Barlow, M.J. 1975, MNRAS, 170, 41