A New Detached M Dwarf Eclipsing Binary
Abstract
We describe a newly-discovered detached M-dwarf eclipsing binary system. This system was first observed by the TrES network during a long term photometry campaign of 54 nights. Analysis of the folded light curve indicates two very similar components orbiting each other with a period of 1.12079 0.00001 days. Spectroscopic observations with the Hobby-Eberly Telescope show the system to consist of two M3e dwarfs in a near-circular orbit. Double-line radial velocity amplitudes, combined with the orbital inclination derived from light-curve fitting, yield Mtotal = 0.983 0.007 M⊙, with component masses of M1=0.493 0.003 M⊙ and M2=0.489 0.003 M⊙. The light-curve fit yields component radii of R1=0.453 0.060 R⊙ and R2=0.452 0.050 R⊙. Though a precise parallax is lacking, broadband VJHK colors and spectral typing suggest component absolute magnitudes of MV(1) = 11.18 0.30 and MV(2) = 11.28 0.30.
1 Introduction
Although low mass binary stars are the most abundant stars in the galaxy (Henry et al. 1999), their intrinsic faintness inhibits their detection and study. Non-contact eclipsing binary M dwarf systems have great value, as these systems allow accurate estimates of the most basic stellar parameters: mass and radius. Only four111We refer specifically to binaries where both components are M Dwarfs. There have been, however, a number of M stars whose companion is an F or G MS star (e.g. Pont et al., 2004), see Figure 1 such systems are known and have been studied in detail; YY Gem (Bopp 1974; Leung & Schneider 1978), CM Dra (Lacy 1977; Metcalfe et al. 1996; Kozhevnikova et al. 2004), GJ 2069A (Delfosse et al. 1999; Ribas 2003), and OGLE BW03 V038222This is a very close although still detached system. (Maceroni & Montalban, 2004). The observed properties of each of these systems present discrepancies with the theory of low-mass stellar objects; neither the observed mass-radius nor mass-luminosity relations are well represented by existing models (Benedict 2000); see Figure 1. The problem most likely lies in the shortcomings of the physical models, owing to the lack of understanding of the complex atmospheres of such low-mass objects (Baraffe et al. 1998). Enlarging the small existing sample of such systems is therefore desirable, to allow more detailed comparisons between observations and the theory of these ubiquitous, interesting, and complex objects. Here we report preliminary analysis of a fourth such low-mass eclipsing binary.
2 Observations
2.1 Photometric Observations
The recently discovered spectroscopic binary, TrES–Her0-07621 (=16h50m20.7s, =+46∘39′01′′ (J2000), =15.51 0.08) was first identified through an analysis of photometric time series from the TrES (Trans-Atlantic Exoplanet Survey) network. This network consists of three telescopes: STellar Astrophysics and Research on Exoplanets (STARE,333Observatorio del Teide, Tenerife, Spain Brown & Charbonneau, 1999), Planet Search Survey Telescope (PSST444Lowell Observatory, AZ, USA, Dunham et al. 2004), and Sleuth555Palomar Observatory, CA, USA. http://www.astro.caltech.edu/ftod/tres/sleuth.html . The telescopes are similar in their characteristics, with apertures of 10cm, 20482048 pixel CCD detectors and fields of view of 66∘.
TrES collects long-term time-series photometry in one filter. The photometry run in question spanned 54 days, beginning May 6 2003, and was observed in a band roughly equivalent to Harris R at a cadence of 1 image every 2 minutes. The images were reduced and calibrated by an automatic package developed specifically for these data. TrES–Her0-07621 was observed by both STARE and PSST, but the latter time series proved significantly noisier. We therefore analyzed only the STARE lightcurve. The R magnitude is 14.42 with each point having a formal accuracy of 0.04 mag rms. This lightcurve contains 8781 data points, obtained in 309.5 hours over 54 days, giving a duty cycle of 23.8%666The data are available via STARE website http://www.hao.ucar.edu/public/research/stare/stare.html .
A high-SNR peak in the time series’ frequency spectrum at 1.79 cycles per day initiated the study of TrES–Her0-07621. Folding the star’s light curve with a period of 1.1208 d showed it to be an eclipsing binary. The light curve also displays sinusoidal out-of-eclipse variations near the photometric period. The star’s infrared colors from the 2MASS777Two Micron All Sky Survey: University of Massachusetts and the Infrared Processing and Analysis Center/California Institute of Technology http://irsa.ipac.caltech.edu/cgi-bin/Gator/nph-dd catalog are quite red, (Table 1), and the USNO-B888SIMBAD, operated at CDS, Strasbourg, France; the NASA/IPAC Extragalactic Database (NED) and supported by JPL, California Institute of Technology, http://www.nofs.navy.mil/data/fchpix/ catalog shows a significant proper motion. Taken together, these facts suggested that the object is a binary M dwarf, with substantial levels of magnetic activity driven by the rapid, tidally-locked rotation of the component stars; this motivated further study.
2.2 Spectroscopic Observations
In September 2004 we obtained spectroscopic observations of TrES–Her0-07621 using the High Resolution Spectrograph (HRS, Tull 1998) on the Hobby-Eberly Telescope (HET). We secured measurements at 4 epochs; each epoch contained three separate exposures taken over approximately one hour — giving a total of 12 spectra. The analysis was carried out with standard IRAF (Tody 1993) echelle and rv package tools, including fxcorr. We cross-correlate TrES-Her0-07621 with an M2 dwarf (Gl 623) template and extract velocities for both components at four distinct phases. We adopted a radial velocity for the Gl 623 primary of -29.2 km s-1, given the orbital phase at which the template was secured and a systematic velocity, Vsys = -27.5 km s-1, from Marcy & Moore (1989). The HRS utilizes two CCDs covering the blue and red spectral regions. The data from each chip were analyzed independently, resulting in two velocity estimates. A third velocity estimate was obtained by cross-correlating an artificial H-alpha emission template with the H-alpha emission line found in each exposure. Given the large orbital velocities, there was no blending of correlation peaks at any phase. The three velocities (blue, red, H) are obviously not independent determinations, but do provide an estimate of our internal error.
3 Analysis
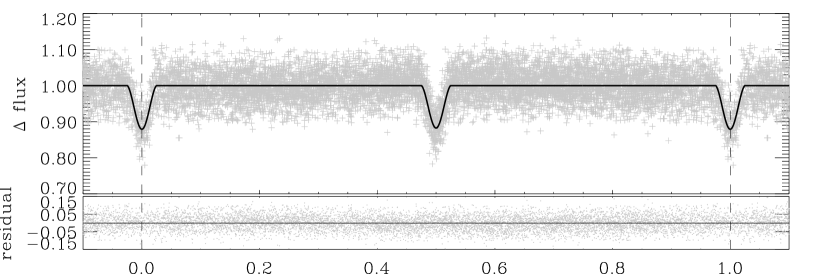
Figure 2 shows the component velocities plotted against photometric phase, while figure 3 (top panel) shows the folded photometric light curve. It is evident from the nearly-symmetrical and sinusoidal radial velocity variation and from the highly symmetrical light curve that the orbit is nearly circular, and that the component masses and surface brightnesses are similar.
An initial period analysis of the entire STARE lightcurve using the technique of phase dispersion minimization refined the photometric period to 1.1209 0.0006 days. We predicted and then observed an eclipse on 14 May 2004 using the 1.2m telescope at the Fred L. Whipple Observatory, AZ, USA using SLOAN filters , and . The long time base provided by this observation allowed us to refine the photometric period. By fitting the lightcurves during (21) eclipse times (we included only totally observed eclipses) to parabolas, we determined all the times of minimum light (center of eclipse) with corresponding error. For the eclipse observed on May 14th 2004, we only used the time of minimum light from the filter. We also used observations from IAC80 (see below). Using the bootstrap method we refined the period to 1.12079 0.00001 corresponding to a precision of 1 second. The epoch of secondary minimum, T0, was meanwhile determined to be 2453139.749509 (HJD) 0.000075.
TrES–Her0-07621 has a stellar neighbor at a distance of 8”, close enough that the two objects are blended in our STARE observations (STARE has a pixel size of about 11 arcsec). Observations in and Johnson filters using the IAC80 at Observatorio del Teide on 30 August 2004 provided a more realistic picture of the depth of one of the eclipses, while also allowing us to confirm the photometric period. We measured the PSF of both the binary and the neighbor using all five images outside of the eclipse. From these we derived the R fractional flux contribution from this companion star of 0.19 0.04. Because the companion star is also quite red (Table 1), the flux should be similar (to within the error) in both Johnson and Harris R filters, and so we can use this number to analyze the STARE time series. Measurement of the contamination of the eclipse signal from TrES–Her0-07621 by the companion star is important, because it must be accounted for when fitting the time-series data to estimate the stellar radii. This neighbor also has a proper motion that is similar in magnitude and direction to that of TrES–Her0-07621, indicating the possibility that TrES–Her0-07621 is at least a triple system, with the eclipsing pair of stars accompanied by a third M dwarf at a distance of hundreds of AU.
Adopting the photometric period as the orbital period and introducing its associated error, we fit all 36 radial velocities (blue, red, H) with a Keplerian model using GaussFit (Jefferys, Fitzpatrick & McArthur, 1988). The model is similar to that used in McArthur et al. (2004). We assume an eccenctricity of 0. The resulting radial velocity semi-amplitudes are km s-1 and km s-1, M⊙, and M1/M. A formal solution including eccentricity (e = 0.006 0.002) provided a better solution, reducing by 8%, while reducing the number of degrees of freedom by 3%. However, we constrain = 0 for this analysis.
We developed a chi-square minimization algorithm to estimate orbital parameters from the light curve, ignoring any variations between eclipses (Figure 3). The input parameters are period , component masses M1 and M2, limb-darkening coefficients (0.7, Claret, 1998, Table 7) and the light from a third nearby star as a fraction of the total light of the system (0.19 0.04). The code solves for both radii R1 and R2, effective temperature ratio T2/T1, center of minimum eclipse T0 and inclination . Figure 3 shows the resulting fit to the data.
The initial estimates for R1, R2, T2/T1 and were derived from two-dimensional contour plots (while keeping the other two parameters fixed). These contour plots presented high correlations between the two radii, constraining their sum while insensitive to their difference; and between radius (R1 or R2) and inclination; larger radius implies smaller inclination. T2/T1 was uncorrelated to both radii and inclination, so its error is given by the corresponding value of this parameter at (Press et al, 1986) in the direction of its axis. However, because the other parameters are obviously not independant, R1 and R2 for example, the error spanned the range of radii where the contour value is , (the full range error ellipsoid).
Even with the component masses determined, in absence of a Teff measurement we require the component absolute magnitudes to place these stars on the Mass-Luminosity Relation (MLR). From the TrES data, calibrated using stars within 1∘ that have measured V magnitudes from SIMBAD, we obtain a V-band apparent magnitude of 15.51 0.08 for the combined 3-star system, giving V-K = 4.63 0.10 (Table 1). Assuming a wavelength independent relative flux we estimate VAB-C = 1.72 from difference J, H and K magnitudes (between the neighbor and the binary). We can also estimate VA-B (between the binary components) = 0.1 0.05, based on the derived temperature and radii differences. Taking all of the above into account, we estimate the component magnitudes of VA = 16.37 0.1, VB = 16.56 0.1 and VC = 17.43 0.1, where is the stellar neighbor.
From Hawley et al, (2002) color-spectral type relations we estimate an M3 spectral type for each component. We obtain from the Hawley - spectral type relationships component absolute magnitudes of MV = 11.18, 11.28 0.3. Accepting this estimate of the luminosities, the distance modulus is (16.4-11.2) 5.2, corresponding to d110 pc. For this nearby system we have assumed no absorption (AV = 0). We also use the radii and effective temperature (Table 3) to determine luminosities, differentially with respect to the Sun (e.g. Benedict et al, 2003). With bolometric corrections as a function of temperature from Flower (1996) we obtain an average d = 118 13 pc for the two components.
4 Results and Comments
Using all the derived parameters and errors, we refit the lightcurve using our code, and tested these results with the code Nightfall999http://www.lsw.uni-heidelberg.de/users/rwichman/Nightfall.html (see below). Both codes give similar results, their difference being within the error bars. Tables 2 and 3 summarize the results.
Our code does not allow for stellar spots, so we subtracted a smooth function (by a Fourier technique) to remove the out-of-eclipse variations making a rectified lightcurve. We also constrain = 0. The top panel of Figure 3 shows the synthetic lightcurve (continuous line) corresponding to the model fit (our code) of the folded light curve (small crosses). Phase = 0 corresponds to the secondary eclipse. The bottom panel shows the residuals of the fit. The residuals show no variation as a function of phase indicating an adequate model fit.
Because our code is unable to account for spot variability, we inspected the residuals after subtracting the model fit from the unrectified lightcurve. These residuals also showed no evidence of eclipses. We also fit this unrectified lightcurve to find R1, R2, , T0 and T2/T1. The results varied slightly from those for the rectified light curve, but stayed within the error bars (Table 3).
Our original (unrectified) photometric light curve contains non-uniform outside-eclipse variations. Binary systems such as TrES–Her0-07621 are often magnetically active (e.g., Strassmeier et al. 1993). While tidal effects may be important, these non-uniform variations are most likely explained by star spots. We used Nightfall to model our unrectified lightcurve, because this code allows for the presence of spots on each of the components. Our derived parameters were used as inputs and we attempted to solve for the longitude, latitude and radii of spot(s). There was no unique solution; many combinations of these spot parameters could compensate for the out-of-eclipse variations, although they always presented a 180∘ longitude difference. This preferred longitude difference has also been observed in other active binary systems (see e.g., Henry et al. 1995). The presence of spots can have a significant effect on the accuracy of the derived parameters, such as inclination, temperature and radii (Torres & Ribas (2002) discuss this for the case of YY Gem). Additional observations, photometry in particular, will be necessary to increase the precision of the radii estimates as well as to learn more about the magnetic behaviour of the stars. This could then provide a link towards a better understanding of the physical processes of these low-mass objects.
References
- Baraffe (1998) Baraffe, I., Chabrier, G., Allard, F. & Hauschildt, P.H. 1998, A&A, 337, 403
- Benedict et al. (2000) Benedict, G.F., McArthur, B.E., Franz, O.G., Wasserman, L.H., Henry, T.J. 2000, AJ, 120, 1106
- Benedict et al. (2003) Benedict, G. F., et al. 2003, AJ, 126, 2549
- Bopp (1974) Bopp, B.W. 1974, ApJ, 193, 389
- Bouchy et al. (2005) Bouchy, F., Pont, F., Melo, C., Santos, N. C., Mayor, M., Queloz, D., & Udry, S. 2005, A&A, 431, 1105
- Brown & Charbonneau (1999) Brown, T. M. & Charbonneau, D. 1999, Bulletin of the American Astronomical Society, 31, 1534
- Claret (1998) Claret, A. 1998, A&A, 335, 647
- Cochran et al. (2004) Cochran, W.D., et al. 2004, ApJ, L611
- Cox (2000) Cox, A.N. 2000, Allen’s Astrophysical Quantities (4th ed.; New York, AIP Press: Springer)
- Delfosse (1999) Delfosse, X., Forveille, T., Mayor, M., Burnet, M., & Perrier, C. 1999, A&A, 341, L63
- Dunham (2004) Dunham, E. W., Mandushev, G. I., Taylor, B. W., & Oetiker, B. 2004, PASP, 116, 1072
- Flower (1996) Flower, P. J. 1996, ApJ, 469, 355
- Hawley et al. (2002) Hawley, S.L., et al. 2002, AJ, 123, 3409
- Henry & McCarthy (1993) Henry, T. J., & McCarthy, D. W. 1993, AJ, 106, 773
- Henry et al. (1995) Henry, G.W., Eaton, J.A., Hamer, J., & Hall, D.S. 1995, ApJS, 97, 513
- Jefferys, Fitzpatrick, & McArthur (1988) Jefferys, W. H., Fitzpatrick, M. J., & McArthur, B. E. 1988, Celestial Mechanics, 41, 39
- Ko (2004) Kozhevnikova, A.V., Kozhevnikov, V.P., Zakharova, P.S., Polushina, T.S., Svechnikov, M.A. 2004, Astronomy Reports, 48, 826
- Lacy (1977) Lacy, C. 1977, ApJ, 218, 444
- Leung & Schneider (1978) Leung, K., & Schneider, D. 1978, AJ, 83, 618
- Maceroni & Montalbán (2004) Maceroni, C., & Montalbán, J. 2004, A&A, 426, 577
- Marcy & Moore (1989) Marcy, G.W., & Moore, D., 1989, ApJ, 341, 961
- McArthur et al. (2004) McArthur, B.E., et al. 2004, ApJ, L614, L81
- Metcalfe et al. (1996) Metcalfe, T.S., Mathieu, R.D., Latham, D.W., Torres, G. 1996, ApJ, 456, 356
- Pont et al. (2005) Pont, F., Bouchy, F., Melo, C., Santos, N.C., Mayor, M., Queloz, D., Udry, S. 2005, astro-ph/0501615
- Press et al., (1986) Press, W.H., Flannery, B.P., Teukolsky, S.A., Vetterling, W.T., 1986, Numerical Recipes, Cambridge, Sect 14.5
- Ribas (2003) Ribas, I. 2003, A&A, 398, 239
- Strassmeier et al. (1993) Strassmeier, K. G., Hall, D. S., Fekel, F. C., & Scheck, M. 1993, A&AS, 100, 173
- Torres & Ribas (2002) Torres, G., & Ribas, I. 2002, ApJ, 567, 1140
- Tody (1993) Tody, D. 1993, ASP Conf. Ser. 52: Astronomical Data Analysis Software and Systems II, 2, 173
- Tull (1998) Tull, R.G. 1998, Proc. SPIE, 3355, 387
| Binary | Neighbor | |
| Jaa2MASS catalog | 11.773 | 13.487 |
| H | 11.137 | 12.863 |
| K | 10.880 | 12.615 |
| J-K | 0.893 | 0.872 |
| bbUSNO-B catalog, units mas yr-1 | -2 8 | -26 14 |
| +30 3 | +28 7 | |
| P(days) | 1.12079 | 0.00001 | ||
| P(years) | 0.00306861 | 0.00000036 | ||
| T0(JHD) | 2453139.749509 | 0.00075 | ||
| MT(M⊙) | 0.983 | 0.007 | ||
| a(AU) | 0.01047 | 0.00002 | ||
| a(R⊙) | 2.251 | 0.005 | ||
| (∘) | 83.12 | 0.30 | ||
| (km s-1) | -26.5 | 0.3 | ||
| TB/TA | 0.97 | 0.02 |
| A | B | ||||||||
|---|---|---|---|---|---|---|---|---|---|
| M(M⊙) | 0.493 | 0.003 | 0.489 | 0.003 | |||||
| MV | 11.18 | 0.30 | 11.28 | 0.30 | |||||
| K(km s-1) | 100.54 | 0.31 | 101.29 | 0.31 | |||||
| R(R⊙) | 0.453 | 0.060 | 0.452 | 0.050 | |||||
| TeffaaThe component A temperature is based on that expected of an M3V star (Cox, 2000). (K) | 3500 | 3395 | |||||||