RR Lyrae variables in Galactic globular clusters
We use our synthetic Horizontal Branch (HB) procedure to approach the debated problem concerning the adequacy of canonical HB stellar models to account for the observed peaked distribution of RR Lyrae fundamentalised periods in the globular cluster M3. We find that by assuming a suitable bimodal mass distribution, canonical models account for the observed period distribution. In particular, the best fit model, out of nine random extractions, reaches a 99.9 % Kolmogorov-Smirnov (KS) probability. We also attempt a prediction of the relative distribution of variables in fundamental and first overtone pulsators, reaching a rather satisfactory agreement. However, one finds that canonical models outnumber by roughly a factor of two the observed number of red HB stars. Possible solutions for this discrepancy are outlined. Alternative evolutionary scenarios are also briefly discussed.
Key Words.:
Stars: variables:RR Lyrae, Stars: evolution, Stars: horizontal-branch1 Introduction
In a previous paper of this series (Cassisi et al 2004: Paper IV) we have presented the overall scenario of pulsational predictions based on our synthetic Horizontal Branch (HB) procedure, discussing the satisfactory agreement between predictions and selected properties of RR Lyrae pulsators in globular clusters with various metallicities and/or Horizontal Branch (HB) types. In this paper we will approach a more detailed investigation, by discussing the case of the RR Lyrae period frequency histogram in M3, which has been recently claimed to be at variance with current predictions of stellar evolution theory.
To shortly recall the history, Castellani & Tornambé (1981) first draw the attention on the peaked distribution of fundamental periods in M3 as an evidence requiring a peculiar distribution of stars within the instability strip. The problem was revisited by Rood & Crocker (1989), who pointed out the difficulty to account for the observed periods on the basis of smooth mass distributions. More recently, the same problem has been addressed by Catelan (2004), who reached the conclusion that the period distribution of RR Lyrae variables in M3 is at odds with canonical HB model predictions.
The structure of the paper is the following: in the next section we will discuss results based on our synthetic procedure, showing that canonical HB models can closely reproduce the period frequency histogram of RR Lyrae in M3 if a suitable bimodal distribution of HB masses is assumed. In Section 3 we will attempt a prediction of the relative distribution of fundamental and first overtone pulsators; Section 4 deals with the distributions of stars along the HB, discussing a troublesome disagreement between observed and predicted number of red HB stars. A few comments concerning alternative evolutionary scenarios will close the paper.
2 M3: the models
Concerning the evolutionary framework, we rely on the stellar models already presented in Paper IV, adopting for the cluster a metallicity Z=0.001, as in Catelan (2004). However, as outlined in Paper IV, one has to bear in mind that similar canonical models are still affected by uncertainties, due to current limits in the physical inputs. For example, changes in the adopted nuclear cross section (Caughlan & Fowler 1985) affect both the morphology of the evolutionary track and the core He-burning lifetime (Dorman 1992). In addition, all stellar models whose evolutionary tracks are located in the cooler portion of the HB, are affected by current uncertainty in the efficiency of superadiabatic convection.
The procedure adopted to compute synthetic RR Lyrae pulsators has been exhaustively described in the previous papers of this series and it will not be repeated here. Here we only note that present work is based on up-to-date relations for both periods and instability boundaries, as derived and discussed in Paper III (Di Criscienzo, Marconi & Caputo 2004). As a result, our blue instability boundary (BE), is located around 7100-7200 K, i.e., about 200 K cooler than in Case A by Catelan(2004). Moreover, the width of the instability strip is not a free parameter but it is fixed by pulsational constraints at a temperature cooler than the BE temperature by about .
However, the results presented in the following appear only marginally dependent on the adopted pulsational scenario. As a matter of fact, since the Van Albada & Baker’s (1971) formulation of the relation connecting pulsation periods with the structural parameters M, L and Te, it was already clear that a smooth distribution of stars within the instability strip will produce a smooth distribution of periods, independently of any plausible assumption about the instability boundaries and/or the star luminosity level (see. e.g. Caputo & Castellani 1975). As a consequence, it was also clear that any smooth distribution of HB star masses, as produced by the often adopted mass dispersion 0.02 , was inadequate to account for the peaked period distribution observed in M3.

| N(red) | ||||
|---|---|---|---|---|
| 1 | 9.7 E-3 | 98.55 | 92.24 | 246 |
| 2 | 1.5 E-2 | 13.24 | 22.62 | 302 |
| 3 | 1.7 E-1 | 77.87 | 69.50 | 243 |
| 4 | 2.9 E-2 | 91.54 | 99.93 | 240 |
| 5 | 1.2 E-1 | 44.86 | 41.93 | 219 |
| 6 | 1.8 E-1 | 85.37 | 61.49 | 242 |
| 7 | 9.7 E-3 | 20.78 | 21.52 | 213 |
| 8 | 8.2 E-2 | 77.87 | 83.79 | 240 |
| 9 | 6.1 E-3 | 69.59 | 60.78 | 201 |
To explore the predictions of canonical HB evolutionary tracks, we decided - as a first step - to keep the assumption of a normal deviate mass distribution, progressively decreasing the adopted mass dispersion and exploring the predicted period frequency distribution with the mean mass as a free parameter. In the case of a failure of such an approach, we were ready to test different mass distributions. However, one finds that the period distribution in M3 can be nicely reproduced when assuming a mean HB mass M=0.68 with a dispersion 0.005.
Fig. 1 shows the results of our first nine random extractions as performed under the quoted assumption concerning the mass distribution and by populating the HB till the number of RR Lyrae observed in M3 was reached (see Castellani, Caputo & Castellani 2003: Paper I). The comparison with the observed distribution, as given in the same figure, unambiguously demonstrate that at least two out of the nine experiments (i.e. simulations n.1 and 4) give a period frequency distribution which closely resembles the observed one.
However, one easily recognizes that the predicted period distribution appears marginally shifted toward larger values, by an amount of the order of 0.02. Such a shift is detected by the Kolmogorov-Smirnov test which gives a quite small probability between observed and predicted period distributions (Column 2 in Table 1). According to the pulsation theory (see Paper III) one can account for such a shift simply decreasing the adopted HB luminosity by 0.02 or, alternatively by increasing the HB masses by . We recall here that in Paper IV the HB luminosity level was calibrated to reproduce the period interval observed in M3. In this context, the above correction appears well inside the uncertainty of that calibration.
By applying such a correction one eventually finds that the Kolmogorov-Smirnov test gives probabilities for the similarity of observed and predicted distributions that sensitively increases, ranging from 13.2% (case n.2) to 98.6% (case n.1). The column 3 in Table 1 gives the results of such a test, while Fig. 2 shows the comparison with the observed period distribution and the two ”best” predictions, as given by models n.1 and 4. We conclude that canonical evolutionary tracks can account for the peaked period histogram by adopting a suitable mass distribution.

According to this simulation, RR Lyrae should be HB star crossing the instability strip during their blueward evolution from the original red Zero Age Horizontal Branch (ZAHB) location. As a consequence, the simulation is producing mainly red and RR Lyrae stars, with very few stars hotter than the instability strip. The evidence for a rich population of blue HB stars in M3 thus requires the additional contribution of a separate population of less massive HB stars, located at the blue side of the instability strip.
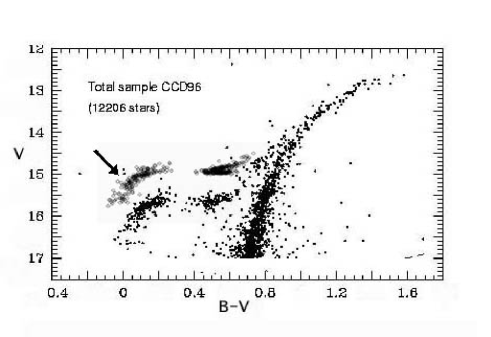
One may easily predict that such an additional population should give a marginal contribution to the bulk of RR Lyrae pulsators, since only stars in the later phases of HB evolution will cross the instability strip. However, we will follow the suggestion of our referee discussing this point in more details. As already done by Catelan, we took from stellar counts the number of blue HB stars, populating the blue HB portion with 206 stars uniformly distributed over the range of masses 0.65 to 0.61 M⊙. This means that we account for a HB population whose ZAHB temperatures range from =3.859 to =4.045, i.e., from a temperature close to the BE up to the temperature of the hot end of the bulk of M3 blue HB stars. Note that the adopted distribution maximizes the contribution of the blue HB population to the variables. The same number of blue stars with, e.g., a gaussian distribution around the mean mass 0.63 M⊙ and a dispersion 0.01, covers a similar range of temperatures giving a lower number of pulsators, since a large fraction of HB stars located close to the blue instability boundary moved towards hotter colors.
Using once again a set of 9 different random extractions we found that the number of RR Lyrae from this population ranges from 7 to 20, i.e., giving a marginal but not negligible contribution to the pulsator population. Figure 3 shows the comparison between the predicted color magnitude diagram distribution and observational data from Ferraro et al. (1997). The simulations account for an observational gaussian error with =0.02 in both magnitudes. Column 4 in Table 1 shows that the inclusion of such a contribution raises in the best case the KS probability up to 99.9%, supporting the occurrence in M3 of a bimodal distribution of HB masses.
Such a bimodal distribution is of course an unexpected feature. However, we notice that within the galactic globular cluster family this feature is far from being unusual, since Harris (1974) brought forward the striking bimodal distribution of HB stars in the galactic globular NGC2808 (see, e.g., Catelan 2004; D’Antona & Caloi 2004, and references therein). According to the result of the present investigation, one should conclude that even in the M3 case we are facing with a bimodal HB, though with a hidden bimodality which becomes evident only when the distribution of RR Lyrae periods is taken properly into account.
3 Fundamental and first overtone pulsators
By relying on the overall agreement between observed and predicted fundamentalised periods, one can go deeper in the comparison, thus testing the predictions of the theoretical scenario concerning the relative distribution of fundamental and first overtone pulsators. To this purpose we adopted from pulsational theories the topology of the instability strip, with first overtone pulsators in the hotter portion of the strip, fundamental pulsators in the cooler portion, and an intermediate range of temperatures where both modes can be stable (the OR zone).
Fig. 4 shows that the synthetic models, using the recipe of the hysteresis mechanism (Van Albada & Baker 1971), i.e., by assuming that in the OR zone the variables pulsate in their previous pulsation mode, can reach a reasonable similarity with observations, provided that theoretical estimates for the fundamental blue boundary are decreased by about 100 K, i.e., down to =3.832. On the contrary, the third panel in figure 4 shows that the assumption of a fixed transition temperature gives a sharp separation in the fundamentalised periods, not observed in M3.
This evidence is supported by Kolmogorov-Smirnov test for the distribution of c-type periods, as listed in Columns 2 and 3 of the Table 2. The hysteresis case, out of the 9 random extractions, reaches a maximum probability of 93.3% against 61.3% for a fixed transition. The issue is, however, open to other possible assumptions, and we present data in Fig. 4 only as a first step on the long way of a difficult investigation that will deserve more efforts.

4 The problem of Red HB
The main goal of this investigation has been reached by showing that there is not an intrinsic and unavoidable incompatibility between the M3 period distribution and canonical evolutionary tracks. However, one may go deeper, discussing theoretical predictions in connection with the observed HB distribution. Synthetic models in the previuos sections have been constructed by directly relying on the observed number of variables (V) and blue (B) HB stars. On the contrary, the number of red (R) HB stars is a computational result, linked by evolution to the V-number.
The last column in Table 1 discloses that present computations give in all cases a number of red HB stars larger than the number of RR Lyrae variables. On the contrary, Catelan (2004) quotes unpublished data for which the 530 HB stars in M3 should be distributed according to the ratios B:V:R = 0.39:0.40:0.21. These ratios, once confirmed, raise the contradictory evidence for which evolutionary models produce an almost perfect fitting of the period distribution, but do not account for the observed number of 111 red HB stars.
In this context, a firm evaluation of the HB distribution appears of great relevance to assess the adequacy of the synthetic procedure. However, one has to notice that on the theoretical side the V:R ratio can be modulated in several ways, by modulating the shape of the mass distribution and/or the temperature interval covered by the evolutionary tracks which, in turn, for red stars depends on several assumptions, in particular the nuclear cross section and the free parameter governing the efficiency of convection in stellar envelopes.
As an example, one can modify the adopted gaussian distribution by cutting away the tail of most massive stars, decreasing in this way the number of red stars, leaving substantially unchanged the RR Lyrae distribution. The number of red HB stars predicted by assuming a truncated gaussian, i.e., neglecting all the HB masses larger than the mean mass, are listed in the last column of Table 3. It turns out that, over the 9 random extractions the number of red HB stars reaches a minimum value of 138 stars, against the 111 given by Catelan, keeping in that case a robust 82% of KS probability. The semigaussian distribution is of course an ”ad hoc” assumption, but here we are just exploring wether ”ad hoc” assumptions can reconcile canonical models with observations. In this context, one may note that the largely adopted gaussian mass distribution appears as an useful and reasonable assumption. However, firm constraints on the plausibility of such a distribution should await for new insights on the still unknown mechanism driving the mass loss.
An overabundance of red stars could be taken also as an evidence for the occurrence of shorter but still canonical evolutionary tracks, as produced by passing from the adopted cross section for the reactions (Caughlan & Fowler 1985) to the revised values presented by Kunz et al. (2002; see also Dorman 1992). In principle, the same effect could be produced by an increase of the mixing length parameter (see, e.g., Brocato et al.. 1999). However, in our models the mixing length has been calibrated on the temperature of the RGB branch, and a difference of mixing length between RGB and HB stars can be barely supported. Moreover and even more interestingly, we also found that a decrease of the metallicity below Z=0.001, as a consequence of the recently suggested revised solar metallicity (Z⊙ = 0.0122: Asplund et al. 2004) would solve the problem.
In this context, one has first to notice that such a new value for the global solar metallicity should be not simply scaled according to the available values of [Fe/H] for M3 in absence of suitable 3D non-LTE models for globular clusters metal poor stars. However, as a first order approximation one may take [Fe/H]=-1.5 from Kraft & Ivans (2003) thus deriving Z(M3) 0.0006 where an enhancement of elements by [/Fe]= 0.3 has been taken into account. As a matter of fact, one finds that the nine synthetic models with Z=0.0006 and a truncated gaussian predict a mean number of red stars as given by 133, with smaller KS probabilities, but still reaching in the best case a number of red stars as low as 98, with a KS probability still of the order of 30%.
| 1 | 93.35 | 61.29 |
|---|---|---|
| 2 | 7.69 | 19.37 |
| 3 | 18.98 | 8.44 |
| 4 | 91.57 | 36.70 |
| 5 | 81.22 | 39.61 |
| 6 | 89.20 | 54.91 |
| 7 | 43.99 | 12.90 |
| 8 | 7.67 | 14.08 |
| 9 | 19.05 | 6.16 |
| 1 | 61.07 | 165 |
| 2 | 37.67 | 169 |
| 3 | 13.24 | 149 |
| 4 | 4.75 | 164 |
| 5 | 31.25 | 204 |
| 6 | 61.07 | 180 |
| 7 | 10.40 | 159 |
| 8 | 81.99 | 138 |
| 9 | 37.67 | 145 |
We are not in the position of discriminating among the various possibilities, since both the cluster metallicity scale, the cross section and, perhaps, the cluster HB type are far from being firmly established. However, the above discussion shows that the V:R ratio does not appear to be a firm prediction of the theory, and different paths can be followed to reconcile this number with observations by relying on canonical evolutionary models.
5 Discussion and conclusions
As already mentioned, the canonical scenario leaves some degree of freedom for the computed evolutionary tracks, as a consequence of uncertainties in various physical ingredients. On the contrary, it appears difficult to move HB models beyond their canonical paths. The growth of the convective cores and the efficiency of semiconvection appear the major assumptions which could be debated, at least in principle. As well known (see, e.g., Demarque & Sweigart 1976) both these mechanisms act in the sense of increasing the amount of mixing in the central region and, in turn, the width in temperature of the loop experienced by HB stars during their central He burning phase. Thus a decreased amount of central convection or of semiconvection appears just as an additional, alternative way to decrease to range of effective temperatures covered by HB evolutionary tracks.
However, one cannot safely decrease the canonical efficiency of these mechanisms without running against severe observational constraints. A decrease in the efficiency of mixing will cause indeed a decrease in the HB lifetime with a corresponding increase of the time spent on the Asymptotic Giant Branch. We find that in the extreme case of no mixing the number ratio N of stars in the two quoted evolutionary phase will raise towards untenable values, up to N 0.26, whereas the canonical value N 0.15 has been already proved to be in excellent agreement with observations (Cassisi, Salaris & Irwin 2003).
On the other hand the supposed occurrence of mass loss during the HB phase (Wilson & Bowen 1984) can hardly be of help, since in the case of M3 (Z0.001) this will further increase the range of effective temperatures covered by evolving HB models and, in turn, the range of RR Lyrae periods. The problem cannot be either solved by the conjectured efficiency of an ”evolutionary trapping” (Koopmann et al. 1994) at the transition line between RRc and RRab, as discussed by Catelan, since it would produce a peaked distribution for both ab and c-type pulsators, not observed in M3.
Hence the supposed failure of canonical models would affect the basis of an evolutionary theory which has already proved to finely account for many observational features of stars evolving in our Galaxy as in nearby ones. In this paper we have shown that canonical HB models might account for the observed distribution of fundamentalised period of RR Lyrae in the globular cluster M3. We assumed a bimodal mass distribution, with a sharply peaked mass mode just to the red side of the instability strip which closely resembles the one discussed by Catelan (2004) in the framework of his ”trimodal” scenario.
Such a bimodal mass distribution is clearly different from the semi-empirical one derived by Rood & Crocker (1989) on the basis of the color distribution of the cluster stars, which is to our knowledge the only one appeared in the literature. Further studies to derive the mass distribution of the HB stars in M3 by using more recent data could provide an important test of the bimodal mass distribution hypothesis.
One may finally notice that the peaked period distribution discussed in this paper for the M3 case is not a common feature of RR periods in galactic globular clusters. We plan to discuss this point in a following paper, which will be devoted to a synthetic approach to RR Lyrae period distributions in both Oosterhoff I and Oosterhoff II RR Lyrae rich clusters. Here we only notice that inspection of Fig.1 in Paper I (Castellani, Caputo & Castellani 2003) reveals that several Oosterhoff I globular clusters show a much flatter period distributions. This is in particular the case for the two RR Lyrae rich clusters M5 and M62. This occurrence requires much less severe constraints on the mass distribution of HB stars, supporting perhaps the Catelan (2004) suggestion for which M3 might be ”a pathological case that cannot be considered representative of the OoI class”.
Acknowledgements.
This research has made use of NASA’s Astrophysics Data System Abstract Service and SIMBAD database operated at CDS, Strasbourg, France. This work was partially supported by MURST (PRIN2002, PRIN2003). We acknowledge Giuseppe Bono for a critical reading of the manuscript. We thank our anonymous referee for his/her quite detailed comments and suggestions that stimulated a relevant widening of the original investigation.References
- (1) Asplund M., Grevesse N.,Sauval A.J., Allende Prieto C., Kiselman D., 2004, A&A 417, 751
- (2) Brocato E., Castellani V., Raimondo G., Walker A.R. 1999, ApJ 527, 230
- (3) Caputo F., Castellani V. 1975, Mem. Soc. Astron. It. 46, 303
- (4) Cassisi S., Castellani M., Caputo F., Castellani V. 2004, A&A 426, 641 (Paper IV)
- (5) Cassisi S., Salaris M., Irwin A.W. 2003, ApJ 588, 862
- (6) Castellani M., Caputo F., Castellani V. 2003, A&A 410, 871 (Paper I)
- (7) Castellani V., Tornambé A. 1981, A&A 96, 207
- (8) Catelan M. 2004, ApJ 600, 409
- (9) Caughlan G.R., Fowler W.A. 1985, Atom. Data Nucl. Data Tables 32, 197
- (10) D’Antona F., Caloi V. 2004, ApJ 611, 871
- (11) Demarque P., Sweigart A.V. 1976, A&A 20, 442
- (12) Di Criscienzo M., Marconi M., Caputo F. 2004, ApJ 612, 1092 (Paper III)
- (13) Dorman B. 1992, ApJS 81, 221
- (14) Ferraro F. R., Carretta E., Corsi C. E., Fusi Pecci F., Cacciari, C. et al. 1997, A&A 320, 757
- (15) Harris W.E. 1974, ApJ 192, L161
- (16) Koopmann R. A., Lee Y-W., Demarque P., Howard, J.M., 1994, ApJ 423, 380
- (17) Kraft R.T., Ivans I.I. 2003, PASP 115, 143
- (18) Kunz R., Fey M., Jaeger M., Mayer A., Hammer J.W. et al. 2002, ApJ 567, 643
- (19) Marconi M., Caputo F., Di Criscienzo M., Castellani M. 2004, ApJ 596, 299 (Paper II)
- (20) Rood R.T., Crocker D.A. 1989, IAU Colloquium 111,The Use of Pulsating Stars in Fundamental Problems of Astronomy, Cambridge and New York, Cambridge University Press, p. 103.
- (21) Van Albada T.S., Baker N. 1971, ApJ 169, 311
- (22) Wilson, L. A., Bowen, G. 1984, Nature, 312, 429