Orbital Parameters of the Microquasar LS I +61 303
Abstract
New optical spectroscopy of the HMXB microquasar LS I +61 303 is presented. Eccentric orbital fits to our radial velocity measurements yield updated orbital parameters in good agreement with previous work. Our orbital solution indicates that the periastron passage occurs at radio phase 0.23 and the X-ray/radio outbursts are triggered 2.5–4 days after the compact star passage. The spectrum of the optical star is consistent with a B0 V spectral type and contributes 65 percent of the total light, the remaining due to emission by a circumstellar disc. We also measure the projected rotational velocity to be km s-1.
keywords:
stars: accretion, accretion discs – binaries:close – stars: individual (LS I +61 303) – X-rays: stars1 Introduction
LS I +61 303 is a peculiar radio and X-ray star which has attracted the interest of astronomers during the last quarter of a century. Attention to it was first called by Gregory & Taylor (1978) during a galactic plane survey aimed at the identification of radio variables on both short and long time-scales. This precursor work unveiled what has remained a key property of LS I +61 303 over the years, that is, a clearly periodic modulation of its radio emission every 26.5 days (Taylor & Gregory, 1982).
Just to mention the key facts, LS I +61 303 is a high mass X-ray binary (HMXB) with the optical component being a B0 Ve star with a circumstellar disc, mag, and with an estimated distance of 2 kpc (Hutchings & Crampton, 1981; Paredes & Figueras, 1986; Frail & Hjellming, 1991). The periodic modulation has also been observed at optical and infrared wavelengths (Mendelson & Mazeh, 1989; Paredes et al., 1994), in X-rays (Paredes et al., 1997), and possibly in -rays as well (Massi, 2004a). This modulation is widely attributed to the orbital period of the binary system and the most accurate determination ( d) comes from radio observations (Gregory, 2002). A second modulation, on a longer time scale of 4 yr, has also been reported (Paredes, 1987; Gregory et al., 1989) and is likely associated with an outward-moving density enhancement or shell in the equatorial disc of the rapidly rotating Be star (Gregory & Neish, 2002). The recent detection of relativistic radio jets – at milli-arcsecond angular scales and with hints of precession – by Massi et al. (2004) firmly includes LS I +61 303 in the selected class of galactic microquasars. The nature of the compact object remains unknown given the poor constraints in the system parameters and the lack of classical neutron star signatures (e.g. X-ray pulses or Type I bursts).
The seminal paper by Gregory & Taylor (1978) already pointed out the possible connection of the peculiar radio star with the COS B -ray source CG135+01. The idea of LS I +61 303 as a -ray emitter has persisted over the years. Today, this star is the best counterpart candidate to 3EG J0241+6103, one of the unidentified high energy ( MeV) sources in the 3rd EGRET catalog (Hartman et al., 1999). Such association is likely not to be a unique case. The microquasar LS 5039, probably associated with another EGRET source, brought the idea that microquasars could be behind some of the unidentified EGRET sources (Paredes et al., 2000). Theoretical modelling of the -ray emission strongly supports this interpretation. Inverse Compton scattering of stellar photons by the relativistic electrons in the jets, can account for the overall properties of microquasars from radio to -rays (Bosch-Ramon & Paredes, 2004).
In this context, it is surprising that the orbital parameters of LS I +61 303 have remained poorly known over the years. Over two decades ago, Hutchings & Crampton (1981) carried out a series of optical spectroscopic observations from which a radial velocity curve of the binary system was determined. Spectroscopic determination of the radial velocity curve of LSI+61 303 is complicated by contamination of the narrow photospheric lines by emission from the Be circumstellar envelope. Here we present new optical spectroscopic observations of LS I +61 303 using modern telescopes and detectors. The idea was to obtain an improved set of spectroscopic orbital elements which could be used to address issues such as the system’s mass function, orbital eccentricity, or the phase of periastron, among others. An accurate knowledge of such fundamental properties is esential to remove the lingering uncertainties that plague all theoretical models for the multi-wavelength variable emission of LS I +61 303, which we believe is a prime target to attain a better understanding of the -ray sky.
In the following sections we present our observation and reduction procedures, orbital fits and discussion of results.
2 Observation and Data Reduction
LS I +61 303 was observed using three different telescopes and instruments in the blue spectral range (3400-5800) during years 2002 and 2003. Seventeen intermediate resolution spectra (0.63 Å pix-1) were obtained using the Intermediate Dispersion Spectrograph (IDS) attached to the 2.5 m Isaac Newton Telescope (INT) at the Observatorio del Roque de Los Muchachos on the nights of 27-31 July 2002, 13 March 2003 and 1-7 July 2003. We used the R900V grating in combination with the 235 mm camera and a 1.2 slit to provide a spectral resolution of 83 km s-1 (FWHM). The spectral type standard Sco was also observed with the same instrumentation for the purpose of radial velocity analysis. In addition, this star has a very low projected rotational velocity, lower than 5 km s-1 according to Hardorp & Scholz (1970) and Stickland & Lloyd (1995). Six high-resolution spectra of LS I +61 303 were also obtained with the 2.7 m Harlan J. Smith telescope and the 2dcoude spectrograph (Tull et al., 1995) at McDonald Observatory (Texas) on UT 3-5 August 2002 and 8-9 April 2003. We used the F3 focal station, the E2 echelle grating, and a 12 slit to achieve a FWHM resolution of about 5 km s-1. Finally, five low resolution spectra (2.74 Å pix-1) were obtained on the nights of 13 October and 15-17 December 2003 with the ALFOSC spectrograph at the Nordic Optical Telescope (NOT) at the Observatorio del Roque de Los Muchachos. We employed grism 6 and a 0.5 slit which resulted in a spectral resolution of 235 km s-1, as measured from gaussian fits to the arc lines. A complete log of the observations is presented in Table 1.
The images were bias corrected and flat-fielded, and the spectra subsequently extracted using conventional optimal extraction techniques in order to optimize the signal-to-noise ratio of the output (Horne, 1986). Frequent observations of comparison arc lamp or hollow cathode lamp images were performed in the course of each run and the pixel-to-wavelength scale was derived through polynomial fits to a large number of identified reference lines. The final rms scatter of the fit was always 1/30 of the spectral dispersion.
| Date | Object | Obs. | Exp. Time | Dispersion |
|---|---|---|---|---|
| (seconds) | (Å pix-1) | |||
| 2002-07-27 | LS I +61 303 | INT | 600,300 | 0.63 |
| 2002-07-28 | LS I +61 303 | INT | 2x600 | 0.63 |
| 2002-07-29 | LS I +61 303 | INT | 600,360 | 0.63 |
| 2002-07-30 | LS I +61 303 | INT | 2x600 | 0.63 |
| 2002-07-31 | LS I +61 303 | INT | 300 | 0.63 |
| 2002-08-03 | LS I +61 303 | McD | 600 | 0.11 |
| 2002-08-04 | LS I +61 303 | McD | 800 | 0.11 |
| 2002-08-05 | LS I +61 303 | McD | 600 | 0.11 |
| 2003-03-13 | LS I +61 303 | INT | 2x300 | 0.63 |
| 2003-04-08 | LS I +61 303 | McD | 1200 | 0.11 |
| 2003-04-09 | LS I +61 303 | McD | 2x1200 | 0.11 |
| 2003-07-01 | LS I +61 303 | INT | 300 | 0.63 |
| 2003-07-01 | Sco | INT | 1 | 0.63 |
| 2003-07-02 | LS I +61 303 | INT | 500 | 0.63 |
| 2003-07-03 | LS I +61 303 | INT | 500 | 0.63 |
| 2003-07-04 | LS I +61 303 | INT | 600 | 0.63 |
| 2003-07-05 | LS I +61 303 | INT | 400 | 0.63 |
| 2003-07-06 | LS I +61 303 | INT | 500 | 0.63 |
| 2003-07-07 | LS I +61 303 | INT | 750 | 0.63 |
| 2003-12-15 | LS I +61 303 | NOT | 60 | 2.74 |
| 2003-12-16 | LS I +61 303 | NOT | 60 | 2.74 |
| 2003-12-17 | LS I +61 303 | NOT | 60 | 2.74 |
3 Radial Velocities and Orbital Solution
All the spectra were prepared for the cross-correlation analysis by subtracting a low order spline fit to the continuum and subsequently rebinned into a uniform velocity scale of 42 km s-1. The template spectrum, Sco, was broadened by 113 km s-1 and 226 km s-1 in order to match the width of the photospheric lines in the LS I +61 303 spectra obtained with the INT and NOT, respectively. These broadening factors were derived by subtracting several broadened versions of Sco from individual spectra of LS I +61 303 and performing a test on the residuals (see details in Marsh, Robinson & Wood, 1994). To broaden the template spectrum we employed a Gray rotational profile (Gray, 1992) with a limb darkening coefficient of , appropriate for our spectral type and wavelength range. Note that the optimal broadening is driven by differences in instrumental resolution for the case of the NOT spectra, but not the INT since the same setup was used in both the LS I +61 303 spectra and the template. In the latter case, the broadening is directly associated to and confirms that the optical star in LS I +61 303 is rapidly rotating. On the other hand, since the instrumental resolution of the McDonald data is much higher than the template, we decided to optimally broaden the target spectra (to match the template) for the sake of the cross-correlation analysis. The optimal broadening was found to be 113 km s-1.
We cross-correlated every individual spectrum of LS I +61 303 with the conveniently broadened template of Sco after masking out the interstellar absorption features at 3934 (Ca ii K) and 4430. The correlations include H i lines from H to H8 and all He i and He ii lines in the spectral range 3850–5020 (see Fig. 3). Furthermore, since the H i lines are prone to contamination by stellar wind emission in early-type stars, we also decided to obtain a set of radial velocities with only He i and He ii lines. The resulting velocities were folded on the radio ephemeris of Gregory (2002) ( d, =HJD2443366.775). Table 2 lists the radial velocities measured using the two different sets of spectral lines. Individual velocities were extracted following the method of Tonry & Davis (1979), where parabolic fits where performed to the peak of the cross-correlation functions, and the uncertainties are purely statistical.
| HJD– | Phase | RV (H+He) (km s-1) | RV (He) (km s-1) | Obs. | ||
|---|---|---|---|---|---|---|
| 2452000 | Value | Value | ||||
| 483.7265 | 0.0878 | 48.3 | 2.3 | 37.6 | 2.7 | INT |
| 483.7336 | 0.0881 | 41.2 | 3.3 | 29.5 | 4.1 | INT |
| 484.7173 | 0.1252 | 41.1 | 4.5 | 34.6 | 5.5 | INT |
| 484.7250 | 0.1255 | 44.3 | 2.9 | 37.2 | 3.5 | INT |
| 485.6677 | 0.1611 | 31.0 | 2.4 | 22.1 | 2.9 | INT |
| 485.6735 | 0.1613 | 32.2 | 4.9 | 20.5 | 6.0 | INT |
| 486.6493 | 0.1982 | 22.5 | 2.3 | 11.4 | 2.6 | INT |
| 486.6593 | 0.1985 | 17.1 | 2.1 | 8.2 | 2.5 | INT |
| 487.6722 | 0.2368 | 15.6 | 3.0 | 4.1 | 3.5 | INT |
| 489.9708 | 0.3235 | 54.5 | 3.0 | 42.2 | 4.2 | McD |
| 490.9739 | 0.3614 | 47.4 | 0.8 | 42.3 | 1.0 | McD |
| 491.9774 | 0.3992 | 56.2 | 1.5 | 64.9 | 1.9 | McD |
| 712.3223 | 0.7154 | 57.8 | 9.4 | 41.8 | 11.6 | INT |
| 712.3278 | 0.7156 | 70.1 | 6.3 | 59.0 | 8.0 | INT |
| 737.6144 | 0.6700 | 60.0 | 1.1 | 40.0 | 1.1 | McD |
| 738.5838 | 0.7066 | 49.0 | 1.3 | 41.9 | 1.6 | McD |
| 738.6003 | 0.7072 | 40.1 | 1.2 | 36.7 | 1.4 | McD |
| 822.7259 | 0.8822 | 73.1 | 2.0 | 64.9 | 2.5 | INT |
| 823.7330 | 0.9202 | 58.2 | 1.9 | 49.9 | 2.3 | INT |
| 824.7324 | 0.9579 | 56.7 | 4.4 | 51.2 | 5.4 | INT |
| 825.7301 | 0.9956 | 45.2 | 2.4 | 34.4 | 2.9 | INT |
| 826.7322 | 0.0334 | 52.2 | 2.4 | 43.6 | 2.9 | INT |
| 827.7361 | 0.0713 | 36.3 | 1.9 | 28.7 | 2.3 | INT |
| 828.7309 | 0.1088 | 32.0 | 6.9 | 26.0 | 8.3 | INT |
| 989.3004 | 0.1690 | 31.5 | 6.3 | 12.1 | 8.2 | NOT |
| 990.2950 | 0.2065 | 29.6 | 4.8 | 21.3 | 5.8 | NOT |
| 991.2943 | 0.2442 | 38.1 | 4.9 | 23.5 | 6.0 | NOT |
The radial velocity curve was modelled with an eccentric orbital solution. This was accomplished using the sophisticated binary fitting program originally developed by Wilson & Devinney (1971; hereafter W-D)111The original code has suffered major upgrades since its first release, including significant improvements in the underlying physical models. The most recent version of the W-D program together with the relevant documentation can be found in ftp://astro.ufl.edu/pub/wilson/lcdc2003.. Briefly, the W-D program assumes a Roche model to describe the shape of the components and includes a complete treatment of the radiative properties of the system (limb darkening, temperature variations accross the surface, etc.). Thus, the model adequately takes into account the non-keplerian contributions to the measured radial velocities. Fitting is carried out through differential corrections and, in the case of radial velocity solutions, convergence is achieved very rapidly. In the solutions we adjusted the following orbital parameters: velocity semiamplitude (), systemic velocity (), eccentricity (), argument of the periastron (), and phase of the periastron (). A set of fixed parameters necessary to the fitting procedure were tuned to match the expected radiative properties of the B0 V optical companion (i.e., K, ; Cox 2000), although the effect of the adopted parameters on the solutions is very weak. Table 3 presents the final best-fitting parameters for the two sets of radial velocities.
| Parameter | H i+He i+He ii | He i+He ii (adopted) |
|---|---|---|
| e | 0.630.11 | 0.720.15 |
| (deg) | 7.813.9 | 21.012.7 |
| (km s-1) | 48.41.8 | 40.21.9 |
| 0.220.02 | 0.230.02 | |
| (km s-1) | 18.13.3 | 22.66.3 |
| (R⊙) | 7.41.6 | 8.22.9 |
| (M⊙) | 0.0076 | 0.0107 |
| (km s-1) | 7.8 | 8.5 |
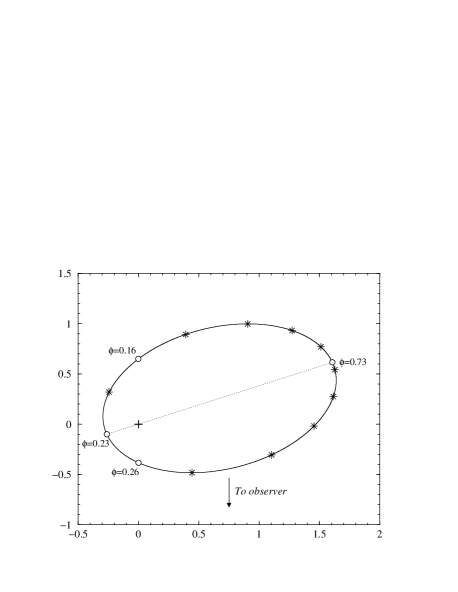
The two solutions yield orbital parameters that are consistent within except for the systemic velocity, which is more negative when the Balmer lines are included in the correlation. This suggests that the Balmer lines may be contaminated by some blueshifted absorption, consistent with the suspicion that the Be primary might have a significant wind. Therefore, we prefer to adopt the solution that considers the velocities derived from the He lines alone, which should be largely free from contaminating emission. Figure 1 shows these velocities, together with the best-fitting orbital solution. To better illustrate the resulting orbit, we show in Fig. 2 the relative motion of the compact object around the optical companion as seen from above (i.e., no inclination value assumed). Some relevant phases (i.e., periastron, apastron, and conjunctions) are labelled.

We can now use our orbital solution to Doppler-shift all the individual spectra and produce an average spectrum in the reference frame of the primary (see Fig. 3). This can be compared to the spectrum of the B0 V template Sco and we find that LS I +61 303 is best fitted when the template is scaled by a factor 0.65. In other words, the results indicate that the primary contributes 65 percent of the total light. The rest can possibly be attributed to emission from the disc around the Be star. The residual of the spectral subtraction indeed shows broad double-peaked Balmer emission features (i.e., characteristic of a disc geometry) with possible narrow reversal absorptions superimposed, in accordance with observations of Be-shell stars (e.g., Porter & Rivinius, 2003; Slettebak, 1988). However, inspection of high resolution H profiles published in literature (e.g. Paredes et al. 1994) show clear double-peaked profiles with shallow central absorptions, reminiscent of the intermediate inclination Be case proposed by Hanuschik (1996). Therefore, contamination of the residual Balmer profiles by shell lines can almost be ruled out and we interpreted the observed profiles as being shaped by kinematic (doppler) broadening.

4 Discussion
Our radial velocity data and orbital solution yields a number of orbital parameters but does not provide a full characterization of the system’s physical properties. For example, only the mass function and not the mass ratio can be determined because only the velocities of the optical component are measurable. In addition, the orbital inclination remains unknown as usual in any radial velocity curve solution. Thus, with the available data we can only plot Fig. 4 that relates the mass of the compact object () and the optical companion () for several values of the orbital inclination. Note that the plot has been computed with our adopted radial velocity solution that yields M⊙. To further constrain the system’s properties we must employ additional external information.
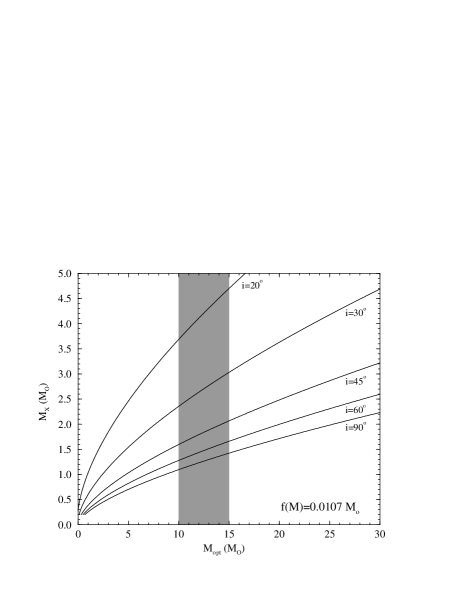


The expected masses of the components can be used to constrain the system’s geometry. For example, the mass of the optical component of the system can be inferred from its atmospheric properties. Discussions on the most likely mass values for the primary star can be found in Hutchings & Crampton (1981), Martí & Paredes (1995), Punsly (1999), and Massi et al. (2004), overall favouring a mass interval of 10–15 M⊙ (shaded area in Fig. 4). With this constraint, the compact object would be a neutron star for inclinations and a black hole if 25∘.
There are several options to obtain independent information on the inclination. For example, we have measured km s-1, which is about 3 times smaller than the value reported by Hutchings & Crampton (1981). We note that our instrumental resolution is higher than that of Hutchings & Crampton (83 km s-1 versus 130 km s-1), which would favour our determination. This is relevant for the orbital inclination (assuming that the Be star’s spin axis and the orbital axis are aligned) because current observational constraints indicate that Be stars rotate at 0.7–0.8 times222With a likelihood that this might be underestimated due to equatorial gravity darkening effects (see Townsend, Owocki & Howarth 2004, Porter & Rivinius 2003). the critical rotational velocity(Porter, 1996). In the case of the optical component of LS I +61 303 this would be 500–550 km s-1. Therefore, if the primary is a normal Be star, we are viewing the binary at a low inclination angle of 15–20∘ but we cannot rule out that the Be star may be rotating at substantially lower speed than . However, the lack of clear shell lines in our spectra, such as FeII 4584, points to a rough upper limit . A lower limit to the inclination of 10–15∘ is obtained from the restriction that the rotational velocity of the optical companion should not exceed 0.9 times the critical value. Perhaps future accurate modelling of the spectral line profiles could provide a better constraint on the viewing angle of the Be star and thus on the orbital inclination.
Additional information on the inclination might come from the geometry of the relativistic jet as derived from the VLBI images of Massi et al. (2004) by assuming perpendicularity between the ejection direction and the orbital plane. However, because of the possible precession reported by these authors, values in the full range 0–90∘ could be feasible.
To conclude with the discussion of the orbital inclination, it seems that a crude value of 30∘ (with an uncertainty of some 20∘) is the best compromise given the available constraints at this point. It is clear that further observations will be required to better define this important parameter of the system. With the current knowledge, both a neutron star and black hole are equally plausible as the compact object in the LS I +61 303 system.
But there is one very relevant parameter that is indeed well-constrained by our orbital solution, and that is the phase of the periastron passage. We obtain a value of , in good agreement with that obtained by Hutchings & Crampton (1981) (), when the phase origin is set by the radio ephemeris of Gregory (2002). A key question is how this periastron passage phase relates to the emission variability of LS I +61 303. There have been a number of studies of the occurrences of radio outbusts in LS I +61 303 and there is general consensus in that the radio emission peaks are distributed over a wide phase interval of about 0.45–0.95 (e.g., Paredes, Estalella & Rius 1990; Gregory & Neish 2002). In contrast, X-ray maxima seem to occur at somewhat earlier phases of 0.43–0.47, although this is based on only two observations. From three well-studied radio outbursts, Gregory (2002) was able to determine the phases at which the onset of the outbursts occurred and obtained values in the interval 0.33–0.40. With our new determination of the periastron phase, it is now clear that a delay exists beween the closest approach of the system’s components and the radio and X-ray outbursts. The onset of the outbursts appears to take place about 2.5–4 days after periastron passage. The delay is likely due to inverse Compton energy losses of relativistic electrons in the radio jets in the periastron vicinity (see Massi 2004b for details). This now well-established result has strong implications on the models devised to explain the emission behaviour of LS I +61 303.
5 Acknowledgments
We thank the anonymous referee for helpful comments to the manuscript. J. C. acknowledges support from the Spanish MCYT grant AYA2002-0036. I. R. acknowledges support from the Spanish Ministerio de Ciencia y Tecnología through a Ramón y Cajal fellowship. J. M. P. and J. M. acknowledge partial support by the DGI of the Ministerio de Ciencia y Tecnología (Spain) under grant AYA2001-3092, as well as partial support from the European Regional Development Fund (ERDF/FEDER). J. M. is also supported by the Junta de Andalucía (Spain) under project FQM322. MOLLY and DOPPLER software developed by T. R. Marsh is gratefully acknowledged. The INT is operated on the island of La Palma by the Royal Greenwich Observatory in the Spanish Observatorio del Roque de Los Muchachos of the Instituto de Astrofísica de Canarias (IAC). The NOT is operated on the island of La Palma jointly by Denmark, Finland, Iceland, Norway and Sweden in the Spanish Observatorio del Roque de Los Muchachos of the IAC.
References
- Bosch-Ramon & Paredes (2004) Bosch-Ramon V., Paredes J.M., 2004, A&A, 425, 1069
- Cox (2000) Cox, A.N., ed. 2000, Allen’s Astrophysical Quantities, 4th Edition. AIP and Springer-Verlag, New York
- Frail & Hjellming (1991) Frail D.A., Hjellming R.M., 1991, AJ, 101, 2126
- Gray (1992) Gray D.F., 1992, The Observation and Analysis of Stellar Photospheres. CUP, Cambridge
- Gregory (2002) Gregory P.C., 2002, ApJ, 575, 427
- Gregory & Neish (2002) Gregory P.C., Neish C., 2002, ApJ, 580, 1133
- Gregory & Taylor (1978) Gregory P.C., Taylor A.R., 1978, Nature, 272, 704
- Gregory et al. (1989) Gregory P.C., Xu H., Backhouse C.J., Reid A., 1989, ApJ, 339, 1054
- Hardorp & Scholz (1970) Hardorp J., Scholz, M., 1970. ApJS, 19, 193
- Hartman et al. (1999) Hartman R.C. et al., 1999, ApJS, 123, 79
- Horne (1986) Horne K., 1986, PASP, 98, 609
- Hutchings & Crampton (1981) Hutchings J.B., Crampton D., 1981, PASP, 93, 486
- Marsh et al. (1994) Marsh T.R., Robinson E.L., Wood J.H., 1994, MNRAS, 266, 137
- Martí & Paredes (1995) Martí J., Paredes J.M., 1995, A&A, 298, 151
- Massi (2004a) Massi M., 2004a, A&A, 422, 267
- Massi (2004b) Massi M., 2004b, in Bachiller R., Colomer F., Desmurs J.F., de Vicente P., eds., Proceedings of the 7th European VLBI Network Symposium. p. 215
- Massi et al. (2004) Massi M., Ribó M., Paredes J.M., Garrington S.T., Peracaula M., Martí J., 2004, A&A, 414, L1
- Mendelson & Mazeh (1989) Mendelson H., & Mazeh T., 1989, MNRAS, 239, 733
- Paredes (1987) Paredes J.M., 1987, PhD thesis, Universitat de Barcelona
- Paredes & Figueras (1986) Paredes J.M., Figueras F., 1986, A&A, 154, L30
- Paredes et al. (1990) Paredes J.M., Estalella R., Rius A., 1990, A&A, 232, 377
- Paredes et al. (1994) Paredes J.M. et al., 1994, A&A, 288, 519
- Paredes et al. (1997) Paredes J.M., Martí J., Peracaula M., Ribó M., 1997, A&A, 320, L25
- Paredes et al. (2000) Paredes J.M., Martí J., Ribó M., Massi M., 2000, Science, 288, 2340
- Porter (1996) Porter J.M., 1996, MNRAS, 280, 31
- Porter & Rivinius (2003) Porter J.M., Rivinius Th., 2003, PASP, 115, 1153
- Punsly (1999) Punsly B., 1999, ApJ, 519, 336
- Slettebak (1988) Slettebak A., 1988, PASP, 100, 770
- Stickland & Lloyd (1995) Stickland D.J., Lloyd C., 1995, Observatory, 115, 90
- Taylor & Gregory (1982) Taylor A.R., Gregory P.C., 1982, ApJ, 255, 210
- Tonry & Davis (1979) Tonry J., Davis M., 1979, AJ, 84, 1511
- Townsend et al. (2004) Townsend R.H.D., Owocki S.P., Howarth I.D., 2004, MNRAS, 350, 189
- Tull et al. (1995) Tull R.G., MacQueen P.J., Sneden C., Lambert D.L., 1995, PASP, 107, 251
- Wilson & Devinney (1971) Wilson R.E., Devinney E.J., 1971, ApJ, 166, 605 (W-D)