An XMM-Newton observation of Mkn 3 - a Seyfert galaxy just over the edge
Abstract
A 100ks XMM-Newton observation of the nearby Seyfert 2 galaxy Mkn 3 offers a unique opportunity to explore the complexity of its X-ray spectrum. We find the 3–8 keV continuum to be dominated by reflection from cold matter, with fluorescent K-shell lines detected from Ni, Fe, Ca, Ar, S, Si and Mg. At higher energies an intrinsic power law continuum, with canonical Seyfert 1 photon index, is seen through a near-Compton-thick cold absorber. A soft excess below 3 keV is found to be dominated by line emission from an outflow of ‘warm’ gas, photo-ionised and photo-excited by the intrinsically strong X-ray continuum. Measured blue-shifts in the strong Fe K and OVII and VIII emission lines are discussed in terms of the properties of the putative molecular torus and ionised outflow.
keywords:
galaxies: active – galaxies: Seyfert: general – galaxies: individual: Mkn 3 – X-ray: galaxies1 Introduction
Mkn 3 is a low redshift, (Tifft and Cocke 1988), Seyfert 2 galaxy and one of the intrinsically brightest AGN above 10 keV (Cappi et al. 1999). However, absorption by a large column density of intervening cold matter (the torus?) results in very little of the intrinsic X-ray continuum being directly visible. Instead, previous X-ray studies with ASCA(Turner et al. 1997a) and BeppoSAX(Cappi et al. 1999) have suggested the observed X-flux over the 2-10 keV band is dominated by indirect radiation ‘reflected’ (ie re-directed by scattering in optically thick matter) into the line of sight. An extended soft X-ray emission component was resolved in an early Chandra observation (Sako et al. 2000), which also showed the soft X-ray spectrum to be dominated by blue-shifted line emission from highly ionised gas. Mkn 3 is a particularly interesting object, being one of the small number of Seyfert 2 galaxies to exhibit broad optical emission lines in polarised light (Miller and Goodrich 1900, Tran 1995), while the observation of biconical [OIII] emission (Pogge and de Robertis 1993, Capetti et al. 1995, 1999) also provides evidence for an extended region of ionised gas. Soft X-ray spectra of Mkn 3 have particular potential in studying an ionised outflow in Mkn 3 since it is one of the few bright Seyfert 2 galaxies not significantly ‘contaminated’ by starburst X-ray emission (Pogge and De Robertis 1993, Turner et al. 1997b).
In this paper we present an analysis of archival data from an early XMM-Newton observation of Mkn 3, which have not hitherto been published.
2 Observation and data reduction
Mkn 3 was observed by XMM-Newton on 2000 October 19-20 throughout orbit 158. We use X-ray spectra from the EPIC pn (Strüder et al.2001) and MOS (Turner et al. 2001) cameras, and the Reflection Grating Spectrometer/RGS (den Herder et al. 2001). Both EPIC cameras were operated in the full frame mode, together with the medium filter. The X-ray data were first screened with the SAS v6.1 software and events corresponding to patterns 0-4 (single and double pixel events) were selected for the pn data and patterns 0-12 for the MOS data. EPIC source counts were taken within a circular region of 45′′ radius about the centroid position of Mkn 3, with the background being taken from a similar region, offset from but close to the source. The net exposures available for spectral fitting were 76.5 ksec (pn), 136.5 ksec (combined MOS), 105.3 ksec (RGS1) and 102.0 ksec (RGS2). Since no obvious variability was evident throughout the observation, spectral data were then integrated over the full exposures and binned to a minimum of 20 counts per bin, to facilitate use of the minimalisation technique in spectral fitting. Spectral fitting was based on the Xspec package (Arnaud 1996)and all spectral fits include absorption due to the Mkn 3 line-of-sight Galactic column of (Stark et al. 1992). Errors are quoted at the 90% confidence level ( for one interesting parameter).
3 The hard (3-15 keV) EPIC spectrum
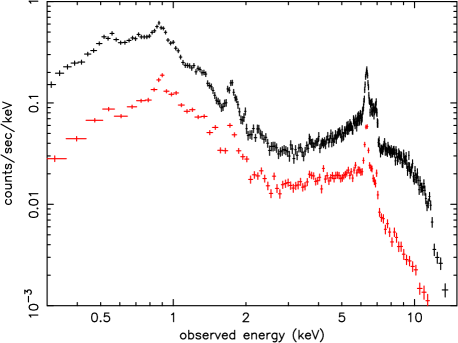
Figure 1 shows the background-subtracted EPIC camera data integrated over the full observation of Mkn 3. The spectrum is seen to be highly structured and sufficiently hard to be detected to 15 keV (pn) and 11.5 keV (MOS). Given previous reports of a physically separate soft spectral component below 3 keV we initially restricted modelling of the EPIC spectrum to the hard X-ray (3–15 keV) band. A power law fit above 3 keV is poor but indicates the observed spectrum to be very hard, with a photon index -0.6. The more complex spectral model proposed by Turner et al.(1997a) in analysing the ASCA observation of Mkn 3, and subsequently adopted by Cappi et al.(1999) for their BeppoSAX analysis, was found to fit the data well. In that model the hard X-ray continuum is a composite of a ‘canonical’ Seyfert power law of photon index 1.8, attenuated by a near-Compton-thick absorber, and an unabsorbed reflection component. In addition the model contains an intense Fe K line conceivably arising by fluorescence in the same matter responsible for the continuum reflection.
In fitting this model to the EPIC data the principal power law and Fe K line parameters were left free and untied for the pn and MOS fits. Cold reflection was modelled with PEXRAV in Xspec (Magdziarz and Zdziarski 1995), with a reflection factor R (= /2, where is the solid angle subtended by the reflector at the continuum source) left free, but common to both pn and MOS fits. The high energy cut-off of the incident power law was set at 200 keV (Cappi et al. 1999), and the viewing angle (to the reflector) at the default value of 60∘. Element abundances were set to be solar. An excellent fit (=1327 for 1336 degrees of freedom) was obtained for a photon index of 1.82 (pn) and 1.74 (MOS), attenuated by a column of cold gas of NH cm-2. The dominant reflection continuum was represented by R = 1.70.1. The Fe K emission line was well-fitted in the pn data by a gaussian at 6.4170.004 keV (Mkn 3 rest-frame), of width =459 eV and flux=3.80.3 photons cm-2 s-1 . The corresponding Fe K line parameters from the MOS spectral fit were 6.4170.004 keV, =3811 eV and flux 4.70.4 photons cm-2 s-1. The line equivalent width was 60050 eV (pn) and 65055 eV (MOS) compared with the local continuum. This best-fit model for the 3–15 keV spectrum of Mkn 3 is reproduced in figure 2. Compared only with the reflection continuum we note the EW of the Fe K line increases to 105080 eV(pn)and 1150100 eV (MOS).
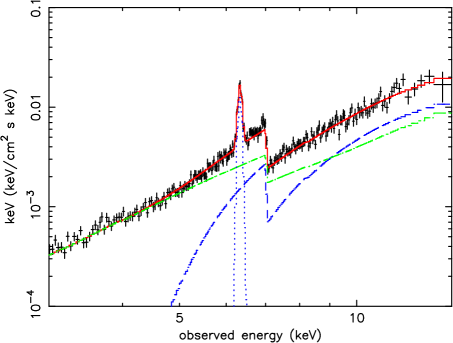
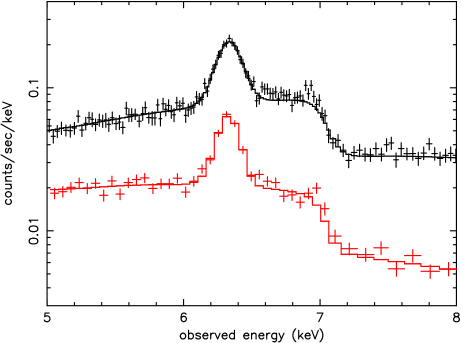
Comparing the EPIC data with the above model in the neighbourhood of the Fe K line (figure 3) reveals excess flux to higher energies, with a small peak near 7 keV. Adding a second gaussian to the model finds a narrow line at 7.070.03 keV (AGN rest frame), with a flux of 3.21.8 photons cm-2 s-1 and EW110 eV (cf. the reflection continuum), an addition which improves the fit to =1301/1333 dof. Both the energy and relative strength are consistent with this being the Fe K line, rather than FeXXVI Ly proposed in the ASCA analysis (Turner et al. 1997a). The additional excess flux at 6.5–6.8 keV was then modelled by a third narrow gaussian line at 6.690.05 keV (AGN rest frame), with a flux of 1.5 photons cm-2 s-1 and EW40 eV (cf. the reflection continuum), further improving the fit to =1292/1330 dof. We note the energy of this emission line is close to that of He-like Fe. Finally, the small excess apparent near 7.5 keV lies close to the energy of Ni K emission. The addition of a fourth gaussian gave a further small improvement to the fit (=1285/1327 dof) with a line energy (rest frame) of 7.50.1 keV (compared with the laboratory energy of neutral Ni K of 7.47 keV), flux of 2 photons cm-2 s-1 and EW60 eV. Finally, we note figure 3 shows no evident Compton shoulder on the low energy wing of the Fe K line, which should occur by down-scattering when the re-processing matter is optically thick to electron scattering. We return to this point in the next Section.
Based on the above broad band spectral fit we find an 3-15 keV flux for Mkn 3 of erg cm-2 s-1. Correcting for the measured absorption the 3-15 keV flux increases to erg cm-2 s-1, corresponding to an luminosity of erg s-1 ( km s-1 Mpc-1). For later reference, extending that intrinsic power law spectrum to 0.3 keV would give a (0.3-15 keV) luminosity of erg s-1.
3.1 A Compton shoulder to the Fe K line
The absence of an obvious Compton shoulder on the low energy wing of the strong Fe K line is physically inconsistent with the observed level of re-processing either by reflection or by transmission through a near-Compton-thick absorber (Matt 2002). The width of the line is also a surprise if interpreted as due to velocity dispersion in matter on the far inner face of the molecular torus. However, during the course of the present analysis we learned from MPE-MPG of a problem with pn counts where the photon energy is deposited in two adjacent pixels, the so-called ‘doubles’, whereby the registered photon energy can be 20 eV greater than for the same photon fully absorbed in a single pixel (K Dennerl, private communication). To test the importance of such effects on the present analysis we have repeated our fitting of the Fe K line using only single pixel (pat0) counts for the pn camera.
For the pn pat0 data we initially fitted a narrow gaussian line (ie with only the CCD resolution of =65 eV) to the Fe K peak, allowing the energy and flux to be free. Figure 4 (top) shows how the narrow line then fits the high energy wing of the observed line while leaving an excess on the low energy side. A second gaussian component was then added, at an energy 0.1 keV lower than the Fe K line, as expected for single Compton scattering in cold, optically thick matter (Matt 2002), and iterated with the Fe K line width and fluxes free. While the double-gaussian fit (figure 4, bottom) was statistically no improvement on the original single-gaussian fit to the Fe K line, the relative strength of the Compton shoulder component to the primary Fe K line (20 percent) now gives a physically consistent overall picture of a reflection-dominated hard X-ray spectrum for Mkn 3. The above procedure was then repeated for the MOS data, again finding an acceptable fit with a 25 percent Compton component to the Fe K line (figure 5).


3.2 Fe K line width and energy
Allowing for the Compton shoulder has the important consequence that the primary Fe K line is now only marginally resolved, with a formal width of =3015 eV in both pn and MOS fits. However, the primary line energy is , and though the addition of the Compton component increases the errors, the primary line remains significantly blue-shifted, at 6.430.01 eV (Mkn 3 rest-frame) for both pn pat0 and MOS data. Since fluorescent line emission will be produced in the cold reflector and the nuclear absorbing column, it is reasonable to test for a common velocity. To do so we first fixed the Fe K line energy at 6.40 keV, the fit then worsening by =43 for 1 additional dof. Allowing the redshift of the line in Xspec to be free recovered the initial fit (=1285/1327 dof), with the effective redshift falling (from z=0.0135) to (1.070.05). Tying the redshift of the cold absorber to that of the Fe K line gave a further improvement to the 3–15 keV fit (= 15) with a tied ‘redshift’ of (1.050.04). Tying the redshift of the reflector to that of the line did not give a comparable improvement in the fit, though this was less well constrained. This test does suggest that a significant fraction of the Fe K line comes from the obscuring matter, which must then subtend a substantial solid angle to the primary source. That geometry would, in turn, offer a possible velocity-dispersion explanation for the observed line width.
3.3 Other spectral features in the EPIC data
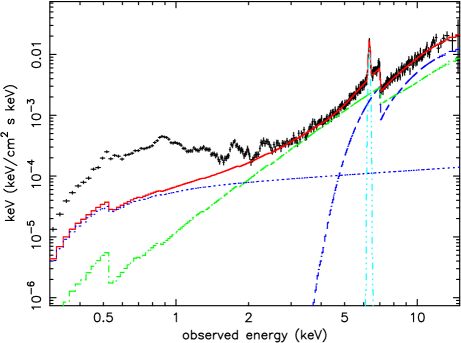
Extending the above hard X-ray (3-15 keV) model fit below 3 keV reveals a marked and highly structured ‘soft excess’. This excess remains (figure 6) after the addition of a second (unabsorbed) power law component, with photon index fixed to the primary hard X-ray power law, intended to model any continuum scattered into the line of sight by the ionised gas responsible for the polarised optical lines in Mkn 3. The inclusion of this unabsorbed power law component did, however, reduce the cold reflection factor to R = 1.20.1. In the subsequent EPIC analysis we retain this amended 3-15 keV spectral fit.
The soft excess illustrated in figure 6 is found to have an flux (0.3-3 keV) of erg cm-2 s-1. Allowing for the significant attenuation by the Galactic column of cm-2 increases this by 50 percent, corresponding to an intrinsic soft X-ray luminosity over this energy band of erg s-1 ( km s-1 Mpc-1).
The reflection-dominated fit to the hard X-ray spectrum of Mkn 3 suggests that fluorescent line emission from lighter, abundant metals might be visible at lower energies, contributing to the spectral structure seen in figure 6. An initial examination of those pn camera data shows that the strong peaks near 2.3 and 1.8 keV do lie close to the K line energies of S and Si, respectively. It is important to note that these features are much stronger than any calibration uncertainties associated with the Si-K and Au-M edges in XMM-EPIC. Similar structure is seen in the MOS spectrum and we proceed to study those data in more detail, since in the soft X-ray band the MOS statistics are comparable to the pn camera while the energy resolution is better. [The 1 resolution of the MOS at the time of the Mkn 3 observation was 34 eV at 1.5 keV (M.Kirsch, XMM-SOC-CAL-TN-0018 issue 2.3, 28 July 2004)].
Closer examination of the low energy excess in the MOS spectrum confirms that the neutral K lines of Si, S, Ca and (probably) Ar are detected (figure 7). Table 1 compares the parameters of these lines, determined in Xspec, with their laboratory energies and also with predicted equivalent widths for a cold solar abundance reflector (Matt et al. 1997). The general agreement of observed and predicted line strengths in Table 1 is good and provides further support for the reflection-dominated description of the hard X-ray continuum of Mkn 3.
In addition to revealing several fluorescent lines, the MOS spectrum of Mkn 3 clearly resolves the principal resonance emission lines of highly ionised ions of Si and S, as well as of Mg, Ne and O. The unusual richness of the EPIC spectral data at these low energies is a consequence of the strong continuum source being hidden from direct view in Mkn 3. We examine this same spectral band with the higher resolution RGS data in Section 4.


| Line | Esource | Elab | EWobs(eV) | EWest(eV) |
|---|---|---|---|---|
| Ni K | 7.50.1 | 7.470 | 60 | 85 |
| Fe K | 6.430.01 | 6.400 | 1100 | 1200 |
| Ca K | 3.750.07 | 3.690 | 45 | 45 |
| Ar K | 2.950.06 | 2.957 | 65 | 55 |
| S K | 2.330.05 | 2.307 | 140 | 165 |
| Si K | 1.750.05 | 1.740 | 200 | 230 |
4 Spectral lines in the RGS data
The EPIC pn and MOS spectra of Mkn 3 show a ‘soft excess’ below 3 keV which contains both fluorescent emission from relatively cold matter and line emission from highly ionised gas. We provisionally associate the latter with the extended soft X-ray emission resolved in the Chandra observation of Mkn 3 (Sako et al. 2000). To better quantify the soft X-ray spectrum of Mkn 3 we now examine the simultaneous XMM-Newton grating data.
We find the soft X-ray spectrum of Mkn 3 appears very similar to that of another nearby Seyfert 2 galaxy NGC 1068 (Kinkhabwala et al.2002), being dominated by line emission from highly ionised stages of the lighter metals. Unfortunately, the fluxes are an order of magnitude less, mainly due to Mkn 3 lying at a greater distance, but also being significantly attenuated at the longer wavelengths by the relatively large Galactic column in the direction of Mkn 3. Nevertheless, visual examination of the RGS spectrum does allow the main properties of an ionised outflow to be determined, adding to the picture reported by Sako et al. (2000).
Figures 8–11 display the fluxed, background-subtracted RGS spectrum, combining both RGS-1 and RGS-2 data sets. The data are binned at 40 mÅ, comparable to the intrinsic resolution of the RGS. It is immediately evident that the spectrum is dominated by line emission and - except perhaps at the shortest wavelengths - the continuum level is low, consistent with the weak, unabsorbed power law component in the EPIC spectral fit.


4.1 An emission line spectrum from a highly ionized gas.
The shortest wavelength sections of the RGS spectrum overlap that resolved by the MOS camera and find good qualitative agreement for the main emission lines of S, Si, and Mg. Furthermore, the MOS identifications of the strong 0.9 keV feature - and the smaller peak near 1 keV - with the resonance lines of NeIX and NeX, respectively, are supported by the higher resolution grating spectra.
The RGS spectrum is characteristic of a recombining photoionised gas, the strongest emission lines being identified with resonance transitions in He- and H-like ions of the most abundant elements for this waveband, viz. Si, Mg, Ne, O and N. The relative weakness of Fe-L emission, together with the detection of narrow radiative recombination continuum (RRC) of OVII, OVIII and probably of CVI, indicates the gas is relatively cool (kT6eV) and collisional ionisation/excitation unimportant.
Marked on figures 8–11 are the laboratory wavelengths of the identified lines (adjusted for the redshift of Mkn 3), showing the observed lines are generally shifted towards the blue. Table 2 lists the observed wavelengths and fluxes of the principal lines.
To better quantify the blue-shift of the emission lines and also derive other parameters of the emitting plasma we fitted gaussians to the fluxed spectra, now binned at 20mÅ, for the strong OVII triplet and the OVIII Ly line (figures 12 and 13). The measured blue-shifts are: OVII-r (0.0320.007Å), OVII-f (0.0370.005Å) and OVIII (0.0290.005Å), corresponding to line-of-sight velocities of 44095, 50070 and 45075 km s-1, respectively.


Assuming a common gaussian profile for the above lines yielded an observed width of 8511 mÅ (FWHM). Allowing for the RGS1 resolution of 5 mÅ (FWHM), we find the OVII and VIII emission lines are broadened by 12 mÅ (FWHM). Assuming velocity broadening that corresponds to a velocity dispersion of 180 km s-1.
In the OVII triplet (figure 12) the forbidden line is significantly stronger than the resonance line, with the intercombination lines being relatively weak. While it is possible - perhaps probable - that the resonance line in OVII is affected by core absorption (see Section 5.2) the strong forbidden line is consistent with emission from a photoionised gas in ‘the low density regime’, viz ne1010 cm-3 (Porquet and Dubau 2000). We discuss other information that can be deduced from the well-determined OVII triplet in Section 5.2.
The suggestion of a ‘blue wing’ to the stronger emission lines is interesting. This is most noticeable for OVIII Ly (figure 13), where there is no competing line blend, but can also be seen in the resonance lines of OVII and NeIX. If interpreted as a higher velocity component to the relevant emission line the corresponding projected outflow velocity would be 3000 km s-1. We return to this possibility in Section 6.
| Line | source | lab | flux | log |
|---|---|---|---|---|
| SiXIV Ly | 6.160.04 | 6.18 | 82 | 2.6 |
| SiXIII 1s-2p (r) | 6.620.07 | 6.65 | 42 | 2.1 |
| SiXIII 1s-2p (f) | 6.710.05 | 6.74 | 62 | 2.1 |
| Si K | 7.110.03 | 7.13 | 102 | - |
| MgXII Ly | 8.390.05 | 8.42 | 83 | 2.3 |
| MgXI 1s-2p (r) | 9.140.03 | 9.17 | 72 | 2.0 |
| MgXI 1s-2p (f) | 9.270.05 | 9.31 | 52 | 2.0 |
| Mg K | 9.870.04 | 9.89 | 52 | - |
| NeX Ly | 12.110.03 | 12.13 | 92 | 2.0 |
| FeXX 2p-3d | 12.830.02 | 12.84 | 42 | 2.4 |
| NeIX 1s-2p (r) | 13.430.03 | 13.45 | 82 | 1.5 |
| NeIX 1s-2p (f) | 13.68 0.05 | 13.70 | 62 | 1.5 |
| FeXVII 2p-3d | 14.980.04 | 15.01 | 72 | 1.8 |
| OVIII Ly | 15.970.03 | 16.01 | 51 | 1.6 |
| FeXVII 2p-3s | 17.03 0.03 | 17.06 | 72 | 1.8 |
| OVII 1s-3p | 18.600.03 | 18.63 | 51 | 1.0 |
| OVIII Ly | 18.940 0.005 | 18.969 | 223 | 1.6 |
| OVII 1s-2p (r) | 21.570 0.007 | 21.602 | 92 | 1.0 |
| OVII 1s-2p (i) | 21.78 0.04 | 21.80 | 41 | 1.0 |
| OVII 1s-2p (f) | 22.0580.005 | 22.095 | 224 | 1.0 |
| NVII Ly | 24.770.03 | 24.78 | 92 | 1.3 |
| NVI 1s-2p (r) | 28.710.05 | 28.80 | 83 | 0.7 |
5 Discussion
5.1 A reflection-dominated hard X-ray spectrum
Our analysis of the EPIC data confirms and refines the model proposed by Turner et al.(1997) and later adopted by Cappi et al.(1999) in their respective analyses of ASCA and BeppoSAX observations of Mkn 3. The improved quality of the EPIC spectra are significant in several respects. First, observing the hard X-ray spectrum to 15 keV allows the absorbed power law and reflection components to be separated and quantified, for the first time within a single data set. This confirms Mkn 3, one of the brightest AGN in the hard X-ray sky, to have an intrinsic power law continuum typical of a Seyfert 1 nucleus, but attenuated by a near-Compton-thick absorber of cold matter, resulting in the observed X-radiation at 3–8 keV being dominated by cold reflection. Second, the fluorescence line emission of all abundant elements from Ni to Si (and possibly Mg) are detected, consistent with the reflection-dominated model. Third, the Fe K line is sufficiently well determined to indicate a small but significant ‘blue-shift’. We find no evidence for an absorption edge at 8.4 keV reported in an independent analysis of the ASCA data by Griffiths et al.(1998). Conversely, the edge energies for both the absorber and reflector lie close to 7.1 keV, appropriate to near-neutral Fe.
Removing the pn double-pixel counts, and including a Compton shoulder, reduces the apparent width of the Fe K line in the pn data to a ‘marginally resolved’ =3215 eV. Allowing for the Compton shoulder in the MOS fit makes the line width similarly marginal. However, inclusion of the Compton scattered component the energy of the primary line, which now lies in the range 6.430.01 keV (at the redshift of Mkn 3) in both pn and MOS data, compared with a laboratory energy (weighted mean of K1 and K2) of 6.40 keV. With an absolute error of 5 eV for the MOS and 10 eV for the pn camera (XMM-SOC-CAL-TN-0018), we conclude the line is ‘blue-shifted’ by 3010 eV. If that shift were due to the ionisation state of the reflecting matter it would correspond to Fe XV - XVIII (House 1969); however that would show the Fe K edge energy 7.5 keV, in conflict with the value observed. The most obvious alternative is a velocity shift with a projected (line of sight) velocity of 32001100 km s-1. We note that neither the line energy nor (marginally resolved) line width of Fe K in Mkn 3 sit comfortably with cold reflection from the unobscured far-side inner wall of the putative molecular torus. Interestingly, Iwasawa et al (1994) also found a blue-shifted Fe K line in the ASCA spectrum, and - furthermore - claimed the line flux to vary over a 3.5 year interval. Griffiths et al.(1998) also concluded the Fe K line flux fell by a factor 1.8 between GINGA and ASCA observations in 1989 and 1993. On the other hand Sako et al (2000) reported a K line at 6.3910.004 keV (before allowing for any Compton shoulder) from an early Chandra HETG observation, with a width of 364 eV.
Taken overall, the form of the ‘cold’ reprocessor indicated by the EPIC spectra is unclear. The strong reflection continuum and 1 keV EW Fe K line match well with an origin in the exposed far inner wall of a torus, the near side of which forms the absorbing barrier to the primary power law source. However, the observed Fe K line energy - and similar blue-shift of the Fe K edge in the absorber - suggests a significant part of the fluorescent emission may arise in cold, dense ‘clouds’ in the same ‘near-side’ outflow that also obscures the continuum source from direct view in Mkn 3.
5.2 Extended photoionised gas in Mkn 3.
The RGS spectrum of Mkn 3 is dominated by narrow emission lines and RRC of highly ionised gas. The agreement with the Chandra observation reported by Sako et al. (2000) is good, consistent with the conclusion of those authors that both photoionisation/recombination and photo-excitation/radiative emission are important in the soft X-ray spectrum of Mkn 3. While not affecting that basic conclusion the independent determination of line energies and fluxes with the RGS is useful, given the low count rates in both observations. The characteristics of the RGS and Chandra HETGS are also complementary, with the former having higher sensitivity for the important OVII and VIII lines (with 100-200 counts per line) while the HETGS extends the high resolution spectrum to much higher energies. The RGS data longward of 12 Å shows the underlying continuum to be negligible, consistent with the broad-band EPIC fit (eg figure 3) which includes a (maximum) power law component of 1 percent of the intrinsic power law. If electron scattering from the ionised outflow produces the polarised broad emission lines seen in the optical spectrum of Mkn 3 (Miller and Goodrich 1990, Tran 1995), our upper limit to the unabsorbed power law component constrains the product C to be 0.01, where C is the covering factor of the ionised outflow and its optical depth in the line of sight.
Further information on the ionised gas can be obtained from the emission line spectrum. The observed intensity of the forbidden (22.1 Å) line of OVII is a useful measure, since it is unaffected by resonance absorption. Assuming a solar abundance of oxygen, with 25 percent in OVII, 50 percent of recombinations from OVIII direct to the ground state, and a recombination rate at kT 6 eV (from the corresponding RRC width) of cm3 s-1 (Verner and Ferland 1996), we estimate an emission measure of order cm-3. The ion species listed in Table 3 suggest the co-existence of gas over a wide range of ionisation, yielding a total emission measure a factor several higher. The extent of the emission region is not directly constrained by the line intensities or ionisation parameter, but given the Seyfert 2 nature of Mkn 3 a reasonable minimum radius is r1 pc ( cm). With the emission volume approximated by a cylinder of radius r and length 10r, a uniform density gas would then have ne cm-3.
The ionisation parameter (= L/nr2) provides a check on those simple estimates, where L is the (unabsorbed) X-ray continuum flux irradiating the outflow. The EPIC spectral fit found L(0.3 keV) erg s-1, giving an ionisation parameter 30 erg cm s-1 at r=5 pc, a value at which OVII and OVIII would both be prominent. In fact, the detection of He-like NVI and H-like SiXIV in the RGS spectrum shows the emitting gas must cover a wide range of ionisation parameter, those ions having peak abundances at of 5 erg cm s-1 and 400 erg cm s-1, respectively. Assuming the ionised Si and Ca emission lines detected in the MOS spectrum arise in the same outflow requires still more highly ionised gas, while the excess flux in the EPIC data at 6.6-6.8keV, if correctly attributed to emission from FeXXV, extends that range to 1000 erg cm s-1. Such a broad ionisation structure, where the distance to the ionising source is constrained to rrBLR, suggests an inhomogeneous gas with a correspondingly broad range of density. While the present spectra are clearly inadequate to allow such a complex ionised outflow to be mapped it is possible to estimate several additional parameters.
Line ratios in the He-like triplet are an establised diagnostic of ionised plasmas. In the RGS spectrum of Mkn 3 the OVII triplet is well defined, with the forbidden (f), resonance (r) and intercombination (i) lines all detected (figure 12). The observed line strengths are in the ratio 22:9:4 yielding values of the diagnostic parameters R(=f/r+i)5 and G(=f+i/r)3, rather high and low, respectively, compared with the calculated ratios for a pure, low density photoionised plasma (Porquet and Dubau 2000). More recent calculations, which take account of the column density and ionisation parameter in the radiating gas (Godet et al. 2004), yield G=3 for OVII for a column density of order NH cm-2 and = 30-100 erg cm s-1. Encouragingly, that column is of the same order as the product ner in the above simple fit to the calculated emission measure, and also to the estimated scattering for a covering factor of 0.1. In particular the resonance line of OVII (21.6 Å) will be optically thick in the core, limiting the effects of photo-excitation in comparison with higher order lines. We note also that the observed f:r line ratios are lower in the Ne and Mg triplets, suggesting the opacity effects there are less.
The mass of the (observed) extended gas envelope is 900, assuming a uniform density. With a projected outflow velocity, observed at 45 degrees to the line of sight, of 700 km s-1, the mass outflow rate is then 0.04 yr-1, with an associated mechanical energy of erg s-1. These estimates would be reduced if the emitting gas is indeed clumpy.
From the absorption-corrected 2–10 keV luminosity of erg s-1 we estimate a bolometric luminosity for Mkn 3 of erg s-1. At an accretion efficiency of 0.1 the accretion mass rate is then 0.06 yr-1. Thus, as may generally be the case in Seyfert 1 galaxies, we find the ionised outflow in Mkn 3 carries a significant mass loss from the AGN. However, at least by a radial distance rrBLR, the kinetic energy in the outflow is relatively small, even compared to the soft X-ray luminosity.
6 Conclusions
XMM-Newton EPIC observations of high statistical quality confirm previous findings that the extremely hard (2–10 keV) power law index in the Seyfert 2 galaxy Mkn 3 is due to strong continuum reflection from ‘cold’ matter. The intrinsic power law, which is seen through a near-Compton-thick absorber, emerges above 8 keV and has a photon index typical of Seyfert 1 galaxies. The dominant reflection component in Mkn 3 appears to be unaffected by the large absorbing column, allowing fluorescent line emission to be detected from Ni K (7.5 keV) down to Mg K (1.25keV).
The combination of a large column density obscuring the continuum source with the visibility of a large area of cold reflector suggests that Mkn 3 is being viewed at an inclination which cuts the edge of the obscuring screen. This would be consistent with the geometry of ‘Seyfert galaxies on the edge’, identified in a recent extensive review of the optical polarisation properties of Seyfert galaxies (Smith et al. 2002, 2004). Comparison with the XMM-Newton spectrum of NGC4051 (eg Schurch et al. 2003) suggests that well-studied Seyfert 1 galaxy may be inherently similar but is being viewed from the other (lower obscuration) side of a (blurred) edge.
The strong Fe K line appears to be ‘blue-shifted’ in both EPIC pn and MOS spectra, indicating an origin in low ionisation matter with a projected outflow velocity of 31001100 km s-1. Although less well resolved after the inclusion of a Compton shoulder, the Fe K line has a formal width of 32001600 km s-1 (FWHM). The projected velocity and indicated velocity dispersion are both inconsistent with an origin at the far inner wall of a torus of r1 pc. It seems more likely that a large fraction of the neutral K emission arises in dense matter circulating or outflowing at a radial distance more typical of the BLR clouds. For comparison, we note that Tran (1995) found the FWHM of H in polarised light to be 6000 km s-1 in Mkn 3.
Below 3 keV a ‘soft excess’ emerges above the hard, reflection-dominated continuum. Spectral structure is resolved in both EPIC and RGS data, with the MOS spectrum showing remarkable detail. In this soft X-ray band the spectrum is found to be dominated by resonance lines of He- and H-like Si, Mg, Ne, O and N, with an observed blue-shift of 47070 km s-1, indicating an origin in a highly ionised outflow extending above the Seyfert 2 absorbing screen.
Relative line fluxes and the detection of narrow (low temperature) radiative recombination continua of OVII, OVIII and (probably) CVI are all consistent with the gas being photo-ionised/photo-excited by the intrinsic power law continuum, as found by Sako et al. (2000). In all these respects the soft X-ray emitting gas in Mkn 3 is very similar to that seen in another nearby, and still brighter, Seyfert 2 galaxy NGC1068 (Kinkhabwala et al. 2002). As those authors pointed out, the ionised outflow seen in emission in NGC1068 - and in Mkn 3 - is consistent with that typically seen in absorption against the power law continuum in Seyfert 1 galaxies. The soft X-ray luminosity in Mkn 3 is of order 1% of the intrinsic (absorption corrected) 0.3-10 keV luminosity.
It is interesting to compare that figure with the ‘non-varying’ component of the soft X-ray excess found in the Seyfert 1 galaxies (NGC 4051, Pounds et al. 2004a) and 1H0419-577 (Pounds et al. 2004b), where soft X-ray luminosities of 5% and 9% of the dominant power law component were indicated. It was suggested in those papers that a large part of the non-varying soft flux might be explained by the same outflow usually seen in absorption. For that explanation to hold up it would appear that a bright inner region, shielded from direct view in a Seyfert 2 such as Mkn 3, must have a sufficiently high velocity dispersion to remain undetected in high resolution absorption spectra. Interestingly, Gierlinski and Done outlined an extreme case of such a scenario in proposing an absorption-based alternative to the strong soft excess in the luminous Seyfert 1 galaxy PG1211+577 (Gierlinski and Done, 2004). The blue wings seen on some of the stronger emission lines in the RGS spectrum may be an indication of such a trend to higher velocity gas extending into the unobscured outflow in Mkn 3. However, significant emission could also come from a second ionised emission component out of the line-of-sight to the continuum source (and hence not seen in absorption in Seyfert 1s) within the cone of the obscuring torus. Such a component might be identified with the ‘equatorial scatterer’ required by optical polarisation studies of Seyfert galaxies (Smith et al. 2002, 2004).
Acknowledgements
The results reported here are based on observations obtained with XMM-Newton, an ESA science mission with instruments and contributions directly funded by ESA Member States and the USA (NASA). The authors wish to thank Leicester colleagues for valuable input, the SOC and SSC teams for organising the XMM-Newton observations and initial data reduction. KAP acknowledges the support of a Leverhulme Trust Emeritus Fellowship and KPA of a PPARC research grant.
References
- [1] Arnaud K.A. 1996, ASP Conf. Series, 101, 17
- [2] Capetti A., Machetto F., Axon D.J., Sparks W.B., Boksenberg A. 1995, ApJ, 448, 600
- [3] Capetti A., Axon D.J., Machetto F., Marconi A., Winge C. 1999, ApJ, 516, 187
- [4] Cappi M. et al. 1999, A&A, 344, 857
- [5] den Herder J.W. et al. 2001, A&A, 365, L7
- [6] Gierlinski M., Done C. 2004, MNRAS, 349, L7
- [7] Godet O., Collin S., Dumont A.M. 2004, astro-ph/0407607
- [8] Griffiths R.G., Warwick R.S., Georgantopoulos I., Done C., Smith D.A. 1998, MNRAS, 298, 1159
- [9] House L.L. 1969, ApJS, 18, 21
- [10] Iwasawa K., Yaqoob T., Awaki H., Ogasaka Y. PASJ, 46, L167
- [11] Kallman T., Liedahl D., Osterheld A., Goldstein W., Kahn S. 1996, ApJ, 465, 994
- [12] Kaspi S. et al. 2002, ApJ, 574, 643
- [13] Kinkhabwala A. et al. 2002, ApJ, 575, 732
- [14] Magdziarz P., Zdziarski A.A. 1995, MNRAS, 273, 837
- [15] Matt G., Fabian A.C., Reynolds C.S. 1997, MNRAS, 289, 175
- [16] Matt G. 2002, MNRAS, 337, 147
- [17] Miller J.S, Goodrich R.W. 1990, ApJ, 355, 456
- [18] Nandra K., Pounds K.A., Stewart G.C., Fabian A.C., Rees M.J. 1989, MNRAS, 236, 39
- [19] Nandra K., Pounds K.A. 1994, MNRAS, 268, 405
- [20] Pogge R.W., de Robertis M.M. 1993, ApJ, 404, 563
- [21] Porquet D., Dubau J. 2000, A&A, 143, 495
- [22] Pounds K.A., Reeves J.N., King A.R., Page K.L. 2004a, MNRAS, 350, 10
- [23] Pounds K.A., Reeves J.N., Page K.L., O’Brien P.T. 2004b, ApJ, 616, 696
- [24] Sako M., Kahn S.M., Paerels F., Liedahl D.A. 2000, ApJ, 543, L115
- [25] Schurch N.J., Warwick R.S., Griffiths R.E., Sembay S. 2003, MNRAS, 345, 423
- [26] Smith J.E., Young S., Robinson A., Corbett E.A., Giannuzzo M.E., Axon D.J., Hough M.H. 2002, MNRAS, 335, 773
- [27] Smith J.E., Robinson A., Alexander D.M., Young S., Axon D.J., Corbett E.A. 2004, MNRAS, 350, 140
- [28] Stark A.A., Gammie C.F., Wilson R.W., Bally J., Linke R., Heiles C., Hurwitz M. 1992, ApJS, 79,77
- [29] Strüder L.et al. 2001, A&A, 365, L18
- [30] Tifft W.G., Cocke W.J. 1988, ApJS, 67, 1
- [31] Tran H.D. 1995, ApJ, 440, 565
- [32] Turner M.J.L. et al. 2001, A&A, 365, L27
- [33] Turner T.J., George I.M., Nandra K., Mushotzky R.F. 1997a, ApJ, 488, 164
- [34] Turner T.J., George I.M., Nandra K., Mushotzky R.F. 1997b, ApJS, 113, 23
- [35] Verner D.A., Ferland G.J. 1996, ApJS, 103, 467