11email: demers@astro.umontreal.ca 22institutetext: INAF, Osservatorio Astronomico di Roma, Viale del Parco Mellini 84, I-00136 Roma, Italia
22email: battinel@oarhp1.rm.astro.it
The C star outer disk population of M31 seen with the SLOAN filters ††thanks: Based on observations obtained with MegaPrime/MegaCam, a joint project of CFHT and CEA/DAPNIA, at the Canada-France-Hawaii Telescope (CFHT) which is operated by the National Research Council (NRC) of Canada, the Institut National des Science de l’Univers of the Centre National de la Recherche Scientifique (CNRS) of France, and the University of Hawaii.
We employ the CFHT Megacam camera to survey one deg2 of the southern outer disc of M31, a region which includes the area where Battinelli et al. (2003) have identified nearly one thousand C stars. In the outer M31 region not previously surveyed, we identify 361 new C star candidates, having similar photometric properties to the known ones, and confirm the slight decrease in the luminosity of C stars with galactocentric distances. We show that the Sloan g′, r′, i′ filters are a viable approach, comparable to (CN – TiO), to identify C stars. We find that the (g′ – r′) colours of cool C stars can be so red that prohibitively long g′ exposures are needed to acquire faint extragalactic C stars. This makes the Sloan filters a less promising approach to extend a C star survey to several Mpc. Our uniform large field survey detects the edge of M31 disk at 35 kpc. The intermediate-age population, represented by C stars, extends further to 40 kpc.
Key Words.:
Galaxies, individual M31 stellar population, Stars: carbon1 Introduction
Photometric identification of intermediate-age carbon stars in nearby galaxies has recently been done using a combination of broad and narrow-band photometry. The (CN – TiO) technique has been applied by, for example, Battinelli et al. (2003), Nowotny et al. (2003) and Harbeck et al. (2004) while the near infrared approach has been adopted by, for example, Demers et al. (2002) and Cioni & Habing (2005). The SLOAN Digital Sky Survey (SDSS) photometric system, described by Fukugita et al. (1996), has been used to identify carbon stars in the Galactic halo. Indeed, Krisciunas et al. (1998) were first to show that carbon stars can be differentiated from M stars in the (r′ – i′) — (g′ – r′) diagram. Faint halo carbon stars were discovered, using this technique, from the SDSS database by Margon et al. (2002). The first catalogue of these halo C stars has recently been published by Downes et al. (2004) where 251 stars were identified in a 3000 deg2 area. The authors evaluate that over 50% of the sample constitute nearby dwarf C stars. Obviously only a global survey like the SDSS can tackle the Galactic halo. Surveys of nearby galaxies can, however, be done with a more conventional approach.
Battinelli et al. (2003) have identified nearly one thousand C stars in the southern outer disk of M31. Approximately 0.6 deg2 were surveyed using the CFH12K mosaic. C stars are identified from their position on the (CN – TiO) vs (R – I) colour-colour diagram. The reliability of this technique is quite secure, as it was demonstrated by Brewer et al. (1995) and Albert et al. (2000). The M31 sample offers the opportunity to compare the (CN – TiO) technique with the SDSS colour-colour approach. We therefore describe here our new observations which include part of the fields already observed by us and extend the M31 disk survey to slightly larger radii.
2 Observations and data reduction
The observations presented in this paper consist of one Megacam field, centered on = 00:37:02.3, = +39:40:50 (J2000.0), obtained in Service Queue Observing mode in August 2003. The Megacam camera is installed at the prime focus of the 3.66 m Canada-France-Hawaii Telescope. The camera consists of a mosaic of 36 2048 4612 pixels CCDs providing a field of view of nearly one deg2, with a resolution of 0.187 arcsecond per pixel. Images were obtained through g′, r′ and i′ SDSS filters. The observations were secured under non photometric and partly cloudy conditions. For this reason, three short exposures were taken under excellent conditions and have been used to calibrate the long exposures. It turns out, however, that our adopted exposure times are somewhat too short to fully survey the very red stars of M31. Table 1 presents the journal of the observations. The g′, r′ and i′ magnitudes, are calibrated with bright first generation SDSS standards (Smith et al. 2002), as explained in the CFHT/Megacam website.

The data distributed by the CFHT have been detrended. This means that the images have already been corrected with the master darks, biases, and flats. This pre-analysis produces 36 CCD images, of a given mosaic, with the same zero point and magnitude scale.
The photometric reductions were done by Terapix, the data reduction center dedicated to the processing of extremely large data flow. The Terapix team, located at the Institut d’Astrophysique de Paris, matches and stacks all images taken with the same filter and, using SExtractor (Bertin & Arnouts 1996), provides magnitude calibrated catalogues of objects in each of the combined images. SExtrator classifies objects into star or galaxy but the classification scheme breaks down for faint magnitudes. It is essentially useless for the M31 stars. A flag is attached to each object, flag = 0 corresponds to isolated object not affected by neighbours. As can be seen from Figure 1, the northern part of the Megacam field is closer to the center of M31. For this reason a substantial stellar density gradient is observed across the field thus numerous stars with flag 0 are present in the northern half. Since the astrometric calibration of the images has been done by the CFHT Service Observing team, we have equatorial coordinates as well as calibrated colours and magnitude for each object in the field.
3 Results
3.1 The data
Each calibrated , r′ and g′ file contains about 300,000 objects, 230,000 of them with flag = 0. We shall employ and analyse this subset. The number of stars, having a photometric error smaller than a given value, varies from one file to the next. For example, the , r′ and g′ files contain respectively 83,000, 121,000 and 110,000 stars with err 0.10 mag. However, when and r′ are combined, the number of stars with colour error, 0.10, is 50,500 while for g′ and r′, the number of stars with 0.10 is 56,700. When the three files are combined and, following our standard criterion only stars with = 0.125 are retained, the number of stars drops to 37,000. We shall see later that this small number is due to the presence of numerous faint red stars not well observed in the g′ and r′ filters. Finally the remaining 65,000 stars with flags = 1,2, or 3 and corresponding to objects affected by close neighbours or/and originally blended will not be used for the magnitude and colour comparisons but will be needed later to cross-identify known C stars.
3.2 The colour-magnitude diagrams
A one square degree field in the direction of M31 must obviously include stars of different population. The major axis of its disk runs roughly diagonally across the Megacam field, from 18 kpc to 33 kpc. At such distances the bulge population is completely negligible (Windrow et al. 2003), thus we see disk and halo stars of M31, our Galactic contributions (halo and disk stars) and numerous unresolved galaxies. We present, in Figure 2, the two colour-magnitude diagrams (CMD) corresponding to the whole Megacam field for stars with flag = 0 and colour error 0.10. The broken lines represent the limiting magnitudes which correspond to the magnitudes where the luminosity function drops to 50% of its peak value. These are found to be: i′ = 22.5, r′ = 22.9 and g′ = 24.0.
The top panel shows the i′ magnitudes versus the (r′ – i′) colours. Two features are conspicuous: the bright end of the red giant branch of M31, starting at i′ 21 and extending far to the red; and the vertical ridge at (r′ – i′) 0.10. This ridge corresponds to Galactic G dwarfs, at the MS turnoff, seen along the line of sight. The colour location of this ridge is indicative of the reddening. According to Schlegel et al. (1998) the Galactic contribution to the reddening in this direction amounts to E(B–V) = 0.06, which translates to E(r′–i′) = 0.04.
The second CMD (lower panel of Fig. 2) has more interesting features. Blue main sequence stars are well separated from the bulk of M31’s stars, differential reddening within the star forming regions must be responsible for the diffuse appearance of the main sequence. The narrow vertical plume at (g′ – r′) 1.4 corresponds to stars of spectral type M, as the synthetic colours from Fukugita et al. (1996) demonstrate. This plume is also seen in the simulation of Galactic stellar objects by Fan (1999). The vertical ridge corresponding to Galactic G dwarf is also seen. Finally we see, in this CMD, a small population of stars extending at (g′ – r′) 1.7. We identify these stars with extreme (g′ – r′) colours to C stars observed for the first time in the SLOAN colours by Krisciunas et al. (1998). This C star tail is seen to curve below the the limiting magnitude of the data, suggesting that some C stars must have been missed.

3.3 The colour-colour diagram
The colour-colour diagram of the Megacam field is displayed in Figure 3. Again, only stars with flag = 0 are included, we plot only stars fainter than = 17.5 to exclude some ( 2000) of the foreground Galactic stars. C stars are seen to the right of the diagram, with colours reaching (g′ – r′) = 3.
We note, however, a number of points with extreme negative (r′ – i′) colours, seen at the bottom of the diagram. Investigation of their spatial distribution reveals that they are nearly all on the West side of the North-South CCD borders. The spurious magnitudes close to the borders are due to a 80 pixel shift of one of the exposures relative to the two other ones. Thus, the instrumental magnitudes of about 200 stars near the CCD borders are wrong because they are not based on the right number of exposures. It is rather difficult to delete these stars from the database because we have lost their original x,y CCD coordinates since we are now using equatorial coordinates.

3.4 Cross identification of M31 stars
The goal of our study is to obtain the SDSS magnitude and colours of the known C stars in the disk of M31 which were identified from their position in the (R – I) vs (CN – TiO) plane. The (CN – TiO) technique is designed to identify cool N-type C stars. In the (R – I) vs (CN – TiO) plane, the warmer and fainter C stars are mixed with the late K or early M stars. For this reason the differentiation of C stars and M stars is limited to stars with (R – I)0 0.90. Therefore, our approach will be somewhat different from the one employed by Margon et al. (2002) in their identification of faint high-latitude carbon stars (FHLCs) because we intend to deal exclusively with cool red C stars.
The first step in the cross identification is to match all stars with identical equatorial coordinates. To do so, we select two datasets: the CFH12K SW1 field consisting of 62,007 stars for which we have I, (R – I) and (CN – TiO) and a second set consisting of the 37,000 stars in the Megacam field for which we have i′, (r′ – i′) and (g′ – r′). After a few iterations to minimize the and we retain some 8000 pair of stars matched within 0.8 arcsec. The reason why such relatively small number of matches is obtained can be seen from Fig. 1, only 63% of SW1 overlaps with 20% of the Megacam field. In the region common to both fields there are 10,000 stars from Megacam and 35,000 in the SW1 field.
We compare, in Figure 4, the magnitudes and colours of these matched stars. The i′ magnitudes are fainter than the I magnitudes by 0.25 mag. The downward bulge, seen at the faint magnitude end, is simply due to the natural increase of the scatter for the faintest magnitudes. The asymmetry of the dispersion is explained by the missing stars with faint i′ magnitudes. These stars are present in the i′ file but, since they don’t have matches in the r′ or g′ files, disappear from the i′r′g′ Megacam dataset.
The relationship between the magnitudes can be expressed in the following ways, obtained from linear regressions:
or
The comparison of the colours shows a significant scatter at the red end. This is simply a consequence of the rather bright r′ limiting magnitude of our observations. The faint red stars have a lower photometry quality. The colour relationship is obtained by using only 900 stars with i′ 20.5. These stars have (r′ – i′) 2.0.
this is to be compared to the synthetic colours relation calculated by Fukugita et al. (1996). They quote (r′ – i′) = 0.98(R – I) – 0.23; for (R – I) 1.15 and (r′ – i′) = 1.40(R – I) – 0.72; for (R – I) 1.15. We do not see in our data a break in the colour relation up to (r′ – i′) 2.0, where the brighter stars can be seen. For comparison, the Fukugita et al. relation is drawn on Fig. 4.

3.5 Cross identification of C stars
Of the nearly one thousand M31 C stars identified by Battinelli et al. (2003) in fields SW1 and SW2, only 644 are in the Megacam field. Cross identification, with the same criterion described above, yields barely 129 matches, just 20% of the C stars in the field. There are two major reasons for this low success rate. The disk of M31 shows a gradient of stellar surface density. The northern part of the Megacam field being more densely populated contains more C stars that are in a somewhat crowded environment. Many northern C stars were not matched. If we do not take into account the flag assigned by SExtrator to each star, and accept all stars irrespective of their flag, the number of carbon star matched increases to 245. This is done without relaxing the photometric error criterion. The second explanation for the low success rate comes from the fact that the limiting r′ and g′ magnitudes are not as faint as the CFH12K data, thus the redder C stars are missed. Figure 5 compares the (R – I)0 colour distribution of the known C stars with those cross identified in the i′ and g′ files. Obviously the red stars are missing in the g′ file and also, to a lesser extent in the r′ file, not shown here.

The magnitude and colour distributions of the known C stars and those identified in our Megacam data are shown in Figure 6. The top panel indicates the number of C stars cross identified depends moderately on the apparent i′ magnitude. This implies that the crowding is the most important factor. The lower panel confirms that red stars are missing from our Megacam sample.

Figure 7 presents the SDSS colour-colour diagram of the 245 C stars recovered in our Megacam data, when no flag restriction is applied. The three solid lines outline the acceptance limits adopted by Margon et al. (2002) for the FHLCs. As expected, our C stars are redder than these limits in (r′ – i′) as well as in (g′ – r′). Since our earlier adopted limit of (R – I)0 = 0.90 corresponds to (r′ – i′) = 0.64, very few if any C stars should have bluer (r′ – i′) colours. These Megacam observations, sampling the disk of M31 where numerous K giants are present, are certainly not ideal to identify bluer C stars which can easily be confused with the bulk of the K giants. We draw, somewhat arbitrarily, the dashed lines corresponding to our adopted colour limits for the M31 cool C star population. The extreme upper and lower points correspond to stars that have calculated magnitude and colour (given by Eqs 2 and 3) which differ substantially from the CFH12K values. The variability of C stars could be responsible or, more likely, spurious matches are always possible in a crowded field. The 129 C stars matched to the flag = 0 data are indistinguishable in the colour-colour plane.

3.6 Selection criteria for cool C stars
A close-up of Fig. 3, along with our adopt boundaries for C stars is displayed in Figure 8. It is obvious that the blue limit adopted by Margon et al. (2002) is of little use to us. Indeed, the numerous K stars seen in the M31 disk, overwhelm the few C stars with (g′ – r′) 1.5. This, to a so large extent, that to exclude as much as possible K and M stars it would seem necessary to adopt a conservative blue limit around (g′ – r′) 1.7. We describe how we can better determine this colour limit.

For the 8000 stars cross-identified we have their (R – I), (CN – TiO), (g′ – r′) and (r′ – i′). We can then identify the C and M stars by applying our criteria based on (R – I) and (CN – TiO) colours. Thus we can calculate the number of C or M stars having a (g′ – r′) larger than a certain limit. The numbers of C stars (NC) and M stars (NM) selected for different (g′ – r′) lower limits are displayed in Figure 9. As we shift the blue limit to redder colours the number of M stars drops appreciably while the number of C stars decreases slightly. Figure 10 presents the variation of the ratio of the number of C stars to the sum (N NM) for various (g′ – r′) limits. The dashed curve is the ratio of NC relative to the original 245 C stars. We conclude, from this figure, that a reasonable colour limit is (g′ – r′) = 1.55. At this limit 86% of the stars are C stars and we lose 20% of the C stars which have bluer colours. Furthermore, as we have previously explained, the C stars detected by this technique represent only a fraction of the total cool C star population because our Megacam observations do not have sufficiently deep exposures.


4 Discussion
4.1 Properties of C stars
Applying the above colour limits to our Megacam data file, for stars with flag = 0 and colour 0.125, yields a sample of 480 C stars candidates. According to Fig. 9, there should be some 70 K or M stars polluting this sample. Cross-identification with the known C stars in M31 results in 102 matches. However, a cross-identification with the whole CFH12K SW1 database reveals that 17 stars are in fact M stars. These few stars are thus deleted from our sample. The equatorial coordinates, given in degrees, the magnitude, the colours and their attached errors as determined by SExtractor of these remaining 463 stars are listed in Table 2. The being twice as large than the is explained by the faintness of C stars in the g′ band. 361 of them are newly identified C stars located almost all at larger radial distances than the ones previously known.
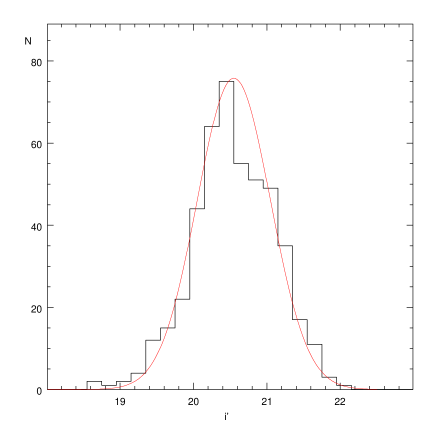
The i′ luminosity function of the 463 C stars candidates is displayed in Figure 11. A Gaussian is fitted by eyes over the distribution. Their mean apparent magnitude = 20.64, with a variance of 0.31, their mean colours are: = 0.86 and = 1.86. Using eq. 2, this mean magnitude corresponds to = 20.20, a value to be compared with = 19.94, obtained for the M31 C star population by Battinelli et al. (2003). Taking into account a mean extinction, of the order of AI = 0.12, implies that we have acquired essentially the same stellar population even though using different colour criteria.
-
a
Complete Table 2 is available in electronic form at the CDS via anonymous ftp to cdsarc.u-strasbg.fr (130.79.128.5). A portion is shown here for guidance regarding its form and content. Units of right ascensions and declination (J2000) are in degrees.
4.2 The M31 disk and its intermediate-age population
C stars can be used to map the spatial distribution of the intermediate-age population. To do so, we calculate the surface density per arcmin2 in elliptical annuli of 10′ width having the shape of the M31 apparent disk. Such ellipses are sketched in Fig. 1. We adopt for the disk of M31 a position angle of the major axis of 37.7∘ and an ellipticity = 0.787. Because of the huge size of M31, even compared to our one deg2 field, we are observing only sectors of annuli of quite different angular length. Even though the radial distance along the major axis reaches only 150′, we can sample larger radial distances on the edge of the field away from the major axis. The top panel of Figure 12 presents the C star surface density as a function of the radial angular distances. The bottom panel shows the surface density of the all stars detected by SExtractor fainter than i′ = 17.5 to exclude the brighter Galactic stars. These stars are mostly M31’s red giants. Their surface density reaches a plateau at 170′ ( 35 kpc) this position should correspond to the edge of the stellar disk. If we adopt, by averaging the last 7 points, 36.54 stars/arcmin2 for the density outside of the disk, the declining slope of the surface density corresponds to a scale length of 4.9 0.4 kpc. This is in excellent agreement with the scale length of C stars determined by Battinelli et al. (2003) and the one derived by Walterbos & Kennicutt (1988) from multicolour integrated surface photometry.
The density profile of C stars is much more irregular. The flattening of the profile at short distances is most probably due to the fact that SExtractor has difficulties dealing with crowded fields. For C stars only stars with 0.125 are selected while stars of all errors are included in the bottom panel. Contrary to the bulk of stars, C stars are seen up to 190′, (40 kpc) where a sharp drop is observed. The last three points represent only five C stars farther than 200′. This confirms the identification of C stars along the major axis of the disk by Battinelli & Demers (2005) who found one C star at 40 kpc, well outside of the Megacam field.
The fact that C stars are seen beyond “the edge of the disk” suggests that a tenuous thick disk, containing intermediate-age stars, must be present beyond the detectable edge. It density contrast, relative to the halo population, may be too low for easy detection. Since C stars are seen behind a zero foreground they can be seen even in extremely low density environment.

4.3 The C/M ratio
We have confirmed that the SDSS colours are useful to identify cool C stars. The next step is to adopt a colour criterion applied to the M stars, thus allowing the determination of the C/M ratio. According the Hawley et al. (2002), M0 dwarfs have = 0.91 . Unfortunately, because of the width and upper colour limit of the C star zone in the colour-colour diagram it appears quite difficult to discriminate M stars from C stars near such (r′ – i′) colour. However, M3 stars have = 1.29 0.32 a colour that cannot be confused with C stars. Therefore, we adopt for colour limits of the M3+ stars: (r′ – i′) = 1.3 and (g′ – r′) = 1.5, to separate them slightly from C stars. We have 6000 such stars (with 0.10) in our database. The limiting magnitude of this sample, because of the redness of the stars, reaches i′ 22, which translates into I = 21.5.
M3+ counts, in the same 10′ wide elliptical annuli previously adopted, show a plateau for distances larger than 170′. We average these outer counts to obtain an estimate of the foreground/background density. In our case it corresponds to 1.06 0.03 M3+ stars per arcmin2. A value we substract from the observed M3+ density. This density is to be compared to the M3+ density of 0.8 stars/arcmin2 we calculate from Durrell’s et al. (2001) observations of a remote field near M31.
Figure 13 presents the C/M3+ ratio as a function of galactocentric distances. As expected, for a decrease of metallicity with radial distances, the number of C stars increases relative to the number of M3+ stars. Such behavior, for example, has been observed in M33 by Rowe et al. (2004).

4.4 Colour and magnitude trend with the galactocentric distance
Our previous two investigations of the outer disk of M 31 have revealed the existence of a mild decrease of the I luminosity of C stars with increasing galactocentric distances (see Battinelli & Demers, 2005). It is therefore worth to inspect the behaviour of the newly identified C stars which extend the previous surveys up to nearly 240′. Figure 14 shows the magnitude and colour as a function of the galactocentric distance for the newly identified C stars along with the nearly 1000 previously know (Battinelli et al., 2003; Battinelli & Demers, 2005). Megacam were converted into Kron-Cousins I using eq. (2).

A certain radial fading of the luminosity and a gradual disappearance of the reddest C stars is evident. In principle, the luminosity fading may be explained by an increase of the metallicity at large galactocentric distances. Indeed, it is well know that the higher the metallicity the lower is the C star luminosity. This explanation is however unsatisfactory since both the observed colour gradient, shown in the top panel of Fig. 14, and the C/M behaviour in Fig. 13 point definitely towards a metallicity decrease in the outer part of the Andromeda disk. Age could, however, be responsible for the observed luminosity fading. Indeed, theoretical models for simple stellar populations of intermediate age (see e.g. fig. 11 in Marigo et al., 1999) suggest that the brightest C stars disappear when the age of the population increases. A radial increase of the age of the youngest C stars (or equivalently a decrease of the mass of the most massive C stars) can overwhelm the metallicity effect and explain the luminosity trend. It is clear that, beyond this qualitative considerations, an answer to the question is possible only through a full modeling – which could also account for the observed metallicity and density radial trends – of the composite stellar population in the outer disk.
5 Conclusion
The SDSS filters offer an alternative method to identify C stars and also late M stars. Contrary to the (CN – TiO) technique, it is difficult with the SDSS filters to isolate C stars from M0 stars. Furthermore, because numerous C stars have quite large (g′ – r′) colour the exposure time to reach the desired g′ magnitude can be very long relative to the i′ exposure. In term of telescope time both techniques require approximately the same total exposures since the CN and TiO exposures must be at least three to four times the I exposures.
The SDSS approach provides, however, uncontested advantages for two aspects of the extragalactic C stars survey. These filters are available on the new generation of large mosaic detectors, such as Megacam. They allow the survey of an entire nearby galaxy in a relatively short time. We have recently followed this approach to survey 4 deg2 around NGC 6822 where nearly 900 C stars are already known in its extended halo (Letarte et al. 2002). Optical imagers, albeit of small field size, available on some large telescopes, such as Gemini, offer - sometimes exclusively - SDSS filters. Because of the lack of the general availability of the CN and TiO filter, the SDSS approach must be adopted for any attempt to survey C stars among the neighbours of the Local Group.
Acknowledgements.
This research is funded in parts (S. D.) by the Natural Science and Engineering Council of Canada. We are grateful to Yannick Mellier and the Terapix team to have so promptly accepted to measure our Megacam data.References
- (1) Albert, L., Demers, S., & Kunkel, W. E. 2000, AJ, 119, 2780
- (2) Battinelli, P., & Demers, S. 2005, A&A, 430, 905
- (3) Battinelli, P., Demers, S., & Letarte, B. 2003, AJ, 125, 1298
- (4) Bertin, E., & Arnouts, S. 1996, A&AS, 117, 393
- (5) Brewer, J. P., Richer, H. B., & Crabtree, D. R. 1995, AJ, 109, 2480
- (6) Cioni, M.-R. L., & Habing, H. J. 2005, A&A, 429, 837
- (7) Demers, S., Dallaire, M., & Battinelli, P. 2002, AJ, 123, 3428
- (8) Demers, S., Battinelli, P., & Letarte, B. 2003, A&A, 410, 795
- (9) Downes, R. A., Margon, B., Anderson, S. et al. 2004, AJ, 127, 2838
- (10) Durrell, P.R., Harris, W. E., & Pritchet, C. J. 2001, AJ, 121, 2557
- (11) Fan, X. 1999, AJ, 117, 2528
- (12) Fukugita, M., Ichikawa, T., Gunn, J. E., Doi, M., Shimasaku, K., & Schneider, D. P. 1996, AJ, 111, 1748
- (13) Harbeck, D., Gallagher, J. S., & Grebel, E. K. 2004, AJ, 127, 2711
- (14) Hawley, S. L., Covey, K. R., & Knapp, G. R. 2002, AJ, 123, 3409
- (15) Krisciunas, K., Margon, B., & Szkody, P. 1998, PASP, 110, 1342
- (16) Letarte, B., Demers, S., Battinelli, P., & Kunkel, W. E. 2002, AJ, 123, 832
- (17) Marigo, P., Girardi, L., & Bressan, A., 1999, A&A, 344, 123
- (18) Margon, B., Anderson, S. F., Harris, H. C. et al. 2002, AJ, 124, 1651
- (19) Nowotny, W., Kerschbaum, F., Olofsson, H., & Schwarz, H. E., 2003, A&A, 403, 93
- (20) Rowe, J. F., Richer, H. B., Brewer, J. P., & Crabtree, D. R. 2004, AJ, in press
- (21) Schlegel, D., Finkbeiner, D., & Davis, M. 1998, ApJ, 500, 525
- (22) Smith, J. A., Tucker, D. L, Kent, S., et al. 2002, AJ, 123, 2121
- (23) Walterbos, R. A. M., & Kennicutt, R. C. 1988, A&A, 198, 61
- (24) Windrow, L. M., Perrett, K. M., & Suyu, S. H. 2003, ApJ, 588, 311