Strong CaII absorption lines in the reddened quasar SDSS J23390912: Evidence of the collision/merger in the host galaxy?
Abstract
We report the detection of strong CaII/MgII absorption lines at the quasar redshift in the narrow line quasar SDSS J23390912 ( ). The quasar exhibits strong FeII, small Balmer emission line width and a very red color. Both the optical continuum and broad emission lines are reddened by SMC-like dust of E(BV)1.0 mag, while its near-infrared color () shows little reddening. The CaII absorption lines are saturated and resolved with an FWHM of 362 km s-1 and an equivalent width of Å (in the source rest frame). MgII absorption lines are also saturated and have a similar line width. The line profile and the fact that there is no evidence for starlight from the host galaxy suggest that these absorption lines are not of a stellar origin. The ratio of column density of CaII to that of dust is consistent with that of the ISM in our Galaxy. We suggest that both the heavy reddening and the large absorption line width are due to the highly disturbed ISM on the line of sight toward the quasar, and that the disturbance is caused by a galaxy collision or even merger in the quasar host galaxy.
1 Introduction
Quasars are characterized by blue continuum and strong broad emission lines. However, a fraction of them show red colors due to wavelength-dependent extinction by dust on the line of sight. In the past years, we have witnessed controversial evidence on whether a large population of such objets exist or not (Cutri et al. 2000; Webster et al. 1995; Richards et al. 2003). The absorption can be caused by the dusty material either in the nucleus (i.e., inside the Narrow Line Region [NLR]), in the host galaxy or in the intervening galaxies (Pei, Fall & Bechtold 1991). Recent studies of red quasars from the SDSS (the Sloan Digital Sky Survey; York et al. 2000) suggested that most quasars are generally reddened by dust at the quasar redshifts (Richards et al. 2003; Hopkins et al. 2004), whether it is in the host galaxies or near the nucleus. Evidence for substantial absorbing material within the NLR is obvious in type 1.8/1.9 quasars selected from the SDSS, since their broad lines are heavily reddened while narrow lines not (Dong et al. 2005). Potential use of these reddened quasars in the study of the host galaxy properties has been discussed by these authors.
Reddened quasars are also important in studying the gas/dust environment of quasars and AGNs. Extinction curve is an important element to characterize the reddening in individual quasars. In the past years, there is still a controversy regarding what form of extinction curve should be applied to the quasar’s intrinsic reddening (e.g., Czerny et al. 2004; Hopkins et al. 2004).
In this paper, we report the detection of strong CaII and MgII absorption lines at the quasar redshift in the heavily reddened narrow line quasar SDSS J233903.82091221.2 (=0.6604; hereafter SDSS J23390912), which was initially discovered by the FIRST bright quasar survey (FBQS J23390912; Becker et al. 2001) with a moderate radio flux 4.3 mJy at 21 cm. We picked it up as an unusual Narrow Line Seyfert 1 galaxies (NLS1s) during the statistical study of a sample of NLS1s selected from the SDSS Data Release 2 and 3 (DR2 and DR3; Abazajian et al. 2004 & 2005). We study the absorption lines as well as the continuum and emission lines of this object, and suggest that the heavy reddening and the large absorption line width are due to the highly disturbed ISM of the host galaxy on the line of sight toward the quasar.
2 Modelling the continuum, absorption lines and emission lines
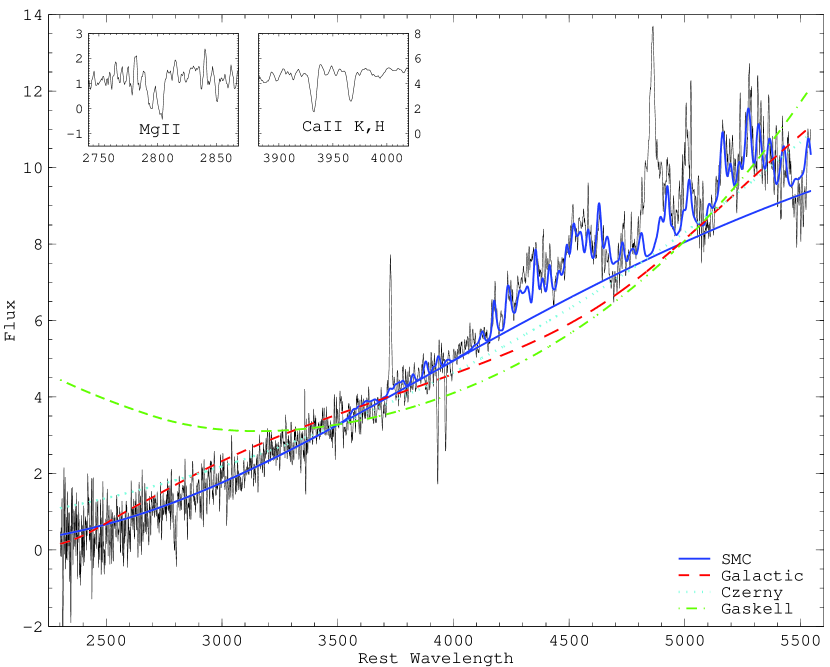
SDSS J23390912 is unusual for its very red spectrum in the sample of 1500 NLS1s selected from the SDSS DR2+DR3 spectroscopic catalogs. The SDSS optical spectrum, with a total exposure time of 3788 sec, is shown in Fig 1. CaII K, H absorption lines are evident. Due to its red color, S/N ratio drops rapidly towards short wavelength, and reaches as low as unity below 4100 Å (2500 Å in the source rest frame). Nonetheless, MgII doublet absorption lines are visible, while the corresponding emission lines are hardly detected. At long wavelengths, the spectrum shows prominent FeII and H lines. [OIII] 5007 emission line, blended with Fe II multiple 42, is visible and weaker than [OII]3727.
The spectrum was brought to the rest frame using the redshift determined by [OII]3727, and corrected for Galactic reddening of E(BV)=0.027 mag. The continuum and FeII emission lines are modelled as follows,
| (1) |
where is the FeII templates obtained by Veron-Cetty & Veron (2003) covering the wavelengths between 35357534 Å, and Å the power-law continuum (Francais 1996). We assume that FeII has a profile of Lorentzian, as Balmer lines (see below). We do not include UV FeII multiplets in the fit because the S/N ratio at the blue part of the spectrum is very low. For the same reason, we do not include the model of Balmer continuum. Adopting a single power-law prescription for the quasar continuum should be reasonable considering the low S/N ratio of the spectrum at the blue end. The best fitted model is obtained by minimizing . Emission lines apart from the FeII and absorption lines were masked out during the fitting. We have tried different extinction curves, but only SMC-like curve can give a good fit while others lead to much worse result (see next section). The final fit is also shown in Fig 1. This simple model reproduces quite well the overall observed continuum and FeII spectrum. The best fitted E(BV) is 0.97 mag for SMC-like dust.
Emission and absorption line parameters are measured after the continuum and FeII emission being subtracted. H is fitted with a Lorentzian; [OII] and [OIII] lines Gaussians. These models can fit the observed profile quite well. The width of H (2194108 km s-1) and the reddening corrected FeII/H ratio (4434-4684) are consistent with the definition of NLS1s (Goodrich 1989). With a reddening-corrected luminosity erg s-1, it undoubtedly is a reddened narrow line quasar. The [OII]/[OIII] ratio is 1.650.32. But [OIII] line profile is affected by red noise in the spectrum due to the sky lines, and thus its profile is determined less reliably.
Gaussian absorption line profile is used to fit the CaII K, H doublet. The widths of the two lines are set to be identical during the fit. Given the spectral resolution, it is not surprising that this model gives an acceptable fit. The equivalent width (EW) of CaII K line is 4.200.24 Å in the source rest frame; its width is 36234 km s-1 FWHM, corrected for the instrumental broadening of 170 km s-1. The observed ratio of the EWs of K to H lines, , is , indicating the saturation. MgII doublet absorption lines are saturated also and have widths similar to CaII doublet. But they cannot be measured exactly due to the low S/N ratio of the data. The derived emission and absorption line parameters are listed in Table 1.
Table 1. Emission line and absorption line parameters of SDSS J23390912.
| Line | Centroidaa Line centroid and equivalent width are given in the source rest frame. FWHM has not been corrected for the instrumental broadening. | Waa Line centroid and equivalent width are given in the source rest frame. FWHM has not been corrected for the instrumental broadening. | FWHMaa Line centroid and equivalent width are given in the source rest frame. FWHM has not been corrected for the instrumental broadening. |
|---|---|---|---|
| Å | Å | km s-1 | |
| 5005.90.4 | 2.5 | 37231 | |
| 4858.90.5 | 39.51.5 | 2194108 | |
| FeII4570 | 44.6 | ||
| CaII H | |||
| CaII K | |||
| 3728.50.3 | 8.8 | 31024 |
3 Discussion
3.1 The Extinction Curve of Dust Reddening
The extinction laws in the quasar and Seyfert galaxies have become an important topic in the past years. By combining the column density derived from the X-ray absorption and the UV/optical reddening, Maiolino et al. (2001) found that the for Seyfert galaxies is significantly lower than the Galactic one by a factor ranging from 3 to 100 (also Loaring, Page & Ramsay 2003; but Weingartner & Murray 2002 and Carrera, Page & Mittaz 2004 for controversy). The lack of prominent absorption feature at 9.7 m and 2175 Å leads the former authors to propose that large grains are responsible for the reddening, with a flat extinction curve in the UV. By comparing the composite spectra derived from samples of radio selected quasars with different orientations, Gaskell et al (2004) derived an extinction curve much flatter than the Galactic one in the UV. However, it was found that SDSS red quasars have colors consistent with significant reddening by an extinction curve similar to that of SMC (Richards et al. 2003; Hopkins et al. 2004). Strong evidence shows that the extinction curve is even steeper than that of SMC in two unusual BAL QSOs with continuum reddening 0.5 (Hall et al. 2002a). Consistent with the latter, Zuo et al. (1997) determined the reddening by comparing the spectra of two images of gravitational lensed QSO 0957+561 with different reddening. They derived a high dust-to-gas ratio and an extinction curve steeper than the Galactic one in the UV. Based on the SDSS composite reddened quasars, Czerny et al. (2004) proposed the extinction can be modelled by an AC sample of amorphous carbon grains.
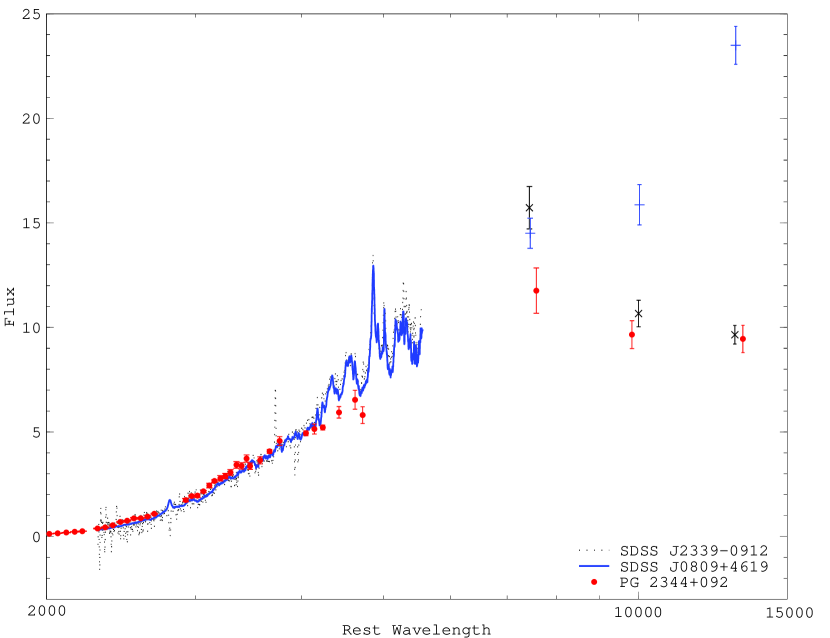
Both the optical continuum and the broad emission lines in SDSS J23390912 are heavily reddened by SMC-like dust of E(BV) 1.0 mag at the redshift of the quasar. We have applied the extinction curves of SMC, LMC and our Galaxy as well as those derived by Gaskell et al (2004) and Czerny et al (2004) to model the continuum and FeII spectrum of the quasar. We found that only the SMC one can reproduce the observed spectrum well while others cannot due to their flatness in the UV. This is shown in Fig 1. In fact, at rest wavelengths below 8000Å , this object is the reddened version of a normal narrow line quasar SDSS J080908.14+461925.6 (=0.6563; hereafter SDSS J0809+4619) by SMC-like dust with E(BV)=1.0 (see Fig 2). SDSS J0809+4619 is selected by its blue colors, strong FeII emission and the closeness to SDSS J23390912 in redshift. However, the observed near-infrared colors (1.63 for SDSS J23390912 and 1.66 for SDSS J0809+4619 from the 2MASS) of the two objects are almost the same, indicating no reddening of SDSS J23390912. The inconsistent results drawn from the optical to near-UV spectrum and from the near-infrared photometry are likely due to the intrinsic difference in the near-infrared emission of the two objects. First, the NIR SED of PG quasars shows large scatter, and seems not to be correlated with the SED in the optical and UV (Neugebauer et al. 1987). Especially, the reddened SED of PG 2344+092 () approximately matches the SED of SDSS J23390912 (Fig 2). Second, if this inconsistence is interpreted as different extinction laws in the near-infrared, a wavelength-independent extinction curve over a wavelength range from 8000Å to 1.3m is required, which is not consistent with any known extinction curve. Finally, variability is not likely responsible for the discrepancy because the J-band flux of SDSS J23390912 is fairly consistent with the reddened one of SDSS J0809+4619.
Although the reddening of the BLR is evident, we cannot infer the reddening of the NLR. The EW of [OIII]5007Å is already in the lower end among PG quasars. If [OIII] line is not reddened while the continuum is with E(BV) 1.0 mag, the intrinsic EW of [OIII]5007Å would be 0.2Å, at the extreme. On the other hand, the large [OII]3727Å to [OIII]5007Å ratio suggests reddening is not important for the NLR, if [OII] and [OIII] originate from the same region.
3.2 The Origin of the Absorbing Material
CaII absorption lines in this quasar is not of a stellar origin, because there is no other feature indicative of old stellar populations in the spectrum such as 4000Å break. The presence of saturated CaII and MgII absorption lines and the well-fitted Gaussian profile of CaII lines suggest that the absorption is caused by warm diffuse gas on the line of sight toward the quasar. Thick cold dusty material is also present on the line of sight according to the heavy reddening of both the continuum and the broad emission lines. It should to be noted that there are large residuals under the CaII absorption lines, suggesting that either (1) the absorber partially covers the source, or (2) it is constituted of several optically thick clouds. Partial covering is not important if the warm gas co-exists with the dusty material as we argue below, because the attenuation of the UV flux by reddening is extremely large. In the case (2), a lower limit on the column density can be imposed if we assume that the absorption line is constituted of several equally saturated, unresolved components. Using the growth curve of the absorption lines, we obtain a lower limit on the column density 51013 cm-2 from the ratio of the CaII doublet and the EWs. The exact value can only be obtained through high resolution spectroscopic observation.
With our estimated (lower limit on the) CaII column density, the ratio of N(CaII)/E(BV) is very close to those observed in the Galactic or toward Magllanic clouds. Wakker & Mathis (2000) found that HI column density is correlated with the column density of CaII with standard deviation of 0.40 dex for high- and intermediate velocity clouds in the Galaxy. More recently, Smoker et al. (2003) studied CaII absorption on the lines of sight to 88 mainly B-type stars, and found that log[N(CaIIK)/N(HI)] ranges from 7.4 to 8.4, 0.5 dex higher than that of Wakker & Mathis (2000). For the Galactic clouds, Bohlin, Savage, & Drake (1978) found N(H I)/E(BV) cm-2, which gives , consistent with the value obtained in SDSS J23390912. Thus, we propose that the warm gas responsible for the CaII/MgII absorption in SDSS J23390912 co-exists with the dusty material responsible for the reddening, with a gas-to-dust ratio similar to the ISM in our Galaxy.
CaII absorption has been detected in some Damped Ly (DLA) systems (Khare et al. 2004). These systems are believed to be observed when the line of sight to a quasar passes through galactic disks. Evidence for the presence of dust in such systems has been derived from the comparison of continuum and emission lines between quasars with DLA and those without; the dust-to-gas ratio has been found to be 0.050.20 that of the Galactic for the systems at relative high redshifts and with column density cm-2 (Pei, Fall, & Bechtold 1991). Heavy reddening and CaII absorption were also reported in two gravitational lensed quasars by lensing galaxies at intermediate redshifts ( for APM 08279+5255, Petitjean et al. 2000; =5.3Å , E(BV)=1.34 for PMN J01340931, Hall et al. 2002b). It is interesting to note that /E(BV) measured in PMN J01340931 is similar to that in SDSS J23390912, while a meaningful comparison is not permitted for APM 08279+5255 since Petijean et al. (2000) only gave the CaII EWs of two narrow components.
Strong CaII absorption due to ISM at the quasar redshift is rarely reported111Blue-shifted CaII absorption lines have been detected in Mkn 231 and several other low ionization broad absorption line quasars, which are considered to be caused in the dense outflow from the quasars (e.g., Rupke, Veilleux, & Sanders 2002).. Through one side of the Galactic disk, the reduced EW ( ) at infinity is 130 mÅ at most (??) according to Smoker et al. (2003). To give arise to the observed in SDSS J23390912, a nearly edge-on disk is required. Large N(NaI)/N(CaII) (1) is usually considered as an evidence for disk material (??). Assuming the NaI absorption line profile is similar to that of CaII, we obtain an upper limit on EW(NaI 3303) 2.8 Å in the source rest frame and N(NaI)/N(CaII) 16. Although this limit is not useful to constrain the origin of the absorbing gas, future observation may allow us to do this.
The disk can be associated with the quasar host galaxy or a close companion of the host. However, the large width of the absorption line is difficult explain unless the disk gas is severely disturbed. The warm gas is expected to be highly dispersive. If the galactic disk is not severely disturbed, the warm gas would relax onto the disk plane, and its orbit wpuld be almost circular. In the host galaxy case, the gas velocity would be essentially perpendicular to the line of sight toward the galactic center, so that the projected velocity on the line of sight would be very small. In the companion galaxy case where the line of sight toward the quasar intersects only one side of the disk, the rotation speed should be at least 720 km s-1 to produce a CaII profile of 360 km s-1 FWHM. Following the Tully-Fisher relation (Pierce & Tully 1992), the maximum absolute magnitude of the companion galaxy would be mag at B band, more luminous than the reddened quasar ( mag).
We suggest that the absorber is the warm diffuse gas in the galactic disk of the host galaxy or a close companion of the host, and that it is highly disturbed by a galaxy collision or even merger. Disturbed gas has been proposed in the study of the low-redshift quasar absorption systems in a few quasar-galaxy pairs, and was considered to be evidence of a recent merger or an ongoing encounter with a companion(Carilli & van Gorkom 1992). The detection of blueshifted Na I D absorption lines in the ultraluminous infrared galaxies (Rupke et al. 2002), which are thought to be galaxies in collision, further supports this idea. The large line width and high column density of CaII presented in SDSS J23390912 require much stronger perturbation or even the merging of two galaxies. Future high S/N and resolution spectra in the near-UV/optical can allow us to precisely resolve the line structure of CaII and other metals, yielding the chemical abundance and the kinematic structure of the absorbing gas.
References
- Abazajian et al. (2004) Abazajian, K., et al. 2004, AJ, 128, 502
- Abazajian et al. (2005) Abazajian, K., et al. 2005, AJ, accepted
- Bohlin, Savage, & Drake (1978) Bohlin, R. C., Savage, B. D., & Drake, J. F. 1978, ApJ, 224, 132
- Boroson & Green (1992) Boroson, T. A., & Green, R. F. 1992, ApJS, 80, 109 (BG92)
- Carilli & van Gorkom (1992) Carilli, C. L. & van Gorkom, J. H. 1992, ApJ, 399, 373
- Carrera, Page, & Mittaz (2004) Carrera, F. J., Page, M. J., & Mittaz, J. P. D. 2004, A&A, 420, 163
- Cutri, Nelson, Huchra, & Smith (2000) Cutri, R. M., Nelson, B. O., Huchra, J. P., & Smith, P. S. 2000, Bulletin of the American Astronomical Society, 32, 1520
- Czerny, Li, Loska, & Szczerba (2004) Czerny, B., Li, J., Loska, Z., & Szczerba, R. 2004, MNRAS, 348, L54
- Dong et al. (2005) Dong, X., Zhou, H., Wang, T., Wang, J. Li, C., & Zhou, Y. 2005, ApJ, in press
- (10) Francis, P.J. 1996, Publ. Astron. Soc. Australia, 13, 212
- Gaskell et al. (2004) Gaskell, C. M., Goosmann, R. W., Antonucci, R. R. J., & Whysong, D. H. 2004, ApJ, 616, 147
- Goodrich (1989) Goodrich, R. W. 1989, ApJ, 342, 224
- Hall et al. (2002a) Hall, P. B., et al. 2002a, ApJS, 141, 267
- Hall et al. (2002a) Hall, P. B., Richards, G. T., York, D. G., Keeton, C. R., Bowen, D. V., Schneider, D. P., Schlegel, D. J., & Brinkmann, J. 2002b, ApJ, 575, L51
- Hopkins et al. (2004) Hopkins, P. F., et al. 2004, AJ, 128, 1112
- Khare et al. (2004) Khare, P., Kulkarni, V. P., Lauroesch, J. T., York, D. G., Crotts, A. P. S., & Nakamura, O. 2004, ArXiv Astrophysics e-prints, astro-ph/0408139
- Loaring, Page, & Ramsay (2003) Loaring, N. S., Page, M. J., & Ramsay, G. 2003, MNRAS, 345, 865
- Maiolino et al. (2001) Maiolino, R., Marconi, A., Salvati, M., Risaliti, G., Severgnini, P., Oliva, E., La Franca, F., & Vanzi, L. 2001, A&A, 365, 28
- Neugebauer et al. (1987) Neugebauer, G., Green, R. F., Matthews, K., Schmidt, M., Soifer, B. T., & Bennett, J. 1987, ApJS, 63, 615
- Pei, Fall, & Bechtold (1991) Pei, Y. C., Fall, S. M., & Bechtold, J. 1991, ApJ, 378, 6
- Pierce & Tully (1992) Pierce, M. J. & Tully, R. B. 1992, ApJ, 387, 47
- Petitjean, Aracil, Srianand, & Ibata (2000) Petitjean, P., Aracil, B., Srianand, R., & Ibata, R. 2000, A&A, 359, 457
- Richards et al. (2003) Richards, G. T., et al. 2003, AJ, 126, 1131
- Rupke et al. (2002) Rupke, D. S., Veilleux, S., & Sanders, D. B. 2002, ApJ, 570, 588
- Smoker et al. (2003) Smoker, J. V., et al. 2003, MNRAS, 346, 119
- Wakker & Mathis (2000) Wakker, B. P. & Mathis, J. S. 2000, ApJ, 544, L107
- Webster et al. (1995) Webster, R. L., Francis, P. J., Peterson, B. A., Drinkwater, M. J., & Masci, F. J. 1995, Nature, 375, 469
- Weingartner & Murray (2002) Weingartner, J. C., & Murray, N. 2002, ApJ, 580, 88
- York et al. (2000) York, D. G., et al. 2000, AJ, 120, 1579
- Zuo et al. (1997) Zuo, L., Beaver, E. A., Burbidge, E. M., Cohen, R. D., Junkkarinen, V. T., & Lyons, R. W. 1997, ApJ, 477, 568