Implications of Halo Inside-out Growth on the X-Ray Properties of Nearby Galaxy Systems within the Preheating Scenario
Abstract
We present an entirely analytic model for a preheated, polytropic intergalactic medium in hydrostatic equilibrium within a NFW dark halo potential in which the evolution of the halo structure between major merger events proceeds inside-out by accretion. This model is used to explain, within a standard CDM cosmogony, the observed X-ray properties of nearby relaxed, non-cooling flow groups and clusters of galaxies. We find that our preferred solution to the equilibrium equations produces scaling relations in excellent agreement with observations, while simultaneously accounting for the typical structural characteristics of the distribution of the diffuse baryons. In the class of preheating models, ours stands out because it offers a unified description of the intrahalo medium for galaxy systems with total masses above M⊙, does not produce baryonic configurations with large isentropic cores, and reproduces faithfully the observed behavior of the gas entropy at large radii. All this is achieved with a moderate level of energy injection of about half a keV, which can be easily accommodated within the limits of the total energy released by the most commonly invoked feedback mechanisms, as well as with a polytropic index of 1.2, consistent with both many observational determinations and predictions from high-resolution gas-dynamical simulations of non-cooling flow clusters. More interestingly, our scheme offers a physical motivation for the adoption of this specific value of the polytropic index, as it is the one that best ensures the conservation after halo virialization of the balance between the total specific energies of the gas and dark matter components for the full range of masses investigated.
Subject headings:
cosmology: theory — galaxies: clusters: general — methods: analytical — intergalactic medium — X-rays: galaxies: clusters1. INTRODUCTION
In this paper we explore the consequences of applying a recently developed procedure for the evolution of the halo structure onto the modeling of the properties of the hot gaseous baryons they host. Our model assumes, in line with the results of numerical simulations see Salvador-Solé, Manrique, & Solanes 2005, that between major mergers halos grow inside-out maintaining invariant their structural parameters. This concept has been the basis for the successful reproduction of both the NFW (Navarro, Frenk, & White, 1997) functional form of the dark matter density distribution and the empirical correlations involving its concentration parameter (Manrique et al., 2003; Salvador-Solé et al., 2005), while it has also been invoked to resolve some apparent challenges to the CDM model for structure formation (Loeb & Peebles, 2003). We are interested in confronting the predictions of this halo growth process with both the observed global and structural X-ray properties of nearby groups and clusters of galaxies and, in particular, in investigating its compatibility with the findings of both observations and high-resolution gas-dynamical simulations that the diffuse baryons outside the innermost regions of galaxy systems obey a polytropic equation of state that is neither purely isothermal nor adiabatic.
It has been known for nearly two decades that X-ray galaxy systems are at variance with the simple self-similar scenario predicted by Kaiser (1986) in which gravitational collapse is the sole mechanism driving the evolution of their nonbaryonic and baryonic components. Provided that galaxy groups and clusters of total virial mass can be treated as scaled versions of each other and that their X-ray emitting gas is in hydrostatic equilibrium within the dark matter (DM) potential, this scenario assumes that the virial temperature111In the present work, temperatures expressed in specific energy units will be identified by a star superscript. of the dark halo, , is a good approximation for the effective X-ray gas temperature, , where is the virial radius, the 1D velocity dispersion of the gas, and the mean molecular weight of the gas in physical units, being the corresponding value in units of the proton mass and the Boltzmann’s constant. Under these conditions it readily follows that and, if the total X-ray gas mass , that too. Furthermore, if the plasma emissivity is dominated by thermal bremsstrahlung —this is strictly true only for the hotter, non-relativistic plasmas with , as at lower temperatures, emission line cooling by metals dominates—, its integral over the entire energy range of the (continuum) X-ray emission and over the gas distribution, assumed to be an isothermal plasma with (number) density proportional to the mass density distribution and extending likewise out to , predicts a total halo bolometric X-ray luminosity or, equivalently, .
While hydrodynamic simulations dealing only with physical processes that do not have any preferred scale (e.g., Navarro, Frenk, & White, 1995; Evrard, Metzler, & Navarro, 1996; Bryan & Norman, 1998; Eke, Navarro, & Frenk, 1998; Frenk et al., 1999; Thomas et al., 2001) have extensively confirmed the approximate validity of the self-similar scaling even for cosmogonies of the CDM type, years of observational efforts have now provided compelling enough evidence for an excess in the specific energy/entropy of the X-ray gas with respect to the contributions arising from adiabatic compression and shock heating alone (e.g., White, 1991; David, Forman, & Jones, 1991, 1996; Ponman, Cannon, & Navarro, 1999; Lloyd-Davies, Ponman, & Cannon, 2000; Finoguenov et al., 2002; Ponman, Sanderson, & Finoguenov, 2003). These deviations are indicative of an important role of nongravitational processes in determining the properties of the hot intrahalo medium (hereafter IHM).
Basically, there are two different approaches competing to explain the observed X-ray properties of bound collections of galaxies and, in particular, the deviations from the simple self-similar picture. One category of models (both analytical and numerical) explores the effects of nongravitational heating on the IHM drawing inspiration from the work of Kaiser (1991), who was the first to point out that the intracluster gas properties, including the evolution of its X-ray luminosity function, could be better reconciled with the hierarchical scenario of structure formation if the entropy of the gas we now see was the result of some early injection of heat —perhaps during the epoch of galaxy formation— previous to the cluster assembly. The addition of energy into the gaseous component increases its entropy and reduces the shock-heating efficiency, preventing the gas from reaching high density during the halo collapse and producing lower than expected luminosities for a given temperature (e.g., Cavaliere, Menci, & Tozzi, 1998; Wu, Fabian, & Nulsen, 1998; Balogh, Babul, & Patton, 1999; Loewenstein, 2000; Wu, Fabian, & Nulsen, 2000; Tozzi & Norman, 2001; Bialek, Evrard, & Mohr, 2001; Borgani et al., 2001; Babul et al., 2002; McCarthy, Babul, & Balogh, 2002; Dos Santos & Doré, 2002; Oh & Benson, 2003). For a given amount of energy injected into the intergalactic medium, this extra heating is expected to leave a more significant imprint on the low-temperature systems for which and the shock-created entropy is negligible, in agreement with observations. This means that for these systems gas infall proceeds roughly adiabatically, predicting the existence of an ’entropy floor’ (Lloyd-Davies et al., 2000). Paradoxically, radiative cooling is also capable of explaining the lack of self-similarity of the X-ray gas (e.g., Bryan, 2000; Voit & Bryan, 2001; Muanwong et al., 2001; Wu & Xue, 2002; Davé, Katz, & Weinberg, 2002). In this alternative scenario, the central low entropy gas, characterized by a cooling time shorter than the typical halo age, is selectively removed by condensing into dense, cold structures and rapidly replaced by the higher-entropy material from the halo outskirts. The latter is then heated by adiabatic compression as it flows in, giving rise to temperature profiles with a central maximum and engendering substantially shallower density distributions that cause a reduction in the bulk X-ray luminosity, much like in the non-gravitational heating scheme.
These two basic scenarios, however, are not free of important drawbacks. Radiative cooling without non-gravitational feedback mechanisms is a runaway process that results in severe overcooling of gas on group scales and thereby in an unpleasantly large fraction of gas () converted into a ’stellar’ cold medium (Oh & Benson, 2003). This so-called ’cooling crisis’ or ’cooling catastrophe’ (e.g., Blanchard, Valls-Gabaud, & Mamon, 1992; Fukugita, Hogan, & Peebles, 1998; Balogh et al., 2001) is difficult to be dealt with appropriately even with state-of-the-art numerical simulations due to the technical challenge represented by the simultaneous requirement of properly implementing small-scale processes, such as star formation and feedback, and having a large dynamic range from galaxies to large-scale structures in a volume large enough to guarantee a statistically representative ensemble of simulated halos. Overcoming overcooling is not easy either within analytical radiative cooling schemes (e.g., Voit et al., 2002). Important cooling and condensation of the gas, and the internal heating resulting from the ensuing star formation feedback, continuously modify the gas distribution, so the necessary hypothesis that the IHM is in hydrostatic equilibrium does not hold. Besides, any heating of the intergalactic medium after it is confined within halos of groups and clusters has the disadvantage of requiring a larger amount of energy injection to raise the denser gas to a given entropy level (Loewenstein, 2000; Voit & Bryan, 2001). Precisely, the major criticism toward the preheating scenario has to do with the ’energy crisis’ (e.g., Davé et al., 2002) related to the yet unidentified astrophysical source(s) responsible for injecting the amount of excess energy ( keV particle-1) necessary to explain the observed scaling relations and its connection with the process of galaxy formation (e.g., Navarro et al., 1995; Cavaliere et al., 1998; Balogh et al., 1999; Lloyd-Davies et al., 2000; Wu et al., 2000; Brighenti & Mathews, 2001; Babul et al., 2002). We want to point out, however, that although important details on how and when this additional heat is injected into the diffuse medium have still to be sorted out, there is no shortage of potential sources of pre-collapse heating see, for instance, Babul et al. 2002 for a brief summary. More importantly, the substantial additional entropy at large radii detected in both clusters and groups of galaxies at a typical level of keV cm2 (Finoguenov et al., 2002; Ponman, Sanderson, & Finoguenov, 2003) appears to be beyond the bounds of plausibility of models that invoke only gas cooling and gravitational heating to explain the keV cm2 entropy excess seen in the central regions of galaxy systems (Ponman et al., 1999; Lloyd-Davies et al., 2000; Ponman et al., 2003). Two recent results give convincing support to this conclusion. To begin with, there are the hydrodynamic simulations by Finoguenov et al. (2003) with radiative cooling, star formation, and non-gravitational heating, which demonstrate that star formation without extra heating produces too steep entropy profiles in group-sized halos that also fall somewhat short in explaining the height of the observed specific entropy on the halo outskirts. In addition, observations of the hot cluster Abell 1795 by Ikebe, Böhringer, & Kitayama (2004) show that the intracluster medium temperature is higher than the dark matter ’temperature’ (measured from the radial profile of the dark matter velocity dispersion), even in the central region where the radiative cooling time is short.
While it is true that recent high spatial resolution X-ray data suggest that treatments combining energy injection with cooling may be necessary to explain the central temperature and entropy profiles of massive cooling flow clusters (e.g., McCarthy et al., 2004), this work aims to demonstrate that a hydrostatic polytropic gas model based on the notion of preheating and requiring a relatively modest heating energy budget can have a remarkable success in accounting simultaneously for the global and structural X-ray properties representative of the bulk of present-day relaxed galaxy systems with gravitational masses between and M⊙. This is done in the context of the concordance flat CDM cosmology with reduced Hubble constant , present-day matter density , rms mass fluctuation on scales of 8 Mpc , cosmological baryon content (and, hence, a cosmic baryon fraction of 0.12), and primordial mass density fluctuation power spectrum index , fully consistent with recent joint analyses of WMAP and redshift survey data (e.g., Tegmark et al., 2004). The outline of the paper is as follows. In Section 2, we provide a brief overview of the approach used to follow the growth of bound halos and present the profiles describing the structure and kinematics of their nonbaryonic and baryonic components. After identifying the best solution to the equilibrium equations of the hot baryons in Section 3, we then go on in Section 4 to validate our model predictions for nearby () galaxy systems against an extensive set of X-ray observations involving a variety of both scaling relations between bulk properties and structural properties of the IHM, discussing the results in the light of recent observations. The last section of the paper contains a summary of our main findings.
2. THEORETICAL FRAMEWORK
We present here the set of equations that completely defines our model for the evolution of the structure of bound X-ray groups and galaxy clusters. As usual in analytic approaches of this kind, these systems will be approximated by spherically symmetric structures whose global dynamics is exclusively driven by the assemblage of the dark matter component (baryons amount of the total gravitational mass ).
2.1. The Dark Halo Evolution Model
Numerical simulations (e.g., Navarro et al., 1997; Jing, 2000; Bullock et al., 2001) of the hierarchical mass assembly in the universe, have demonstrated that the mass density distribution in the CDM cosmology of relaxed, nonbaryonic halos at any redshift can be characterized by a universal NFW functional form
| (1) |
where and are, respectively, the halo characteristic density and scale radius.
Salvador-Solé, Solanes, & Manrique 1998; see also Raig, González-Casado, & Salvador-Solé 1998 developed a consistent analytic description of the hierarchical evolution of DM halos that provides an excellent fit to -body simulations (Raig, González-Casado, & Salvador-Solé, 2001). This framework for structure formation incorporates in the well-known extended Press-Schechter formalism (Lacey & Cole, 1993) a pre-established phenomenological threshold setting the fractional mass increase that separates the two basic mass aggregation regimes of dark halos: minor mergers or accretion, where these objects grow inside-out through the continuous aggregation of small clumps that do not disturb their internal structure222This condition implies that the values of and remain unaltered during the inside-out growth process., and major merger events, in which the progenitor halos are fully disrupted giving rise to the formation of a new bound system. While, as shown by Raig et al. (2001), it is possible to achieve an excellent agreement between theory and simulations for any value of , it is essential specifying the exact value of this parameter in order to explain the characteristic inner structure of halos (Manrique et al., 2003), as well as any correlation involving their concentration (Salvador-Solé et al., 2005). In particular, the concentration dependence on halo mass at any redshift found by Eke, Navarro, & Steinmetz (2001), which we shall adopt here, requires for the elected cosmology (Hiotelis, 2003). Once has been chosen, the epoch of formation of a population of halos of mass —defined as the redshift at which they have experienced their last major merger— is fixed. We take the median value of the analytical probability distribution of formation times for DM halos with observed virial masses see eqs. [6]–[12] in Salvador-Solé et al. 1998 as their typical formation redshift .
By defining as the radial distance in units of the scale radius, we can rewrite equation (1) in dimensionless form as
| (2) |
where, taking into account the relationship
| (3) |
with the ratio of the mean density of a sphere of radius to the characteristic background density of the universe at the epoch in which halos are observed, one has that , with the halo concentration giving the reduced virial radius of the system within which the mean halo density is . In our model, and , resulting in at .
This dimensionless form of the halo density profile is used to find the dimensionless mass within radius
| (4) |
the corresponding dimensionless halo circular velocity square
| (5) |
and, from the Poisson equation = and expression (4), the dimensionless NFW halo potential
| (6) |
where the (invariant after halo formation) characteristic parameters , , and act as normalization constants.
Besides, for the computation of the halo total energy (§ 3.1) it will be also necessary to deal with both the reduced one-dimensional velocity dispersion of the dark matter, which we obtain numerically by integrating the Jeans equation, assuming isotropic orbits and a null pressure at infinity,
| (7) |
and the masses halos with present-day total masses had at , which we infer from the rate of halo mass growth by accretion given in Raig et al. (2001).
2.2. Modeling the Hot Gas Component
2.2.1 Dimensionless Profiles
The equilibrium structure of the IHM is determined by requiring this component to be, in epochs of gentle mass accretion, in thermal pressure-supported hydrostatic equilibrium within the (fixed) gravitational potential wells set by the dark matter halos333An implicit and necessary hypothesis of this kind of models is that both the gas and the dark matter swiftly readjust to a new hydrostatic equilibrium after a major merger event; see, for instance, the discussion in Cavaliere, Menci, & Tozzi (1999).. Hydrodynamical simulations on the physics of diffuse baryons in accretion flows indicate that most of the bulk energy of the infalling gas is converted through highly efficient shocks into thermal energy and that the outer boundary of the hot gas expands following closely the growth of the collisionless dark matter component (see, e.g., Takizawa & Mineshige, 1998). So, as a practical approximation for the evolution of the IHM structure, we will assume that between major mergers the hot gas distribution evolves inside-out maintaining its outermost radius permanently equal to . Furthermore, we will consider that all the baryonic matter within the virialized halos is in the hot X-ray-emitting phase observational data indicate that, typically, only of the baryons in clusters are locked into stars and cold gas so ; see, e.g., Lin, Mohr, & Stanford 2003; Bell et al. 2003.
The Jeans equation for an ideal gas, , with isotropic pressure takes the form
| (8) |
Thus, to solve the IHM structure by relating univocally the gas density and temperature to the halo mass more information in the form of a relation between and is required. Analytic models obtain conveniently flexible solutions by adopting for the IHM profiles a polytropic equation of state (see also § 3.1), leading to the relationship
| (9) |
where is the polytropic index —which for a given potential effectively specifies the shape of the temperature profile— that is presumed independent of the halo mass and radial distance to the halo center. Since we are adopting the common approximation of describing the hot X-ray plasma by a single-phase (i.e., each volume element contains gas at just a single temperature), monoatomic perfect gas with a null metallicity gradient, for a strictly adiabatic IHM must be equal to 5/3, the ratio of specific heats. Gas models with a polytropic index larger than this value are convectively unstable, while isothermal distributions are retrieved for (apart from the cores of some clusters, there is little observational evidence for radially increasing X-ray temperatures, corresponding to ).
The solution of the equilibrium equation (8) by applying boundary conditions at the current value of the virial radius of the halo (in units), i.e., at , leads to the following dimensionless temperature profile for :
| (10) |
Therefore, from equations (9) and (10) the dimensionless gas density writes
| (11) |
where is the characteristic density of the gas and
| (12) |
represents the solution of the Jeans equation for an isothermal gas with a dimensionless temperature whose value is equal to . Equations (10)–(12) completely determine the structure of the hot gas once its temperature and density at are specified.
2.2.2 Boundary Conditions
To determine the value of the additive constant in equation (10), we have taken into account the fact that, in the absence of non-conservative processes, the total specific energies of the gas and dark matter must remain invariant and equal to each other, as numerical simulations confirm (Thomas et al., 2001; Muanwong et al., 2002) —we are neglecting the small gas heating that may arise from any energy transfer between the dark matter and the hot gas occurring during gravitational collapse (see, e.g., Pierce, Thomas, & Couchman, 1994). Thus, when the preheating energy of the gas is non-zero, we have, for any redshift :
| (13) |
In equation (13) represents the ratio between the sum of the total kinetic and potential energies and the total mass of the component calculated within the reduced virial radius , while in the non-starred is chosen to represent from now on the excess energy per gas particle brought by preheating and the mean mass of the gas particles where this energy is injected.
By substituting in equation (13) the model profiles derived in the current and former sections, we obtain, after some algebra, the implicit relationship
| (14) |
which we choose to solve at the observed redshift (see also § 3.1). In this last equation the value of is chosen by assuming that energy injection takes place after reionization is complete (), but before the galaxy systems have formed (recent estimates by Finoguenov et al. 2003 and Oh & Benson 2003 suggest that preheating may have happened at , a value substantially larger than the typical formation redshifts our model predicts for group and cluster-sized halos). Accordingly, we consider that the excess energy is injected into a fully ionized plasma with metallicity equal to the current standard solar abundance and temperature above —so becomes temperature independent— for which , as inferred from the tables of Sutherland & Dopita (1993). Note that, for the smallest systems, the nongravitational heating energy is expected to be the best part of the energy budget, making their mean gas temperature almost independent of the system mass.
To set the normalization of the dimensionless gas density profile (eq. [2.2.1]), we choose to impose the boundary condition, also adopted in other models with preheating (see, e.g., Oh & Benson, 2003), implying that
| (15) |
The results of both adiabatic simulations and simulations with cooling and star formation (Ascasibar et al., 2003; Kravtsov et al., 2005) show that the local ratio of gas to dark matter density within present-epoch halos is close to the cosmic baryon fraction near the halo boundary. Therefore, by using equation (15), we implicitly assume that, in the range of halo masses where our preheating model is aplicable (see § 3.2), the baryon fraction near the virial radius is not strongly affected by the non-gravitational heating. Besides, a ’local’ constraint —as opposed to the more widely used ’global’ boundary condition — allows for the possibility that the finite central temperature of the IHM (see, e.g., eq. [10]), which causes the central gas distribution to be more flattened than the density distribution of the dark matter, can produce baryon fractions within the virial radius smaller than the cosmic value. Indeed, given that any energy injection into the gas actually enhances this tendency by creating a core in its density profile and decreasing further its central value, equation (15) grants that our model can reproduce the reduced total gas masses characteristic of low-mass halos in preheating scenarios Muanwong et al. 2002; Oh & Benson 2003; see also the last paragraph of § 4.1.
3. BEST SOLUTION TO THE EQUILIBRIUM EQUATIONS
Before we investigate the X-ray properties of real galaxy systems with our model, it is necessary to identify the correct solution to the equilibrium equations of the hot baryons. In our analytical treatment, the gas structure is controlled by the values of the polytropic index and the preheating energy per particle , which we now proceed to determine. The appropriateness of the resulting best model will then be exhaustively checked in Section 4 by confronting its predictions with an ample variety of X-ray data on both the global properties and radial structure of the gas.
3.1. Fixing from the Specific Energy Balance
While appears to be a parameter relatively well constrained empirically, the consensus on its value is by no means absolute. A number of observations (e.g., Markevitch et al., 1998; Finoguenov, Arnaud, & David, 2001, 2001; Sanderson et al., 2003) and both analytical models (e.g., Cavaliere et al., 1999; Tozzi & Norman, 2001) and high-resolution gasdynamical simulations (e.g., Ascasibar et al., 2003; Borgani et al., 2004; Ettori et al., 2004), agree in showing that the IHM of galaxy clusters is well represented, outside any cooling region, by a polytropic equation of state with a universal index of around over the full radial range. There are, however, some recent observations suggesting both that the polytropic treatment of the gas is only acceptable beyond about 20% of the cluster virial radius and that the required value of is close to 1.5 (De Grandi & Molendi, 2002). As we next show, the physical consistency of the inside-out growth of the halo structure in regard to the energy balance between its two main components can be used to infer a well defined value for this index, thereby implying that is not a true degree of freedom in our model.
As stated in Section 2.2.2, relation (13), which was used to set the boundary condition on the equilibrium dimensionless temperature profile, must hold from provided a negligible fraction of the hot gas is able to cool after the halo formation. While we have chosen to fix the balance of total specific energies between the two main halo constituents, , at the observed redshift , obviously there is no guarantee whatsoever that its universal value, , is preserved automatically for any other cosmic time larger than the virialization epoch. In fact, as the equilibrium equations of the inside-out evolving DM and polytropic gas profiles are different, the degree to which condition (13) is fulfilled along the halo lifetime depends on the specific values adopted for the parameters and controlling the gas structure.

Figure 1 summarizes the (maximum) percent difference between the sum of the kinetic and potential specific energies of the hot gas and the total specific energy of this component inferred from equation (13) calculated at . Results for three different levels of mass-independent , each one for five different values of , are presented. We note that the physical consistency of our predictions has been also preserved by limiting the calculations to halo masses for which the sign of the sum of the kinetic and potential energies of the IHM is negative, as otherwise it cannot remain gravitationally bound (see also § 3.2). Figure 1 shows that, in general, the deviations increase with decreasing present-day gravitational mass reflecting the more important contribution of the extra heating to the gas energy budget in small halos. In panel (a), where the results corresponding to a null preheating () are displayed, the value of gives the best performance, keeping the relative deviation below 1 per cent across the entire range of halo masses that are being investigated. The curve for also shows moderately low deviations ranging from 2% at the high mass-end up to somewhat less than 6% for the smallest systems. Compared to these two models, the performances of the and solutions are much less satisfactory. This latter conclusion is also applicable to the results obtained for an isothermal gas profile () in the low half of the mass range, which only leads to results as good as in the –1.2 cases for halo masses above M⊙.
The effects of including nongravitational gas heating are illustrated in panel (b) of Figure 1, were we display the deviations calculated for keV particle-1, and panel (c), were a larger amount of energy injection of keV particle-1 has been assumed. The addition of preheating energy results in larger discrepancies, except for the case , which now preserves the universality in the balance of specific energies to within 3% across the three-order-of-magnitude range of gravitational masses. Now, even the behavior of the curves, which is highly satisfactory for cluster-scale systems, swiftly deteriorates once they move below – M⊙, giving rise to unacceptably high energy differences. Under these same conditions, the relative deviation of the isothermal solutions remains satisfactorily low only for the rarest most massive clusters. We note that all curves in Figure 1 have been calculated by taking equal to the median of the formation time distribution of the dark halos of a given current mass . In general, the larger the adopted formation redshift, the larger the maximum relative deviation that results at this redshift. Thus, for instance, by setting equal to the lower quartile the discrepancies become typically a factor two larger.
These results all together imply that for a moderately preheated IHM warrants the best global physical consistency with the inside-out growth of structure by accretion. Interestingly, polytropic gas distributions with –1.2 in a NFW potential well also have the desirable property of tracing the dark matter profile in the outer part of halos (Komatsu & Seljak, 2001). Besides, as we discuss in the next section, a universal polytropic index of 1.2 for the diffuse baryons provides the best fit of our predictions to the observations when X-ray data are used to adjust and simultaneously.
3.2. Constraining from the Luminosity-Temperature Relationship
The X-ray luminosity and temperature are the most easily observable bulk properties of the hot gas in clusters and groups of galaxies. Accordingly, they have been measured for a large number of these systems. This large dynamic range of the data and the few hypothesis involved in the calculation of these two observables, which are reflected in a relatively tight correlation, render this relationship the most reliable empirical reference for the calibration of any theoretical modeling of the IHM. In this section, we fix the poorly constrained value of by finding the theoretical solution that, for , best matches the observed luminosity-temperature relationship for groups and clusters of galaxies.
Comparison to observations is done via the total bolometric X-ray luminosity, derived by integrating the volume emissivity of the X-ray-emitting gas, , out to the halo maximum radius:
| (16) | |||||
and the emission-averaged X-ray temperature of the halo expressed in energy units
| (17) |
In equations (16) and (17), and are, respectively, the mass density and temperature profiles of the IHM given by equations (10)–(12), whereas is the bolometric cooling function normalized to the total number density of all plasma species (electrons and ions) taken from the tables of Sutherland & Dopita (1993), which include both bremsstrahlung and cooling from metal lines, for a plasma of metallicity . In these calculations, we have kept track of the cooling time at ,
| (18) |
in order to exclude halos for which all of the gas within the virial radius has had time to cool since the system formed.

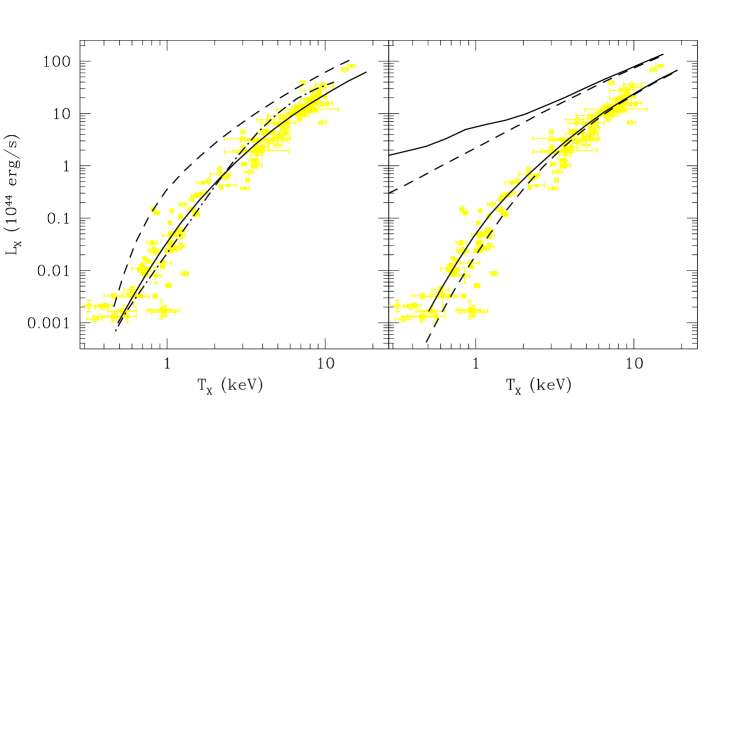
Figure 2 presents the comparison of the observed relation for groups and clusters of galaxies with our best-fit model, which is obtained for keV particle-1. In this figure, the theoretical curve encompasses halos of present-day virial masses ranging from M⊙ large enough to explain the hottest system data, down to M⊙. The exclusion of systems with masses below the latter value is due to the impossibility for halos this small of retaining their IHM when energy injection reaches 0.55 keV particle-1. Interestingly the emission-weighted X-ray luminosity associated with this lower-mass limit ( ergs s-1) shows a good correspondence with the minimum luminosity of the measurements in the GEMS galaxy group project by Osmond & Ponman (2004) when this dataset is restricted to those systems with genuine group emission (G-sample; open pentagons in the figure).
Figure 2 also illustrates that the slope of our best-fit model increases gradually with decreasing matching the trend of the observations at cluster and group scales. In the hot cluster regime ( keV) , as suggested by most authors (e.g., White, Jones, & Forman, 1997; Arnaud & Evrard, 1999), although our model indicates that the logarithmic slope should approach asymptotically the self-similar value of 2 for the very hottest systems. For the coolest systems, the typical model behavior () is likewise fully consistent with observations, including the latest data from the GEMS project G-sample that, nonetheless, show a noticeably increase in the scatter about the predicted trend for ergs s-1. As argued by Osmond & Ponman, this marked raising of the dispersion —arising, for the most part, from pushing the current instrumental capabilities to the limit in order to observe a sufficiently representative number of cool groups ( keV)— introduces several sources of bias that likely conspire to flatten the relationship at these scales and render it to apparently follow the cluster trend, instead of the characteristic logarithmic slope of 4–5 found for X-ray bright groups (Helsdon & Ponman, 2000; Xue & Wu, 2002). Still, the fact that our model goes through the middle of the locus occupied by the data points in the low , low regime suggests that the relationship does indeed steepen substantially in these extreme scales.
It is also interesting to note that had we decided not to fix for a start the value of by imposing the preservation of the specific energy balance between the two major halo components during the accretion phase, but use instead the relationship to adjust simultaneously the values of this parameter and of the excess energy, we would have inferred, precisely, a best-fit value of 1.2 for the universal polytropic index. This argues in favor of the consistency of the X-ray data with the inside-out growth of the structure of galaxy systems within a universal preheating scenario in which is about half a keV per particle.
On the other hand, the fact that our model shows the closest agreement to the observations across several orders of magnitude in X-ray luminosity for a value of the preheating energy that compares favorably to constraints found in the literature is very assuring and can be viewed as a further endorsement of the consistency of our approach. Thus, our best-fit value of keV particle-1 for this parameter agrees very well with the energy budgets inferred from recent analytical and numerical IHM models (Voit et al., 2002; Finoguenov et al., 2003), as well as with the results of attempts at directly measuring the extra energy injected into the gas (Lloyd-Davies et al., 2000). To our knowledge ours is among the universal preheating models with the lowest heat input requirements. In this respect, it is worth noting that excess energies of only half a keV per particle might not be out of the reach of the total energy released into (though not necessarily retained by) the intergalactic medium by galaxy winds in starburst galaxies or by active galactic nuclei (AGN), to name only a few of the most popular heating sources, which comes to several keV per particle when averaged over all baryons in the universe (e.g., Cavaliere, Lapi, & Menci, 2002).
3.3. Sensitivity to Model Parameters
While specifying completely determines the gas profiles, it is reasonable to wonder how our predictions depend on the exact values adopted for this parameter, for the fixed-by-theoretical-arguments polytropic index, as well as for the other parameters of the model that have been prefixed for definiteness. In the following we comment on this issue, focusing on the relationship.
As was already noted on Section 2.2.2, the effects of the energy injected into the gas at preheating become progressively noticeable with decreasing halo mass (temperature), reflecting the mounting contribution of to the total energy of this component. In particular, we find that the behavior of the predicted luminosity-temperature relationship below keV becomes extremely sensitive to the exact value adopted for this degree of freedom, to the point that in the adjustment process the X-ray data allows one to easily discriminate between variations of larger than only keV particle-1 in spite of the fact that, at these scales, the dispersion of the observations is substantial.
While sets the normalization and convexity of the luminosity-temperature relationship at the low-mass end, the amplitude of this correlation at cluster scales depends essentially on the value of the polytropic index. By varying (at the cost of lessening the physical consistency of the predictions), we have found that relatively small changes of one tenth around its preferred value of 1.2 produce theoretical curves that differ only marginally from the best solution. The results of Section 3.1 demonstrate, however, that this mild degeneracy vanishes completely when the preservation of the balance between the total specific energies of the gas and dark-matter components after halo formation for the entire range of scales we are considering is taken into account. In contrast, as the left panel of Figure 3 illustrates, when the extremal values of the polytropic index (isothermal IHM) and (nearly adiabatic IHM) are combined with our best-fit value for the injected energy, the model predictions for the adopted CDM cosmogony clearly fail to match the X-ray data. It is worth noticing, however, that our solutions for keV are relatively insensitive to the value of , as far as it is larger than . This would explain why injection models adopting for the gas are successful in describing the low-luminosity group data in spite of the lack of observational support for an adiabatic gas distribution at these scales. Moreover, the fact that the isothermal solution runs essentially parallel to our best model across most of the cluster regime, implies that universal preheating models relying on the isothermality of the IHM can be matched up with the data if they are endowed with some additional freedom that allows one to renormalize, directly or indirectly, the X-ray luminosity (temperature).
Other factors that can influence our model predictions are those related to the formation history of DM halos, such as the underlying cosmogony, specified by the values assumed for the cosmological parameters, and the adopted mass-concentration relation —we have verified that the predicted gas properties for our best model remain essentially independent of the adopted halo formation epoch even when an explicit dependence on it is introduced by solving equation (2.2.2) at . With regard to the dark and baryonic matter contributions to the density parameter, any variation in and/or that lowers the cosmic baryon ratio would lower the amount of baryons in the IHM and thereby the halo luminosities (and, of course, the hot gas mass fraction; see § 4.1). At the same time, the normalization of the perturbation spectrum, , has repercussions on the convexity of the relationship at cluster scales, which increases when the value of this parameter is lowered and vice versa. We also want to emphasize the fact —already stressed by Balogh et al. (1999)— that, in models relying on the hydrostatic equilibrium of gas in the dark matter potential, the ratio of model to observed luminosity is dependent, so the best-fit solution varies with the assumed value of the Hubble constant. We have nonetheless checked that if we take then the preferred value of varies by less than , provided we allow for variations on the other cosmological parameters within the WMAP uncertainties. Last but not least, we also have verified that the adoption in our calculations of the mass-concentration prescription by Bullock et al. (2001) produces essentially identical results.
The non-statistical noise of the and any other scaling relationships involving bulk properties of the IHM may be increased by the intrinsic scatter of the mass-concentration relationship e.g., Afshordi & Cen 2002; see also Fig. 1 in Wu et al. 2000, as well as by deviations of real systems from the ideal conditions of the modeling (e.g., non-negligible ellipticity, incomplete dynamical relaxation, or variations in the efficiency of energy injection). While these are effects that are not considered in the present study, the gas metallicity is a factor that may introduce a substantial amount of scatter in the relationship, especially at group scales, which is very straightforward to investigate within the context of our model. It is well established (e.g., Renzini, 1997; Allen & Fabian, 1998; Fukazawa et al., 1998; Ettori et al., 2001; Tozzi et al., 2003) that rich clusters exhibit almost constant average metallicity of with a reduced scatter, while cooler systems with keV show a wide range of values going from negligible metal contents to solar abundances —we do not consider here the existence of abundance gradients in cluster and groups of galaxies; see, e.g., De Grandi et al. (2004) and references therein. The fact that metal lines begin to provide a significant contribution to the emissivity only at temperatures below a few keV has been frequently exploited in investigations of the X-ray properties of halos by computing the cooling function under the simpler conditions that describe the physics of high temperature plasmas (but see Davé et al., 2002). However, when one seeks to extend the predictions to the group scales, the effects of metallicity can no longer be overlooked. As we show in Figure 3 (right), the contribution of metal lines to cooling starts to be noticeable, just like it happens with the contribution of to the gas energy, when the IHM temperature drops under 2–3 keV, to the point that, independently of the amount of non-gravitational heating, the bolometric X-ray luminosities at keV inferred from the model solutions that use a solar-metallicity cooling function become about three times higher than those in which primeval abundances have been adopted. (The comparison between the two sets of preheated and non-preheated solutions drawn in the figure also illustrates the strong downward bending in the luminosity-temperature relationship that results from an energy injection of keV particle-1, which for 0.5 keV halos implies a reduction of more than two orders of magnitude in for .) Also note how within the isothermal models () with no energy injection (), the upper curve, which represents the solution for a gas with a solar metal abundance, veers away from the roughly self-similar scaling of the zero-metallicity solution, showing a shallower, rippled slope that reflects the rises and falls of the cooling function arising from different metal lines (see, e.g., Figures 8 and 18 in Sutherland & Dopita, 1993).
Lastly, we would like to comment on the fact that some analytical models also resort to surface brightness bias, i.e., to measure temperatures and luminosities above an arbitrarily fixed surface brightness level, to explain both the offset toward lower luminosities and the increase of the dispersion of the luminosity-temperature relation for the less massive halos (e.g, Voit et al., 2002). Given the outward-decreasing equilibrium profiles of the gas, any reduction in the outer halo boundary has the effect of lowering and raising , producing the same trend seen in the data. Although this effect has not been accounted for in our modeling to avoid introducing an additional, poorly constrained, degree of freedom, we point out that raising the surface brightness threshold would have reduced further the amount of preheating energy necessary to reproduce the observations.
Given that the (relatively important) impact of possible variations in metallicity is noticeable for a range of system temperatures in which X-ray data —other than the X-ray luminosities and temperatures— are scarce and affected by large uncertainties, the discussion of the next section focuses only on the model predictions inferred for halos whose IHM has a metallicity fixed to the conventional value of .
4. RESULTS

4.1. The mass-temperature relationship
Plotted in Figure 4 is a comparison between the mass-temperature relationship resulting from our preferred model and data from both the enlarged HIFLUGCS sample (Reiprich & Böhringer, 2002) and the Birmingham-CfA cluster scaling project (Sanderson et al., 2003). The temperature axis shows, as before, the emission-weighted temperature within the virial radius, , while to facilitate comparison with observations, the halo mass is now represented by , the total mass inside a scaled radius of within which the mean matter density is . As Sanderson et al. (2003) actually quote emission-weighted temperatures within a scaled radius of their values have been conveniently rescaled by means of the relationship , which we have calibrated from the comparison between their estimates of the emission-weighted temperatures for the subsample of Lloyd-Davies et al. (2000)’s systems and the measurements published in this previous study.
The visual inspection of Figure 4 shows that our predicted mass-temperature relationship has the right normalization and that the constant logarithmic slope of of the model solution above keV is fully compatible with the trend shown by the observations. This good match between the observed and theoretical relations is very compelling, especially considering that there is no freedom in our prediction. Our results are also in excellent agreement with previous findings of a logarithmic slope of by Nevalainen et al. (2000), by using overdensities of 1000 and spectroscopically derived temperatures, and of by Finoguenov et al. (2001), derived from spatially resolved X-ray observations. In contrast, the slope of found by Sanderson et al. (2003) for their sample (using ) differs by from our value. However, a major difference of this latter sample, compared to those used in the studies previously mentioned, is the inclusion of a substantial number of systems with temperatures below 1 keV, including two measurements on early-type galaxies (the lower-leftmost data point in Fig. 4 represents the most massive of them, NGC 6482), which tend to increase the slope of a global log-log linear fit. On the other hand, the inferred uniform rising of the mass over most of the temperature range does not support claims of a mass-temperature relationship that is convex Sanderson et al. 2003; but see our comments below on the total gas mass-temperature relationship or has a break at about 3–4 keV Nevalainen, Markevitch, & Forman 2000; Finoguenov et al. 2001. At this point, we would like to stress that any conclusions on the actual value of the slope of the mass-temperature relationship and its possible convexity should be regarded with caution, mostly because the results being debated are not only sometimes based on ill-defined, incomplete datasets, but also due to the different prescriptions, extrapolations, and other inherent difficulties involved in the calculation of integrated halo properties, particularly the virial mass. The definitive answer will have to await the forthcoming availability of larger samples of high-quality data with well-defined selection procedures which can be accounted for during the fitting process. What is clear from our analysis is that the predictions of our universal preheating model compare very favorably to current observations.
For low-temperature systems ( keV) the predicted relationship initiates a break away from the general trend, barely perceptible because of the cut off in mass (and temperature) imposed by the condition that the IHM must be bound for excess energies of 0.55 keV particle-1. Had we not taken into account this restriction the theoretical mass-temperature relation would had then shown a progressively marked decline, leading to an emission-weighted temperature of the gas almost independent on the halo mass, much as the universal preheating model by Balogh et al. (1999) and Babul et al. (2002) predicts it should happen for a range of masses around M⊙. Most interestingly, this radical variation of the correlation trend would show a very good correspondence in the diagram with the locus occupied by the measurements of the two early-type galaxies included in the Birmingham-CfA cluster sample. This coincidence is, nonetheless, surprising since, for the best-fit value of the preheating energy, our model gives rise to galaxy-sized halos that cannot retain their hot gas.
Concerning the pure preheating model by Balogh, Babul, and collaborators, we want to stress the fundamental difference existing in the explanation put forward for the origin of the observed dispersion in the scaling relationships, which these authors attribute primarily to the distribution of halo formation times. This conclusion appears to be a consequence of their assumption that the accretion of the gas on the low-mass halos is specified by the adiabatic Bondi accretion rate, which leads to a strong dependence of the gas density normalization on that propagates, throughout the Jeans equation, to the bulk properties of this component. In contrast, the properties of the X-ray gas in our best model are independent of the distribution of halo formation redshifts. Therefore, taking into account both that, on cluster scales, the other intrinsic dispersion factors that might affect the group data are not an issue and that the level of scatter of the measurements depicted in Figure 4 is pretty uniform across the range of observed masses, we attribute the observed scatter in the relationship a genuinely statistical nature.
We have also included in Figure 4 the self-similar relation derived from the hydrodynamical simulations by Evrard et al. (1996), rescaled to our value of (long-dashed curve). Both the higher mass normalization and the canonical 1.5 slope are faithfully described by our model prediction corresponding to an isothermal gas without preheating (short-dashed curve). This result, apart from reinforcing confidence in our model, demonstrates that essentially all the steepening, as well as the downward shift in the normalization, are attributable to the effects of preheating.

The impact of preheating on total gas mass observations can be gauged in Figure 5, where we depict emission-weighted temperature versus gas mass inside the scaled radius . Again, the trend exhibited by the data, now coming from Mohr, Mathiesen, & Evrard (1999), is dutifully reproduced by our relationship. Another remarkable result is that we predict a convex correlation in which the slope smoothly increases with decreasing temperature as in the purely analytical model by Dos Santos & Doré (2002). The comparison of this correlation with the result for an isothermal model in which preheating has been switched off (short-dashed curve), shows that both predictions follow parallel trends for systems with keV (the normalization of the isothermal model always being higher). For halos this hot, the inferred typical logarithmic slope is , close to the self-similar value but nevertheless steeper, and an almost perfect match to the best-fit slope of found by Vikhlinin et al. (1999) for regular galaxy clusters. Below this temperature, as the role of preheating becomes progressively important, the gas mass-temperature relationship of our best model tends to steepen promptly, adopting power-law indexes between 2.3–2.5. Not surprisingly, the best-fit linear log-log correlation determined by Mohr et al. (1999) to their data produced a slope of , intermediate between these two behaviors.
The fact that our solution exhibits a nearly constant slope (there is only a hint of convexity) somewhat steeper than the self-similar value of 1.5 does not come as a surprise if one considers that the behavior of the relationship reflects those of the ratios and . While the identity between the effective gas and dark matter virial temperatures and the proportionality of the density distributions of these two main components for all radii are common assumptions in the modeling of X-ray halos, our results illustrate that they are only convenient approximations. Thus, within our scheme, even an isothermal gas with null non-gravitational heating (otherwise the gas temperature is pushed well above ), leads to values of the ratio between the X-ray luminosity-weighted and virial temperatures that, in general, border on, but are not equal to the unity (indeed, in all the solutions investigated this ratio shows a monotonic increase with increasing halo concentration). On the other hand, the hotter systems tend to be more gas-rich than the cooler ones, a tendency that preheating accentuates by preventing gas from reaching a high density in the central regions Bialek et al. 2001; McCarthy et al. 2002; see also Sec. 4.3.1.


Finally, we have compared in Figure 6 the temperature dependence of the gas mass fraction as predicted by our preferred model —calculated by simply dividing the previously inferred masses and as a function of the emission-weighted temperature— with data from Mohr et al. (1999). Looking at this plot one sees that, regardless of the considerable amount of scatter in the measurements, the prediction corresponding to our preferred model again explains the observations remarkably well. One can also observe that our model prognosticates a progressive steepening of the slope, from cluster to group scales, which we cannot validate because of the insufficient dynamical range of the data available but note the apparent consistency of our prediction with the trend delineated by the data of Sanderson et al. 2003 in their Fig. 5. We find that the total gas mass fraction within , , levels off to values within about of the cosmic value for emission weighted temperatures above 3–4 keV (i.e. for virial masses above (3–4) M⊙), while it becomes directly proportional to for less massive systems, which, in turn, implies that in the hot group regime. This is a mass dependence somewhat weaker than the self-similar behavior predicted by the models of Balogh et al. (1999) and Dos Santos & Doré (2002). Note also that our results are consistent with the well-known fact that pressure forces arising from a high entropy floor (see next section) can efficiently shut off the gas supply to the halos, reducing the amount of baryons that end up gravitationally bound (Cavaliere et al., 1998; Muanwong et al., 2002; Oh & Haiman, 2003) and resulting therefore in smaller total baryon fractions for halos with shallow potential wells.
4.2. Scaling Relations for the Entropy
A particularly interesting source of information about deviations from self-similarity is the gas entropy, as it is a record of the thermodynamic history of the diffuse baryons in clusters and groups of galaxies. In X-ray studies this property is customarily represented by the entropy of the gas electrons, which we infer from the expression
| (19) |
with the function that renormalizes the number density of gas particles to the number density of electrons444As in our model , the ratio depends, for a given , on the halocentric distance.. In the last few years, a substantial amount of observations on the scaling properties for the entropy on both the inner and outer regions of galaxy systems have become available. As noted earlier in the Introduction, such observations have served to establish that X-ray clusters and groups show entropy excesses with respect to the expectations from pure gravitational shock-heating (e.g., Ponman et al., 1999; Lloyd-Davies et al., 2000) that are not restricted only to their central regions (Finoguenov et al., 2002; Ponman et al., 2003).
In order to confront our predictions with data from the observational studies just mentioned, we have calculated the central gas entropy (from eq. [19]) at a scaled radius of against mean gas temperature within , while to estimate the entropy level on the halo outskirts we have chosen the adiabat at scaled by , the total mass within this radial distance expressed in units of M⊙, as a function of the total system mass .
Data and model predictions are compared in Figure 7. For the inner entropy (left panel), our results describe, reasonably well, the data points from Ponman et al. (2003) given their large observational uncertainties. As shown in the plot, our prediction deviates progressively from the scaling followed by the high temperature systems, reaches a minimum value between 1 and 2 keV, and rises again for the coldest objects. Remarkably, this behavior is relatively consistent with the trend described by the data in the pioneering studies of the entropy by Ponman et al. (1999) and Lloyd-Davies et al. (2000), which predicted an entropy floor at group scales with a typical value of 126 keV cm2 (for our adopted ) not too different from the minimum value reached by our model, although in their sparse data there was no sign of a recovery of the entropy at the low-temperature end. However, the measurements in the much larger sample gathered by Ponman et al. (2003) appear rather to delineate an ’entropy ramp’, meaning that the departure from the self-similar scaling is more accurately represented by a gradual monotonic deviation characterized by a logarithmic slope of about 2/3. Quite interestingly, though, further data coming from elliptical galaxies (O’Sullivan, Ponman, & Collins, 2003) —which we recall cannot be consistently explained by our modeling— show some objects with very high central entropies. Given the good agreement of the predicted gas temperatures with observations (see Fig. 4), this possible mismatch of the central entropy for the coldest systems may be attributed to the fact that their associated central gas densities are typically lower than actual measurements compare, for instance, our results in Sec. 4.3.1 with Fig. 8 of Sanderson & Ponman 2003.
In Figure 7 (right) the predictions of our preferred model for the scaling of the ’reduced’ outer entropy, , against system mass are compared with the data from Finoguenov et al. (2002). As seen from the figure, in this case the mean trend drawn by the full set of data points is followed with impressive fidelity by the theoretical curve. Nevertheless, our results introduce two major modifications with respect to the interpretation given by Finoguenov and coworkers. First, we find that excess entropy should be present across the full mass range of galaxy systems and not only in those below a certain mass threshold in line with the interpretation given in Ponman et al. 2003. And second, the scaled entropy of the model shows a monotonic increase with decreasing halo mass, thereby implying the absence of the ’entropy ceiling’, i.e., of the upper limit on the preheating, that was claimed to be present in the ASCA observations. As in Finoguenov et al. (2002), we also have included in the plot the entropy resulting from purely gravitational heating (accomplished by setting to zero). Under these conditions, we predict a nearly constant scaled entropy of keV cm2 —consistent with the expectation that under self-similarity conditions scaling by should renormalize the entropy to a value independent of system temperature— that clearly fails to explain the observations.
4.3. Equilibrium Configuration of the Gas Distribution
We now present our model predictions for the internal structure of the IHM. We first focus on the spatially resolved properties of the X-ray-emitting gas and then confront the gradients of the surface brightness and projected temperature profiles with X-ray data.
4.3.1 Intrinsic Profiles
In Figure 8 we plot the three-dimensional radial profiles of the scaled X-ray gas temperature, mass density, and entropy, as well as of the integrated gas mass fraction, for a set of representative halo masses at . Radial distances are given in units of so as to facilitate the comparison among profiles of different masses and with the results of previous works. Quite remarkably, the gas temperature and density profiles (and hence the entropy profiles) for halo masses above M⊙ look very similar when scaled to their central values, although we recall that, in profiles of the NFW-like form, the radial coordinate must be expressed in units in order to make it truly independent of the halo mass (see, for instance, the model eqs. in § 2.1 and 2.2). Only the less massive (coldest) systems tend to have slightly shallower profiles as a result of the increasing influence of preheating. In contrast, the bottom panel of Figure 8 shows that the variation of the predicted gas fraction with radius, which with the exception of the outer regions () of the most massive systems ( M⊙) decreases monotonically toward the halo centers, depends strongly on the halo mass (temperature), mirroring the trend seen in Figure 6 for the global values: the more massive the halos, the higher the profile amplitude. This behavior agrees quite nicely with the most recent observational determinations of this property by Sanderson et al. (2003), illustrating that the distribution of the IHM does not follow that of the dark matter, but is significantly less concentrated as was expected (see below).

The good agreement with observations is specially exciting for the entropy profiles. On one hand, none of our profiles, even for the smallest halos, is fully isentropic, thus invalidating one of the major criticisms against universal preheating gas models consisting in the production of flat entropy gradients for group-sized halos. On the other hand, our model reproduces quite well, for all but the less massive systems, the outer radii behavior observed by Ponman et al. (2003) and predicted in the gravitational shock-dominated regime of entropy production by both theoretical prescriptions based on spherical accretion within a NFW dark matter halo (Eke et al., 1998; Tozzi & Norman, 2001; Babul et al., 2002) and the latest state-of-the-art cosmological gasdynamical simulations (Borgani et al., 2004). This result indicates that it is possible to reconcile the large entropy excesses seen at large radii, which suggest that entropy profiles are dominated throughout by the effects of non-gravitational preheating, with the fact that their typical outer slopes scatter about the value predicted from shock heating, without requiring any specific fine tunning of the model. Interestingly enough, the simulations by Finoguenov et al. (2003) show that heating with an equal amount of energy per particle produces entropy profiles that are similar to those arising from accretion shocks of fixed strength.
A final aspect concerning the entropy profiles that we wish to point out is that, if we apply the same scalings as in Finoguenov et al. (2002), our universal preheating model reproduces, very satisfactorily, the behavior and amplitude at all radii of the deprojected profiles measured by these authors (see also Ponman et al., 2003). In particular, we are capable of replicating the strongest rise with radius of the richest clusters and both the flatter and higher entropy levels, especially at smaller radii, found for groups. As we have not included radiative cooling in our treatment, this suggests that the possible effects of this latter mechanism might not be excessively important, even in the central regions of massive clusters.

The three-dimensional radial profiles of the gas density have been also redrawn in Figure 9 to provide an example of the impact of preheating on the gas distribution. As in Figure 8, we plot the profiles, now expressed in physical units to allow a direct comparison with observations, corresponding to five halos with different masses ranging from to M⊙. Two sets of curves are shown: one corresponding to our best model and the other to the canonical ’non-radiative’ conditions. It can be seen that preheating manifests itself as a substantial reduction of the hot gas density in the central halo regions. In agreement with expectations, this reduction is strongest for the low-mass systems. Clearly, as the halo mass is lowered, the gas becomes less concentrated and exhibits a bigger core. Also evident is the fact that the gas distribution in the outer halo regions for systems with M⊙ is more extended (i.e., the density at a given radius is raised) than that corresponding to the prediction. In contrast, the effects of preheating lead to a substantial increase in the gas temperature and entropy toward the halo centers as similarly reported by McCarthy et al. 2002 and Babul et al. 2002, not quite unlike the predictions by galaxy formation-regulated gas evolution models (e.g., Wu & Xue, 2002).
4.3.2 Surface Brightness Profiles
The observed X-ray surface brightness at a projected scaled (by ) radius from the center of a spherical halo is given simply by the Abel integral555While strictly the integral along the line-of-sight (20) should extend to infinity, the applicability of the Jeans equation (8) beyond becomes questionable.
| (20) |
where is the distance along the line-of-sight and is the X-ray volume emissivity within the energy band of the observations. It turns out that our predicted X-ray surface brightness profiles in the ROSAT broad (0.1–2.4 keV) band are a reasonable match to the conventional -model, , within . Beyond this radius, the projected gas emission initiates a rapid downfall due to the finite outer boundary of the integral (20). Thus, for the purposes of comparison with the existing X-ray imaging measurements, the resulting profiles of present-day halos have been matched by -models over the radial interval , which corresponds approximately to extending the fit out to half the virial radius, and the best-fit values of the slope and core radius have been compared with their observational determinations. We note that the portion of the profile being fitted is consistent with the fact that measurements of the X-ray surface brightness of clusters and groups generally embrace only a fraction of their total radius.

Figure 10 shows how the predicted dependence of our best-fit -model parameters on compares to data extracted from the same catalogs used in the investigation of the mass-temperature relation, with the emission-weighted temperatures quoted by Sanderson et al. (2003) conveniently rescaled (see § 4.1). Although the large dispersion in each parameter at a given temperature does little to constrain the model predictions, our theoretical curves fare, once more, quite satisfactorily, as they appear to roughly track the mean trends that would be inferred from ’chi-by-eye’ fits to the data points. Quite remarkably, the prediction for the slope parameter supports the frequently advocated case for flatter surface brightness profiles for groups (e.g., Ponman et al., 1999; Helsdon & Ponman, 2000; Mulchaey et al., 2003; Osmond & Ponman, 2004), while for high-mass systems it typically approaches the self-similar value of 2/3 (Jones & Forman, 1984). On the other hand, the predicted increase of the central gas density concentration with the power of the gas temperature is also consistent with the data, which suggests further a possible sharp drop of for systems with X-ray temperatures 1 keV. Regarding this latter possibility, we point out that, as shown by Voit et al. (2002), observational systematics such as the range of radii in the fit and surface brightness bias can affect measurements for low temperature systems. In the former case, we have verified that fitting over the radial range essentially involves an overall reduction of the amplitude of the predictions, while raising the surface brightness threshold, which makes the best-fit values of and both decline faster with decreasing has, however, the undesirable consequence of excluding from detection the coldest groups whose distinct behavior one is trying to describe.
4.3.3 Projected Temperature Profiles

As a last check of the consistency of our model, we have calculated the two-dimensional projection of the emissivity-weighted temperature profile of the halos (eq. [17]), which is defined as
| (21) |
Figure 11 illustrates the predictions by our preferred model for the projected emission-weighted temperature profiles of five halos with present-day masses equally spaced (in logarithmic scale) between and M⊙, which rise uninterrupted toward the halo centers. Interestingly, our results for masses above M⊙ (i.e., keV) compare very favorably with the composite radial temperature profile by Markevitch et al. (1998). From an analysis of ASCA spatially resolved spectroscopic data for a set of nearby clusters with mean spectral temperatures above 3 keV, these authors found that the radial run of the temperature for symmetric, cooling-flow corrected, clusters showed a nearly universal outward decline between and corresponding to a polytropic index (with errors). We note that the model profiles have been scaled by , the average temperature within , in an attempt to represent more accurately the scaling by the average temperatures calculated over the radial range covered by Markevitch et al.’s data. A different (similarly realistic) normalization would have only a marginal impact on the profiles and would not change our conclusions.
Albeit in another work based on ASCA observations Finoguenov et al. (2001) reported a similarly outward decreasing behavior, the results by Markevitch et al. (1998) have nonetheless been controversial, with some other ASCA papers claiming consistency with overall isothermality (White, 2000). Besides, there is the well-known analysis of Beppo-SAX data by De Grandi & Molendi (2002), who derived profiles similar to those of Markevitch et al. (1998) in the outer cluster regions, but not in the very centers, where they observed flat temperature gradients for radii smaller than . Other Beppo-SAX studies of a more limited radial extent produced temperature profiles that were generally flat or even rising slightly out to of the virial radius (Irwin & Bregman, 2000). Now, however, the latest results by Chandra appear to confirm quite nicely the steady decrease of the gas temperature in the radial range, although the central peak at looks like an artifact of the cooling flow modeling, as ASCA could not resolve the centers well666As our model, by design, ignores radiative cooling, we cannot account for the smooth decline of the temperature toward the center observed in the innermost regions () of some massive clusters with strong cooling flows (e.g., Allen, Schmidt, & Fabian, 2001). (Markevitch 2004, private communication). Further support to an outward decreasing IHM temperature over a great deal of the radial range comes from the results of gasdynamic simulations both adiabatic (e.g., Ascasibar et al., 2003) and with cooling, star formation, and supernova feedback (Borgani et al., 2004; Ettori et al., 2004).
5. SUMMARY AND CONCLUSIONS
We have investigated the global and structural X-ray properties of the IHM in nearby groups and clusters of galaxies within a flat CDM cosmology using a simple, reasonably well specified analytic polytropic gas model relying on the inside-out growth of structure between major mergers. Among the different scenarios suggested in the literature as a means of explaining the well-established breakdown from the simplest self-similar predictions, we have focused on the one which assumes that the specific energy of the gas is increased by some arbitrary source of extragravitational heating before the virialization of galaxy systems. This additional injection of energy onto the intergalactic medium has been presumed to be independent of the virial mass of the halo where the hot gas is incorporated. We summarize our main findings below.
(i) A polytropic index , as many observations and numerical simulations suggest, offers the best consistency with the postulate that the specific energy balance between the two main halo components (dark matter and hot gas) is preserved when energy loses are negligible. This is the first time a theoretical model tackling the X-ray properties of relaxed galaxy systems —the condition that the preheated gas remains bound constraints our predictions to halos with present-day total virial masses above M⊙— provides a possible physical origin for such a value of . A natural consequence of this hypothesis is that the IHM properties must be essentially independent of the system formation redshift. Variations on the metallicity of the hot gas could be a possible alternative to claims that favor differences in the formation epoch as the primary source of the dispersion in the observed scaling relations at group ( keV) scales.
(ii) With fixed to 1.2, our hot X-ray gas model for group- and cluster-sized halos is capable of describing very accurately the observed mean trends of a set of representative scaling laws between bulk properties of this constituent for a level of energy injection of 0.55 keV per gas particle, low enough to be accessible to popular nongravitational heating sources such as supernovae and AGN. In particular, we infer mass-temperature relationships with slopes steeper than the self-similar prediction. For the relationship we find a nearly constant logarithmic slope of across most of the temperature range that initiates a slight offset toward lower masses for keV pointing to the locus occupied by early-type galaxy data. On the other hand, the correlation exhibits a slope similar to the relation for the hottest clusters that progressively steepens as the scale diminishes, suggesting that for group-sized systems the total gas fraction within the halo should grow steadily with mass approximately as . The model also allows us to confidently rule out purely isothermal () or adiabatic () descriptions of the X-ray data.
(iii) The scaling properties of the gas entropy are similarly well predicted. According to the results of our investigation, a preheating stage involving a relatively modest amount of energy injection of about half a keV per particle, suffices to explain, simultaneously, the near 100 keV cm2 level shown by the central entropy of halos at group scales and the higher entropy level of –500 keV cm2 seen in the periphery of these galaxy systems.
(iv) Only the prognosticated behavior of the inner entropy for the coldest systems appears to be in conflict with observations. Specifically, in halos with emission-weighted temperatures below keV our model indicates that the central entropy should increase with decreasing gas temperature, probably due to the substantial reduction in their central gas densities caused by preheating. In contrast, the preferred interpretation of the most recent observational data is that the central entropy obeys a non-self-similar power law form, , at all scales. However, the systematic and statistical uncertainties in observations resulting from limitations in the instrumental response and the intrinsic faintness of the groups are sufficiently important that a strong discrepancy cannot be claimed. Alternatively, one may also consider the possibility that a universal preheating model does not provide an accurate description of the IHM physics in the innermost regions of cold galaxy systems. This would be the case if the epoch of preheating occurs relatively late in the history of the universe, say at , so that most of the group cores, which tend to form early (–4) and settle later in the central regions of larger units, would be already in place when the energy boost takes place calculations by Oh & Benson 2003 using the Press-Schechter theory show that at about of the cluster progenitors would not be affected by preheating. This implies that heating could have been less efficient in raising the entropy of less massive systems because of the high density of their IHM, whose thermodynamic history would be then dominated by the small amounts of entropy acquired through gravitational shocks.
(v) The equilibrium gas profiles also agree quite nicely with recent observational results, suggesting that the assumed inside-out growth of structure after virialization offers a straightforward and sensible approximation to the evolution of the gas equilibrium profiles. Of particular relevance are our findings that the IHM does not show, contrarily to other pure preheating models, a largely isentropic core and that the outer logarithmic slopes of the entropy profiles for all but the coldest systems are quite similar to the 1.1 value expected from shock heating —without necessarily implying that this is the basic mechanism responsible for generating the observed excess entropy at large radii in groups and clusters of galaxies.
(vi) We infer, in addition, outward declining temperature profiles, much like most of the observational studies report outside the cluster centers and in line with the trends found in recent hydrodynamical simulations. Claims that the hot gas distribution within cluster-sized dark halos is well represented by a polytropic model with are reinforced further by the behavior predicted for the radial distribution of the projected emission-weighted temperature in relatively hot clusters (i.e., keV). However, our model cannot account for either the nearly isothermal profiles or the large flat cores detected in certain recent observational analyses of temperature gradients in clusters. Although the failure to reproduce these trends could reflect the need for incorporating some additional physics, such as a heat transport mechanism (e.g., thermal conduction) capable of bringing large regions of the IHM to the same temperature in a relatively short timescale, the fact is that the actual form of the profile that sets the norm for bound galaxy systems has yet to be settled.
Our conclusion from these results is that, in general terms, our universal preheating model predictions are very succesful in fitting the observational data. The good match is more remarkable if one takes into account that it has been achieved without resorting to elaborated schemes of energy injection and the additional freedom of including the effects of observational biases in the measured gas properties. Admittedly, processes deliberately excluded from our modeling, such as the condensation and removal of the lowest entropy gas from the IHM, must happen at some level because that is how galaxies and stars form within dark halos. Moreover, radiative cooling can help to reduce the energetic requirements for preheating while it might be necessary in order to explain the behavior of the temperature profiles in the innermost regions () of massive cooling-flow clusters revealed by new high-spatial resolution X-ray data. Nevertheless, the fact that the picture we are proposing can account, within current observational constraints, for the typical X-ray characteristics of nearby galaxy systems argues in favor of it as a useful description of the evolution of the intergalactic medium properties in the densest regions of the universe.
Yet the most important asset of the present work is perhaps that the X-ray properties of galaxy systems ranging from the coolest groups to the hottest clusters have been intimately linked to a successful analytic theory of the clustering history in the universe, thus providing an intertwined treatment for the formation and evolution of the structure of both nonbaryonic and baryonic matter that can be easily implemented in models of galaxy formation.
References
- Afshordi & Cen (2002) Afshordi, N., & Cen, R. 2002, ApJ, 564, 669
- Allen & Fabian (1998) Allen, S. W., & Fabian, A. C. 1998, MNRAS, 297, L63
- Allen et al. (2001) Allen, S. W., Schmidt, R. W., & Fabian, A. C. 2001, MNRAS, 328, L37
- Arnaud & Evrard (1999) Arnaud, M., & Evrard, A. E. 1999, MNRAS, 305, 631
- Ascasibar et al. (2003) Ascasibar, Y., Yepes, G., Müller , & V., Gottlöber, S. 2003, MNRAS, 346, 731
- Babul et al. (2002) Babul, A., Balogh, M. L., Lewis, G. R., & Poole, G. B. 2002, MNRAS, 330, 329
- Balogh et al. (1999) Balogh, M. L., Babul, A., & Patton, D. R. 1999, MNRAS, 307, 479
- Balogh et al. (2001) Balogh, M. L., Pearce, F. R., Bower, R. G., & Kay, S. T. 2001, MNRAS, 326, 1228
- Bell et al. (2003) Bell, E. F., McIntosh, D. H., Katz, N., & Wienberg, M. D. 2003, ApJ, 585, L117
- Bialek et al. (2001) Bialek, J. J., Evrard, A. E., & Mohr, J. J. 2001, ApJ, 555, 597
- Blanchard et al. (1992) Blanchard, A., Valls-Gabaud, D., & Mamon, G. A. 1992, A&A, 264, 365
- Borgani et al. (2001) Borgani, S., Governato, F., Wadsley, J., Menci, N., Tozzi, P., Lake, G., Quinn, T., & Stadel, J. 2001, ApJ, 559, L71
- Borgani et al. (2004) Borgani, S., Murante, G., Springel, V., Diaferio, A., Dolag, K., Moscardini, L., Tormen, G., Tornatore, L., & Tozzi, P. 2004, MNRAS, 348, 1078
- Brighenti & Mathews (2001) Brighenti, F., & Mathews, W. G. 2001, ApJ, 553, 103
- Bryan (2000) Bryan, G. L. 2000, ApJ, 544, L1
- Bryan & Norman (1998) Bryan, G. L., & Norman, M. L. 1998, ApJ, 495, 80
- Bullock et al. (2001) Bullock, J. S., Kolatt, T. S., Sigad, Y., Somerville, R. S., Kravtsov, A. V., Klypin, A. A., Primack, J. R., Dekel, A. 2001, MNRAS, 321, 559
- Cavaliere et al. (1998) Cavaliere, A., Menci, N., Tozzi, P. 1998, ApJ, 501, 493
- Cavaliere et al. (1999) Cavaliere, A., Menci, N., Tozzi, P. 1999, MNRAS, 308, 599
- Cavaliere et al. (2002) Cavaliere, A., Lapi, A., & Menci, N. 2002, ApJ, 581, L1
- Davé et al. (2002) Davé, R., Katz, N., & Weinberg, D. H. 2002, ApJ, 579, 23
- David et al. (1991) David, L. P., Forman, W., & Jones, C. 1991, ApJ, 380, 39
- David et al. (1996) David, L. P., Jones, C., & Forman, W. 1996, ApJ, 473, 692
- De Grandi et al. (2004) De Grandi, S., Ettori, S., Longhetti, M., & Molendi, S. 2004, A&A, 419, 7
- De Grandi & Molendi (2002) De Grandi, S., & Molendi, S. 2002, ApJ, 567, 163
- Dos Santos & Doré (2002) Dos Santos, S., & Doré, O. 2002, A&A, 383, 450
- Eke et al. (1998) Eke, V. R., Navarro, J. F., & Frenk, C. S. 1998, ApJ, 503, 569
- Eke et al. (2001) Eke, V. R., Navarro, J. F., & Steinmetz, M. 2001, ApJ, 554, 114
- Ettori et al. (2001) Ettori, S., Allen, S. W., & Fabian, A. C. 2001, MNRAS, 322, 187
- Ettori et al. (2004) Ettori, S., Borgani, S., Moscardini, L., Murante, G., Tozzi, P., Diaferio, A., Dolag, K., Springel, V., Tormen, G., & Tornatore, L. 2004, MNRAS, 354, 111
- Evrard et al. (1996) Evrard, A. E., Metzler, C. A., & Navarro, J. F. 1996, ApJ, 469, 494
- Finoguenov et al. (2001) Finoguenov, A., Arnaud, M., & David, L. P. 2001, ApJ, 555, 191
- Finoguenov et al. (2001) Finoguenov, A., Reiprich, T. H., & Böhringer, H. 2001, A&A, 368, 749
- Finoguenov et al. (2002) Finoguenov, A., Jones, C., Böhringer, H., & Ponman, T. J. 2002, ApJ, 578, 74
- Finoguenov et al. (2003) Finoguenov, A., Borgani, S., Tornatore, L., & Böhringer, H. 2003, A&A, 398, L35
- Frenk et al. (1999) Frenk, C. S., et al. 1999, ApJ, 525, 554
- Fukazawa et al. (1998) Fukazawa, Y., Makishima, K., Tamura, T., Ezawa, H., Xu, H., Ikebe, Y., Kikuchi, K., & Ohashi, T. 1998, PASJ, 50, 187
- Fukugita et al. (1998) Fukugita, M., Hogan, C. J., & Peebles, P. J. E. 1998, ApJ, 503, 518
- Helsdon & Ponman (2000) Helsdon, S. F., & Ponman, T. J. 2000, MNRAS, 315, 356
- Hiotelis (2003) Hiotelis, N. 2003, MNRAS, 334, 149
- Ikebe et al. (2004) Ikebe, Y., Böhringer, H., & Kitayama, T. 2004, ApJ, 611, 175
- Irwin & Bregman (2000) Irwin, J. A., & Bregman, J. N. 2000, ApJ, 538, 543
- Jing (2000) Jing Y. P. 2000, ApJ, 535, 30
- Jones & Forman (1984) Jones, C., & Forman, W. 1984, ApJ, 276, 38
- Kaiser (1986) Kaiser, N. 1986, MNRAS, 222, 323
- Kaiser (1991) Kaiser, N. 1991, ApJ, 383, 104
- Komatsu & Seljak (2001) Komatsu, E., & Seljak, U. 2001, MNRAS, 327, 1353
- Kravtsov et al. (2005) Kravtsov, A. V., Nagai, D., & Vikhlinin, A. A. 2005, ApJ, submitted
- Lacey & Cole (1993) Lacey, C., & Cole, S. 1993, MNRAS, 262, 627
- Lin et al. (2003) Lin, Y. T., Mohr, J. J., & Stanford, S. A. 2003, ApJ, 591, L749
- Lloyd-Davies et al. (2000) Lloyd-Davies, E. J., Ponman, T. J., & Cannon, D. B. 2000, MNRAS, 315, 689
- Loeb & Peebles (2003) Loeb, A., & Peebles, P. J. E. 2003, ApJ, 589, 29
- Loewenstein (2000) Loewenstein, M. 2000, ApJ, 532, 17
- Manrique et al. (2003) Manrique, A., Raig, A., Salvador-Solé, E., Sanchis, T., Solanes, J. M. 2003, ApJ, 593, 26
- Markevitch et al. (1998) Markevitch, M., Forman, W. R., Sarazin, C. L., & Vikhlinin, A. 1998, ApJ, 503, 77
- McCarthy et al. (2002) McCarthy, I. G., Babul, A., & Balogh, M. L. 2002, ApJ, 573, 515
- McCarthy et al. (2004) McCarthy, I. G., Balogh, M. L., Babul, A., Poole, G. B., & Horner, D. J. 2004, ApJ, 613, 811
- Mohr et al. (1999) Mohr, J. J., Mathiesen, B., & Evrard, A. E. 1999, ApJ, 517, 627
- Muanwong et al. (2001) Muanwong, O., Thomas, P. A., Kay, S. T., Pearce, F. R., & Couchman, H. M. P. 2001, ApJ, 552, L27
- Muanwong et al. (2002) Muanwong, O., Thomas, P. A., Kay, S. T., Pearce, F. R. 2002, MNRAS, 336, 527
- Mulchaey et al. (2003) Mulchaey, J. S., Davis, D. S., Mushotzky, R. F., & Burstein, D. 2003, ApJS, 145, 39
- Navarro et al. (1995) Navarro, J. F., Frenk, C. S., White, S. D. M. 1995, MNRAS, 275, 720
- Navarro et al. (1997) Navarro, J. F., Frenk, C. S., White, S. D. M. 1997, ApJ, 490, 493 (NFW)
- Nevalainen et al. (2000) Nevalainen, J., Markevitch, M., & Forman, W. 2000, ApJ, 536, 73
- Oh & Benson (2003) Oh, S. P., & Benson, A. J. 2003, MNRAS, 342, 664
- Oh & Haiman (2003) Oh, S. P., & Haiman, Z. 2003, MNRAS, 346, 456
- Osmond & Ponman (2004) Osmond, J. P. F., & Ponman, T. J. 2004, MNRAS, 350, 1511
- O’Sullivan et al. (2003) O’Sullivan, E., Ponman, T. J., & Collins, R. S. 2003, MNRAS, 340, 1375
- Pierce et al. (1994) Pierce, F. R., Thomas, P. A., & Couchman, H. M. P. 1994, MNRAS, 268, 953
- Ponman et al. (1999) Ponman, T. J., Cannon, D. B., & Navarro J. F. 1999, Nature, 397, 135
- Ponman et al. (2003) Ponman, T. J., Sanderson, A. J. R., Finoguenov, A. 2003, MNRAS, 343, 331
- Raig et al. (1998) Raig, A., González-Casado, G., & Salvador-Solé, E. 1998, ApJ, 508, L129
- Raig et al. (2001) Raig, A., González-Casado, G., & Salvador-Solé, E. 2001, MNRAS, 327, 939
- Reiprich & Böhringer (2002) Reiprich, T. H., & Böhringer, H. 2002, ApJ, 567, 716
- Renzini (1997) Renzini, A. 1997, ApJ, 488, 35
- Salvador-Solé et al. (1998) Salvador-Solé, E., Solanes, J. M., & Manrique, A. 1998, ApJ, 499, 542
- Salvador-Solé et al. (2005) Salvador-Solé, E., Manrique, A., & Solanes, J. M. 2005, MNRAS, in press (already on the OnlineEarly MNRAS page)
- Sanderson & Ponman (2003) Sanderson, A. J. R., & Ponman, T. J. 2003, MNRAS, 345, 124
- Sanderson et al. (2003) Sanderson, A. J. R., Ponman, T. J., Finoguenov, A., Lloyd-Davies, E. J., Markevitch, M. 2003, MNRAS, 340, 989
- Sutherland & Dopita (1993) Sutherland, R. S., & Dopita, M. A. 1993, ApJS, 88, 253
- Takizawa & Mineshige (1998) Takizawa, M., & Mineshige, S. 1998, ApJ, 499, 82
- Tegmark et al. (2004) Tegmark, M., Strauss, M. A., Blanton, M. R., et al. (the SDSS collaboration) 2004, Phys. Rev. D, 69, 3501
- Thomas et al. (2001) Thomas, P. A., Muanwong, O., Pearce, F. R., Couchman, H. M. P., Edge, A. C., Jenkins, A., & Onuora, L. 2001, MNRAS, 324, 450
- Tozzi & Norman (2001) Tozzi, P., & Norman, C. 2001, ApJ, 546, 63
- Tozzi et al. (2003) Tozzi, P., Rosati, P., Ettori, S., Borgani, S., Mainieri, V., & Norman, C. 2003, ApJ, 593, 705
- Vikhlinin et al. (1999) Vikhlinin, A., Forman, W., & Jones, C. 1999, ApJ, 525, 47
- Voit & Bryan (2001) Voit, G. M., & Bryan, G. L. 2001, Nature, 414, 425
- Voit et al. (2002) Voit, G. M., Bryan, G. L., Balogh, M. L., & Bower, R. G. 2002, ApJ, 576, 601
- White (1991) White, R. E. 1991, ApJ, 367, 69
- White (2000) White, D. A. 2000, MNRAS, 312, 663
- White et al. (1997) White, D. A., Jones, C., & Forman, W. 1997, MNRAS, 292, 419
- Wu et al. (1998) Wu, K. K. S., Fabian, A. C., & Nulsen, P. E. J. 1998, MNRAS, 301, L20
- Wu et al. (2000) Wu, K. K. S., Fabian, A. C., & Nulsen, P. E. J. 2000, MNRAS, 318, 889
- Wu & Xue (2002) Wu, K. K. S., & Xue, Y. 2002, ApJ, 572, L19
- Xue & Wu (2002) Xue, Y., & Wu, K. K. S. 2000, ApJ, 538, 65