The temperature structure in the core of Sérsic 159-03
Abstract
We present results from a new 120 ks XMM-Newton observation of the cluster of galaxies Sérsic 159-03. In this paper we focus on the high-resolution X-ray spectra obtained with the Reflection Grating Spectrometer (RGS). The spectra allow us to constrain the temperature structure in the core of the cluster and determine the emission measure distribution as a function of temperature. We also fit the line widths of mainly oxygen and iron lines.
keywords:
Clusters of Galaxies , X-rays , Cooling-flow1 Introduction
X-ray emission from clusters of galaxies is dominated by diffuse emission from virialized hot plasma which is trapped in the clusters gravitational potential. Current X-ray missions like XMM-Newton and Chandra show that the structures in the hot diffuse plasma can be very complex.
Recent high-resolution X-ray spectra of cool-core clusters by the RGS instrument aboard XMM-Newton Peterson et al. (2001, 2003) show that the cores of many clusters lack strong Fe XVII emission lines. This indicates that the amount of cool gas in the cores is too little to be explained by classical cooling-flow models (see e.g. Fabian, 1994). From the studies of larger samples of cool-core clusters with XMM-Newton Peterson et al. (2003); Kaastra et al. (2004) we learn that the cores are not isothermal, but probably multi-phase. The implication of the lack of cool gas is that cool-core clusters need an additional heat source to balance the radiative cooling of the gas.
In this paper we discuss the results of a 120 ks XMM-Newton RGS observation of the cluster of galaxies Sérsic 159-03. This cluster is relatively nearby and has a redshift of . We concentrate on the temperature structure of the core and the widths of the emission lines.
2 Spectral models
The temperature distribution in the complex cores of clusters and the amount of cool gas, can be determined from its spectrum and does not necessarily have to be resolved spatially. From the XMM-Newton data of a large sample of clusters we know that cluster cores can be best fitted with a differential emission measure (DEM) model (e.g. Peterson et al., 2003; Kaastra et al., 2004; de Plaa et al., 2004). In this model the emission measure () of a number of thermal components is distributed as a function of temperature (). This is shown in Eq. (1) adapted from Kaastra et al. (2004):
| (1) |
This distribution is cut off at some fraction of which is set to 0.1 times in this study. The model above is an empirical parametrization of the DEM distribution found in the core of many clusters. In this form the limit yields the isothermal model.
| Model | Linestyle | Mean | Cut-off | ||
|---|---|---|---|---|---|
| DEM | - - - - - | 3.0 keV | 0.4 | 2.33 keV | 0.1 |
| DEM | – – | 3.0 keV | 1.0 | 2.02 keV | 0.1 |
| DEM | 3.47 keV | 1.0 | 2.33 keV | 0.1 | |
| Cooling-flow | ——– | 3.0 keV | 0.1 keV |


Well resolved spectral lines are important for this model to give an accurate result, because the strength of each line has a unique dependence on the temperature. As an example, we show simulated RGS spectra of the Fe-L complex in Fig. 2. These spectra are simulated using four different sets of model parameters listed in Table 1. We assume a cluster spectrum emitted at the redshift of Sérsic 159-03 (=0.0564). The respective DEM profiles corresponding to these spectra are shown in Fig. 2. From this figure we see that the model with = 1.0 has a larger contribution of cold gas than = 0.4. In the spectrum (Fig. 2) this leads to enhanced line emission above 11 Å from ions like Fe XVII. Thus, by fitting high-resolution spectra with this model we are able to derive the shape of the temperature distribution.
The first two models listed in Table 1 show the difference between two values for . In order to compare the outcome of these models with single-temperature fit results found in other studies, we also calculate the weighted mean temperature of the DEM distribution. The third model in Table 1 is chosen in a way that the mean temperature of the distribution is the same as the one in the first model. Finally, the fourth model represents the isobaric cooling-flow model.
Because the RGS gratings operate without a slit, the resulting spectrum of an extended source is the sum of all spectra in the (in our case) field of view, convolved with the PSF (for a complete discussion about grating responses see Davis, 2001). Extended line-emission appears to be broadened depending on the spatial extent of the source along the dispersion direction. In order to describe the data properly, the spectral fits need to account for this effect. In practice, this is accomplished by convolving the spectral models with the surface brightness profile of the source along the dispersion direction. For that purpose we extract the cluster intensity profile from MOS1 along the dispersion direction of RGS, which we convolve with the RGS response during spectral fitting. This procedure is described in Tamura et al. (2004) and was also applied in studies like, for example, Kaastra et al. (2001) and de Plaa et al. (2004). Because the radial profile of an ion can be different from the wide-band surface brightness profile, this method is not ideal. In order to account for this, we let the scale of the width and the position of the profile free in the fit to match the profiles of the main emission lines.
3 Results
| Parameter | Value | Parameter | Value |
|---|---|---|---|
| (keV) | 4.08 0.16 | cut off | 0.05 0.04 |
| 0.43 0.03 | mean | 3.14 0.13 | |
| Line width (C,N,O) | 1.5 0.3 | Line width (Ne,Mg,Fe) | 0.57 0.07 |
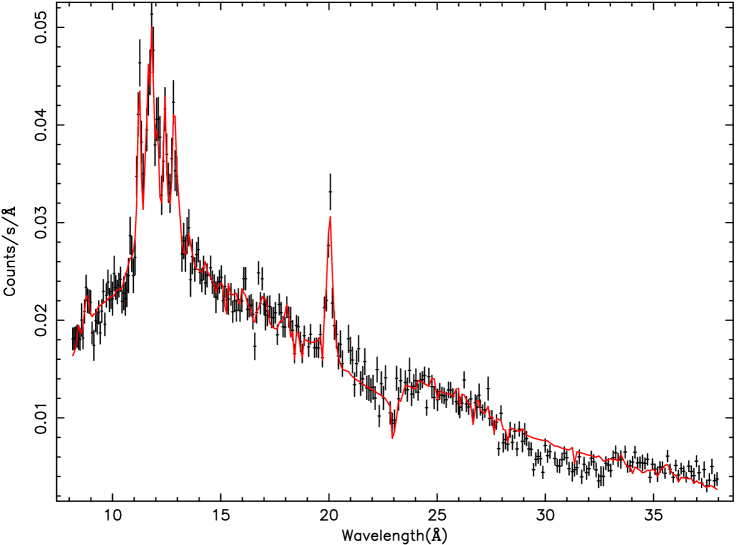
In Table 2 we show the results of a fit to the RGS spectrum of Sérsic 159-03 shown in Fig. 3. We extract this spectrum from a 4 arcmin wide region in the cross-dispersion direction of the RGS. The spectrum shows line emission from Fe-L, Ne, Mg and O. In the region between 14–19 Å no strong features from Fe XVII lines can be observed and therefore the fitted value of is moderate: 0.43 0.03. Together with the from the fit we find a mean temperature of the core of 3.14 0.13 keV. This value is not so different from the value of 2.80 0.08 keV obtained when fitting a single-temperature model to the data.

When we look into the 10–19 Å wavelength range and compare the best fit DEM model with the classical cooling-flow model, we obtain a spectrum like in Fig. 4. The lower and upper temperature limits of the cooling-flow model (continuous line) have been set to 0.1 and 4.0 keV respectively. The dashed-line represents the best fit DEM model and is the same as the model presented in Fig. 3. From this plot it is clear that the iron lines associated with the cold gas, which are predicted by the cooling-flow model, are not observed.
In Fig. 3 we can see by eye that the oxygen line near 20 Å is broader than the individual iron lines in the Fe-L complex at around 11–13 Å. A fit to the width of the lines confirms this view and shows that the line width of oxygen is nearly 3 times larger than the width of the iron lines. The lines of the other fitted elements (carbon, nitrogen, neon and magnesium) do not have a large signal-to-noise, therefore we couple their widths to either iron or oxygen. The line widths of carbon and nitrogen are coupled to oxygen, while neon and magnesium are coupled to iron. In Table 2 we show the widths of these lines with respect to the broad band cluster profile.
4 Conclusion
We performed a spectral analysis of the cool-core cluster Sérsic 159-03 using the RGS instrument aboard XMM-Newton. The high-resolution spectra of the core confirm the lack of cool gas in the core of the cluster in agreement with the results found by Peterson et al. (2001) and Peterson et al. (2003) in this and other clusters. From the line width of O and Fe we can derive the spatial distribution of the elements. Fe has a line width of 0.57 0.07 with respect to the profile of the continuum emission derived from EPIC MOS, while the O line is much broader with a value of 1.5 0.3. This means that the Fe distribution in the cluster is much more centrally peaked than the oxygen distribution. This is consistent with earlier measurements by e.g. Tamura et al. (2004).
References
- Davis (2001) Davis, J. E., 2001. The Formal Underpinnings of the Response Functions Used in X-Ray Spectral Analysis. ApJ 548, 1010–1019.
- de Plaa et al. (2004) de Plaa, J., Kaastra, J. S., Tamura, T., et al., 2004. X-ray spectroscopy on Abell 478 with XMM-Newton. A&A 423, 49–56.
- Fabian (1994) Fabian, A. C., 1994. Cooling Flows in Clusters of Galaxies. ARA&A 32, 277–318.
- Kaastra et al. (2001) Kaastra, J. S., Ferrigno, C., Tamura, T., et al., Jan. 2001. XMM-Newton observations of the cluster of galaxies Sérsic 159-03. A&A 365, L99–L103.
- Kaastra et al. (2004) Kaastra, J. S., Tamura, T., Peterson, J. R., et al., 2004. Spatially resolved X-ray spectroscopy of cooling clusters of galaxies. A&A 413, 415–439.
- Peterson et al. (2003) Peterson, J. R., Kahn, S. M., Paerels, F. B. S., et al., Jun. 2003. High-Resolution X-Ray Spectroscopic Constraints on Cooling-Flow Models for Clusters of Galaxies. ApJ 590, 207–224.
- Peterson et al. (2001) Peterson, J. R., Paerels, F. B. S., Kaastra, J. S., et al., Jan. 2001. X-ray imaging-spectroscopy of Abell 1835. A&A 365, L104–L109.
- Tamura et al. (2004) Tamura, T., Kaastra, J. S., den Herder, J. W. A., Bleeker, J. A. M., Peterson, J. R., 2004. The elemental abundances in the intracluster medium as observed with XMM-Newton. A&A 420, 135–146.