The impact of gas physics on strong cluster lensing
Previous studies of strong gravitational lensing by galaxy clusters have neglected the potential impact of the intracluster gas. Here, we compare simulations of strong cluster lensing including gas physics at increasing levels of complexity, i.e. with adiabatic, cooling, star-forming, feedback-receiving, and thermally conducting gas, along with different implementations of the artificial viscosity in the SPH simulations. Each cluster was simulated starting from the same initial conditions so as to allow direct comparison of the simulated clusters.
We compare the clusters’ shapes, dynamics, and density profiles and then study their strong-lensing cross sections computed by means of ray-tracing simulations. With the common viscosity implementation, adiabatic gas has little effect on strong cluster lensing, while lower viscosity allows stronger turbulence, thus higher non-thermal pressure and a generally broader gas distribution, which tends to lower lensing cross sections. Conversely, cooling and star formation steepen the core density profiles and can thus increase the strong-lensing efficiency considerably.
1 Introduction
How is strong lensing by galaxy clusters affected by the intra-cluster gas? So far, only the dark-matter distribution was considered for lensing, and it was ignored that on average approximately 10% to 15% of the cluster matter is contributed by the baryonic gas. This apparently small contribution may give rise to effects which can potentially change strong lensing by clusters considerably. Having seen that the central matter concentration in clusters, their asymmetries, and their substructures are all very important for the lensing effects they may create, and considering the non-linear properties of strong lensing (e.g. Bartelmann & Weiss, 1994; Bartelmann et al., 1995; Meneghetti et al., 2003; Torri et al., 2004), the gas physics may in fact have substantial consequences.
First, the finite pressure of the hot gas prevents it from forming density cusps. Thus, the gas distribution has to develop a more or less extended flat core which reduces the central density compared to a cluster composed only of dissipation-less dark matter. Second, the isotropic gas pressure tends to reduce asymmetries in the matter distribution and to reduce the matter concentration in cluster substructures. This, in turn, reduces the gravitational tidal field (the shear) of the cluster mass distribution. Both effects tend to act against strong cluster lensing and are, therefore, suspected to reduce the strong-lensing efficiency.
On the other hand, once gas is dense enough to cool on sufficiently short time scales, it can flow towards the centre and accumulate there. If it forms stars instead, those act as another component of dissipation-less matter and may build up matter densities in cluster cores which exceed those expected in dark-matter clusters. It is not clear from the start which of these effects will dominate and whether their competition always leads to the same result. As clusters form through subsequent mergers, their gas content will also modify the dynamics of the sub-halo accretion, shrinking the orbits of infalling sublumps and transporting part of their orbital angular momentum to the main body of the forming cluster due to friction and dissipation in the gas. Thus, the gas physics will change not only the density profile, the level of substructure, and the degree of asymmetry of clusters, but also modify their internal dynamics following merger events.
We use gas-dynamical cluster simulations here to investigate the impact of gas physics on strong lensing by clusters. Most galaxy clusters were simulated five times; with adiabatic gas, with adiabatic gas and a novel implementation of artificial viscosity, with cooling gas which forms stars, with cooling gas which forms stars and conducts heat, and with only dark matter for reference. In addition, we extracted cluster-sized halos from a super-cluster simulation which was performed with only dark matter and including adiabatic gas. All simulations for a single cluster start from the same initial conditions at early times so as to allow the cluster simulations to be directly compared. This cluster sample is described in Sect. 2. Its strong-lensing effects are studied in Sect. 3, and the results are summarised and discussed in Sect. 4.
2 The cluster sample and its physical properties
Our simulations were carried out with GADGET-2, a new version of the parallel TreeSPH simulation code GADGET (Springel et al., 2001). It uses an entropy-conserving formulation of SPH (Springel & Hernquist, 2002), and upon request provides radiative cooling, heating by a UV background, and a treatment of star formation and feedback processes. The latter is based on a sub-resolution model for the multi-phase structure of the interstellar medium (Springel & Hernquist, 2003a). For some of the cluster simulations we also used the new method for describing heat conduction in SPH, which is both stable and manifestly conserves thermal energy even when individual and adaptive time-steps are used (Jubelgas et al., 2004). This implementation assumes an isotropic effective conductivity parameterised as a fixed fraction of the Spitzer rate. It also accounts for saturation, which can become relevant in low-density gas.
The usual parameterisation of the artificial viscosity (Monaghan & Gingold, 1983; Balsara, 1995) in SPH for an interaction of two particles and includes terms to account for shear and bulk viscosity. It is switched on only if particles are approaching; and for usual cosmological SPH simulations, it can be written as
| (1) |
for and otherwise, using
| (2) |
Here , , and are the arithmetic means of the sound speed, the density, and the smoothing length, respectively. and are the interparticle distance and the relative velocity. is the mean between particles and of the viscosity limiting factor
| (3) |
which avoids spurious angular momentum and vorticity transfer in galactic disks, as suggested by Steinmetz (1996). The usual choice for the parameters is , , , and .
Some simulations were carried out using a modified artificial viscosity scheme suggested by Morris & Monaghan (1997), where every particle evolves its own viscosity parameter , which changes with time according to
| (4) |
This causes to decay to a minimum value with e-folding time , which we adjust so that decays over two smoothing lengths after the shock. The source term , which causes to grow as particles approach a shock, was assumed to be
| (5) |
We choose . Further details on this implementation and its consequences for the generation of turbulence within the intra-cluster medium will be described by Dolag et al. 2005 (in prep).
2.1 The cluster sample
We used simulations of four massive galaxy clusters spanning a mass-range between and . The cluster regions were extracted from a dissipation-less (dark-matter-only) simulation with a box-size of of a flat CDM model with , , , and (see Yoshida et al. 2001).
Using the “Zoomed Initial Conditions” (ZIC) technique (Tormen, 1997), they were re-simulated with higher mass and force resolution by populating their Lagrangian volumes in the initial domain with more particles, appropriately adding additional small-scale power. The initial particle distributions (before displacement) are of glass type (White, 1996).
Gas was introduced into the high-resolution region by splitting each parent particle into a gas and a dark-matter particle. Thereby, the gas and the dark-matter particles were displaced by half the original mean inter-particle distance, such that the centre-of-mass and the momentum were conserved. The final mass resolution of these simulations was and for dark matter and gas particles within the high-resolution region, respectively. Thus, the clusters were resolved with between and particles, depending on their final mass. In addition, we used the three most massive haloes from a re-simulation of a super-cluster region, originating from the same cosmological parent simulation, performed with the same resolution. These three haloes range in mass between and .
For all simulations, the gravitational softening length was kept fixed at comoving (Plummer-equivalent), and was switched to a physical softening length of at .
Selection of the initial region was done with an iterative process involving several low-resolution, dissipation-less re-simulations to optimise the simulated volume. The iterative cleaning process ensures that all these haloes are free of contaminating boundary effects up to at least 3 to 5 times the virial radius. With this usable volume being relatively large, the simulation also accurately resolves the clusters’ vicinity and thus includes the effects of all the filaments connected to the cluster.
We used five types of simulations of this galaxy-cluster set. They comprise simulations with only dark matter (DM), simulations following the adiabatic evolution of gas but ignoring radiative cooling (GAS), and simulations including radiative cooling, heating by a UV background, and a treatment of the star formation and feedback processes (CSF). The feedback scheme was calibrated to produce a wind velocity of . Another simulation type we used additionally includes thermal conduction, for which a fixed rate of times the Spitzer rate was chosen (CSFC). This choice for is appropriate in the presence of magnetised domains with randomly oriented -fields (e.g. Sarazin, 1988) or for a chaotically tangled magnetic field (Narayan & Medvedev, 2001). Finally, we used one type of adiabatic gas simulations in which we applied an implementation of the artificial viscosity, which damps the build-up of viscosity in the time domain and thus reduces it considerably where it is not needed (GAS_NV). The lower artificial viscosity and the absence of a limiting physical viscosity allow strong turbulence to build up in the centres of the simulated clusters. Its contribution to the pressure leads to a significant density decrease in the cluster cores. For more details, see Dolag et al. 2005 (in prep.).
2.2 Halo shape and particle angular momentum
Before discussing the lensing properties of our simulated galaxy clusters, we compare their shapes, density profiles, and angular momentum distributions for the five different physical gas models used in the simulations. Figure 1 shows typical profiles of the total density (dark matter and baryons) for the different types of gas physics. The most obvious difference is the steeper inner slope in the simulations with cooling and star formation. Although we use a state-of-the-art implementation of cooling, feedback, and star formation (Springel & Hernquist, 2003b), we should point out that it is not entirely clear how realistic the profiles for these simulations are close to the cluster centre, as the central cD galaxy will contribute substantially to the core density profiles (Lewis et al., 2000; Yoshida et al., 2002). The core density of stars in the simulations is larger than observed (the simulated clusters seem to suffer to some degree from over-cooling), but some authors (see Kravtsov et al. 2005) argue that part of the discrepancy may be due to stellar mass missed in the observations.
Despite the isotropic thermal gas pressure, the density profile in the GAS model is not significantly shallower than in the DM simulation. This can be understood from the fact that gas particles can reduce their angular momentum by collisions (see below), which lets them sink towards the cluster centre more easily. In the GAS_NV simulation, the additional pressure support due to strong turbulence allowed by the lower viscosity reduces the gas density in the inner region of the simulated cluster (see Dolag et al. 2005, in prep., for more detail). However, the impact of the turbulence on the density profiles of real clusters requires further investigation because there the physical viscosity, which is not yet included in the simulations, may or may not limit the amount of turbulence to smaller values.
The effects discussed here can also be seen in Fig. 2, which shows the baryonic mass fractions for the GAS and GAS_NV simulations, and the fractions of gas, stars, and the total baryon fraction for the CSF simulation of cluster g1 as a function of the radius of the sphere around the cluster centre in which it was computed. The baryon fractions of the GAS and CSF simulations are also in good agreement with the results obtained by Kravtsov et al. (2005).
Figure 3 displays the mass fraction of the particles with specific angular momentum against the threshold for the cluster g1 at redshift . Here, and are the angular momentum and the mass of the cluster particles, respectively. This quantity is plotted for the particles of the simulations with only dark matter and for the gas and dark matter particles of the simulation including adiabatic gas. The angular-momentum profiles of the GAS_NV, CSF, and CSFC simulations, which are not plotted for clarity, are qualitatively similar to the GAS case. Only particles with a distance smaller than from the cluster centre were included.
We see from this figure that the profiles of the dark-matter particles in the two different simulations are almost identical. However, the gas particles typically have a significantly lower specific angular momentum, and the same behaviour is also found in the simulations with cooling and star formation and in the simulations with the new model for artificial viscosity. When studying the time evolution of these profiles, we found that the specific angular momenta of both dark matter and gas particles are boosted towards higher values during mergers. Afterwards, the angular-momentum profile of the dark matter is almost conserved, while the gas relaxes and the particles lose specific angular momentum in collisions. This happens because the cluster halos lack a well-defined rotation axis and the orbital planes of gas particles have essentially random orientations. Collisions tend to average out differences in orbit orientation and thereby reduce the specific angular momentum of gas particles. Therefore, the difference between the specific angular momentum of dark matter and gas increases with each merger. We thus find somewhat larger deviations in large halos, which have on average experienced more mergers. Reducing their specific angular momenta allows the gas particles to sink more easily towards the cluster centre. A similar behaviour of the specific angular momenta of gas and dark matter was found by Navarro & Benz (1991) and Navarro & White (1994) in galaxy-sized halos.
By comparing the monopole to the quadrupole moment in circular shells around the cluster centre, we recover the result obtained by Kazantzidis et al. (2004), who found that halos are more spherical in the simulations with cooling, feedback, and star formation than in the dissipation-less and adiabatic gas simulations. For example at the scale radius we find 15 percent smaller ratios of quadrupole to monopole moments in projections of simulations with cooling and star formation. We also find more substructure in the form of small clumps in the CSF and CSFC models.
3 Strong lensing cross sections
3.1 Numerical methods
The centre of each cluster is found by using the halo-finder algorithm discussed in Tormen et al. (2004). It estimates the dark-matter density at the position of each dark-matter particle by determining the distance to the tenth-closest neighbour and by also assuming that the density at the particle position is proportional to . Starting there, the virial sphere of the particle distribution is found, in which the gravitational potential is determined. The halo centre is then taken to be at the potential minimum.
For studying the lensing properties of each cluster, we chose a sphere of comoving radius around the cluster centre and projected all cluster particles inside this region onto an equidistant grid with a resolution of cells. For the projection we used the same cubic spline function which is used in the GADGET code as the SPH smoothing kernel (Springel et al., 2001). We projected by calculating the overlap of the projected spline function and the square representing the pixels of the grid.
From the projected mass map, we calculated the convergence and its Fourier transform , which is related to the Fourier transform of the lensing potential by
| (6) |
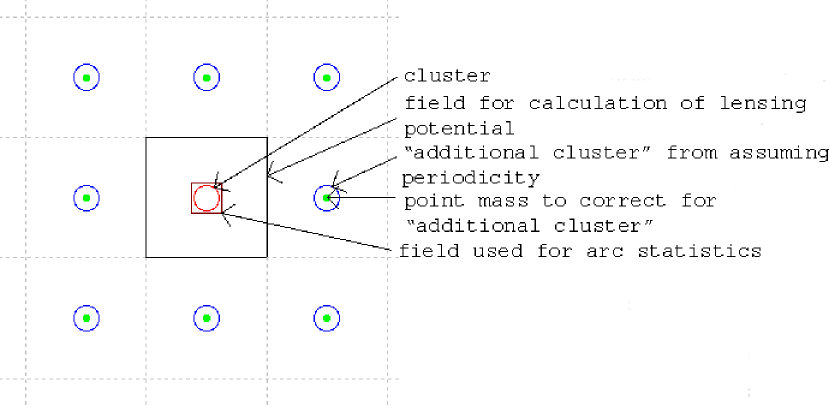
Employing fast-Fourier methods for deriving the lensing potential according to this equation is, however, problematic. Discrete Fourier transform algorithms assume that the function to be transformed is periodic on its support, which is not the case for isolated and finite cluster convergence fields. Equation (6), therefore, does not yield the lensing potential of a single cluster, but that of an infinite, two-dimensional array of clusters (see Fig. 4), in which the original cluster is repeated on a grid whose periodicity is set by the side length of a single cluster field ( comoving in our case).
Thus, a sufficiently accurate result is only achieved close to the centre of the cluster field. For reducing the error, we could surround the cluster by an even larger zero-padded field. However, doing so without losing resolution substantially increases the demands on computer memory and slows down the computation. We have therefore chosen to use a new method to correct for these errors. We place a point mass that concentrates the total projected mass of the cluster at the cluster’s centre-of-mass. We then calculate the lensing potential for an array of these point masses with the Fourier method mentioned above. Next, we analytically subtract the lensing potential of the single point mass located at the cluster’s centre-of-mass so as to obtain the lensing potential of an array of point masses with one mass missing at the position of the original cluster. Subtracting this from the potential obtained for the array of clusters, we correct for the additional clusters implicitly produced by the fast-Fourier algorithms, which assume a periodic convergence array. The remaining error comes only from the higher multipole moments of these additional clusters and can be neglected in the central sixteenth ( points) of the grid which we use for doing arc statistics. From this corrected lensing potential, we calculate the deflection angle.
For finding the images of a number of sources large enough for statistical analysis, we follow the method introduced by Miralda-Escude (1993a, b) and adapted to non-analytic models by Bartelmann & Weiss (1994) and Bartelmann et al. (1995). A previous version of our algorithm is also discussed in some detail in Meneghetti et al. (2000). It places elliptical sources with an equivalent radius of 0.5 arc seconds on an adaptive grid in the source plane, which is fixed at redshift 1.5 (the lens redshift is taken to be the redshift of the simulation snapshot), such that there is an increasing density of sources close to the caustics. A statistical weight is assigned to each source, which is given by the area represented by the source.
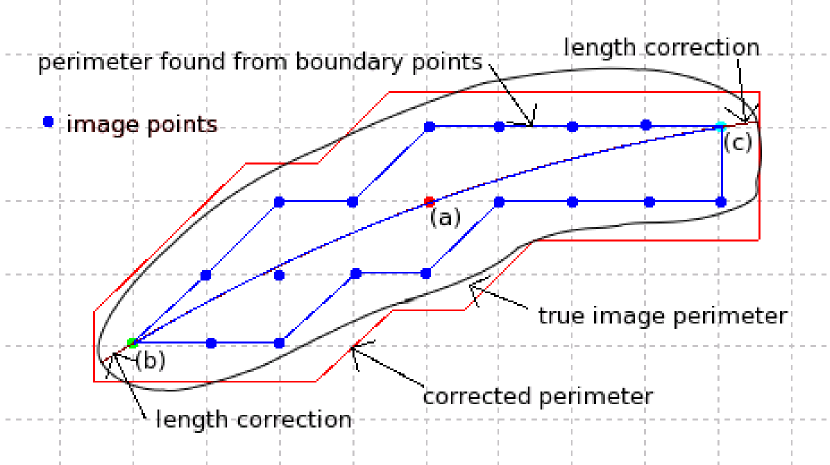
Next, the deflection angles are used to trace light rays backwards and map each grid point from the lens plane to the source plane. The images of a source are found by checking which grid points, when mapped back to the source plane, are enclosed by the ellipse corresponding to the source considered. To determine the image properties (e.g. length , width , and curvature radius ), we find the image point (a) which, when mapped to the source plane, falls closest to the source centre. We then find the image point (b) which is the farthest from (a), and the image point (c), which is the farthest from (b). The method is illustrated in Fig. 5.
We could fit a circle through these three points and use the arc length from (b) to (c) as the length of the image. We would then determine the image perimeter by walking along the ordered boundary points and summing up their mutual distances. But since grid cells in the lens plane are only classified as belonging to the image if their centres fall within the source, the boundary points of the image (including (b) and (c)) will on average be about half a grid constant further inside the image than the true perimeter. Thus, we would systematically underestimate the length of the image by roughly one grid constant. We would also underestimate the perimeter of the image. We correct for this by adding one grid constant to the arc length from (b) to (c) to obtain the image length, and four grid constants to the sum of the distances of the boundary points to find the image perimeter. This is also shown in Fig. 5. We found that these new corrections further reduce the weak dependence of the lensing cross section on the resolution of the grid used for its computation.
The image area is calculated directly from the number of image points. As discussed in Meneghetti et al. (2000), we search a simple geometric figure (ellipse, circle, rectangle or ring) with equal area and length to determine the image width , which is approximated by the minor axis of the ellipse, the diameter of the circle, the smaller side of the rectangle or the width of the ring, respectively. We choose the type of the figure by comparing its circumference to the perimeter of the image, which we find using the method discussed above.
We finally determine the lensing cross section by summing up the statistical weights of the sources having images with a length-to-width ratio and calculating the comoving area corresponding to it. If there is more than one such image for a source, we multiply the statistical weight of this source by the number of these images.
3.2 Results
We used the method discussed above to find the strong-lensing cross sections of the clusters g1, g8, g51, g72, and of the three largest halos in the super-cluster simulation g696. We did this for 43 simulation snapshots with redshifts ranging between 0.1 and 1.05, and for the five different physical gas models discussed in Sect. 2, except for g696, for which only DM and GAS simulations are available. For each halo, we used three different projections, namely along the , and axes of the simulation boxes in which the clusters are randomly oriented.
In Fig. 6, we plot the cross section as a function of redshift for one of the projections of g51. We can see that despite the gas pressure, adiabatic gas with the standard artifical viscosity does not reduce the strong lensing cross section compared to the dark-matter-only simulation. Using the new artifical viscosity scheme, however, leads to somewhat smaller cross sections due to the more extended gas distribution it implies. On the other hand, cooling, star formation and feedback make the simulated cluster a significantly more efficient lens. These three properties are typical for most of the clusters we have studied. There is generally no large difference between the DM and (adiabatic) GAS models, a somewhat smaller cross section in the GAS_NV model, and cross sections larger by a factor of 1.5 to 3 in the CSF and CSFC models. In some cases, however, even the adiabatic gas with standard artifical viscosity causes an increase in the cross section compared to the simulations containing only dark matter. This is illustrated in Fig. 7.
For determining the impact of cluster ellipticity and substructure on the strong lensing cross sections, we transform the maps of the surface mass density of our cluster halos to polar coordinates (centred on the cluster halo) and average over the polar angle to obtain maps of an axially symmetrised cluster. Then, we use the same methods as before to compute strong-lensing cross sections.
Figure 8 shows the cross sections of the GAS and CSF versions of g51 and of its axially-symmetrised GAS and CSF counterparts. One can clearly see that substructure and ellipticity significantly increase the strong-lensing cross sections (see also Bartelmann et al. 1995 and Meneghetti et al. 2003). Note also that the increase of the cross section in the CSF simulation, compared to the GAS simulation, is almost the same for the original cluster and its axially-symmetric variant. This can be interpreted such that this increase in the cross section in the cooling and star formation simulations is caused mainly by the steeper density profile and not by any changes of the ellipticity or the substructure.
There is also no qualitative difference between the lensing properties of the simulated clusters and the largest halos of the simulated super cluster region.
The different physics in the simulations with only dark matter particles compared to simulations including gas directs sub-halos passing close to the main halo during a merger into different orbits. Compared to the dissipation-less simulation with only dark matter, the sub-halo loses angular momentum and energy in the gas-dynamical simulations and is directed into a less elliptical orbit. It therefore returns earlier for the next passage of the main halo’s centre. This is illustrated in Fig. 9, which shows the position of a sub-halo in the rest frame of the main halo of the cluster g72. Note that the and axes are scaled differently for clarity. The sub-halos in the DM and GAS simulations initially move approximately synchronously and approach the main halo with almost the same velocity. Later, however, the different dynamics makes the GAS sub-halo’s orbit substantially less elliptical, hence it returns earlier for the next core passage.
This effect also has an impact on the strong lensing cross section, because the cross section of a halo increases when a sub-halo crosses the cluster core during a merger (see Torri et al. 2004 and Meneghetti et al. 2004). In Fig. 10, the peaks in the cross section corresponding to the three successive passages, illustrated in Fig. 9, are marked by arrows for both the DM and the GAS simulations. The first peak happens in both cases at a redshift . The second and the third peaks, however, occur at significantly earlier times in the GAS simulation. The peak positions for the GAS_NV, CSF, and CSFC simulations are typically very similar to the GAS case. Note that the different heights of the first peak in the different simulations do not imply a fundamental difference, because the amplitude of sharp peaks depends strongly on the exact time when the snapshot was taken (the time resolution is just a few snapshots for the passage). Thus, a slight deviation in the timing may result in peaks with apparently very different heights.
4 Summary and discussion
We have compared the density profiles, shapes, and strong lensing properties of numerically simulated galaxy clusters. The simulations were performed starting from the same initial conditions, but with different gas physics. Five different gas-physical models were employed. They contain:
-
•
DM model: dark matter only;
-
•
GAS model: dark matter and adiabatic gas;
-
•
GAS_NV model: dark matter, adiabatic gas, and a new implementation of the artificial viscosity, reducing the viscosity where it is not needed;
-
•
CSF model: dark matter, cooling gas, a star formation model, and feedback;
-
•
CSFC model: dark matter, cooling gas, a star formation model, feedback, and thermal conductivity;
Our cluster sample consisted of four simulated galaxy clusters and the three largest halos of a simulation of a super-cluster region. We used 43 snapshots of these halos between redshifts and . For studying strong lensing, we used the three different projections along the coordinate axes of the simulation volume, and sources fixed at redshift .
We find significantly steeper inner slopes for the density profiles of halos simulated with cooling and star formation. On the other hand, adiabatic gas with a standard artifical viscosity, in spite of its isotropic thermal pressure, does not make density profiles shallower compared to the dissipation-less dark-matter simulations. This can be understood from the fact that gas can reduce its specific angular momentum by collisions. The orbits of gas particles in a cluster halo are randomly oriented. Collisions tend to average out these differences and thereby reduce the specific angular momentum of the gas, which helps the gas to move towards the cluster centre. This effect can also be seen in the specific angular-momentum profiles we present in Fig. 3. However, the additional pressure caused by strong turbulence in the GAS_NV simulation somewhat reduces the density close to the cluster centre.
We then performed ray-tracing simulations for the numerically simulated galaxy clusters to study their strong lensing properties. We calculated cross sections for long thin arcs with a length-to-width ratio equal to or larger than . For the simulations with cooling and star formation, we found significantly larger cross sections. Thermal conductivity has no big impact on strong lensing. Despite its pressure, adiabatic gas with standard artifical viscosity does not reduce the cross section for long thin arcs. In some cases, it even makes the cluster a more efficient lens. On the other hand, simulating adiabatic gas with the new scheme for reduced artifical viscosity leads to somewhat smaller strong lensing cross sections compared to the DM and GAS runs.
Note that despite our use of a state-of-the-art model for cooling, star formation, and feedback, the simulated clusters suffer from some over-cooling. Therefore, the density close to the centre and the increase of the strong lensing cross section may be over-predicted in the simulations with cooling and star formation compared to real clusters. Also, the impact of turbulence on galaxy clusters needs further investigation. In real clusters, the physical viscosity of the cluster gas, which is not yet included in simulations, will regulate turbulence and may lead to a smaller amount of turbulence than in the GAS_NV simulations. It will also be interesting to investigate the effect of this new scheme of artifical viscosity on simulations including cooling, star formation, and feedback.
To study the impact of ellipticity and substructure on the lensing properties we transformed maps of the surface mass density of our cluster halos to polar coordinates and averaged over the angle, so that we obtained maps of an azimuthally symmetrised halo. We compared the cross sections of these axially symmetrised clusters to those of the numerically simulated ones and found that ellipticity and substructure are important for strong lensing in all of the five gas physical models. However, their impact on the cross section turns out to be very similar in the simulations without and with cooling and star formation. Thus, the larger cross sections we obtained for simulations with cooling and star formation are mainly caused by the steeper density profile and not by changes in ellipticity and substructure.
Sub-halos passing close to the main halo lose angular momentum and energy and are directed into less elliptical orbits in simulations with gas compared to dark-matter-only simulations. During a merger, such a sub-halo will return at an earlier time for the next passage. Thus, mergers proceed faster in simulations with gas. This can also be seen in the strong lensing cross sections: typically, the peak corresponding to the first passage of a sub-halo happens at the same time in the dissipation-less and the gas-dynamical simulations, but the peaks corresponding to the next passages are shifted to earlier times in the simulations with gas.
The work presented here clearly shows that cluster gas can have a significant impact on strong lensing cross sections. However, the importance of the different effects (turbulence, cooling, star formation, mergers) is different for each individual cluster and changes during the cluster’s evolution. To infer cluster properties from observations and for studying the importance of these effects in real clusters, it is thus more promising to model observed clusters individually than to do statistical analyses of large cluster samples. For this it will be interesting to combine the lensing information with thermal Sunyaev-Zeldovich effect and X-ray observations. We are planning to simulate X-ray emission and thermal SZ effect for the numerical galaxy clusters used here and to study methods for combining such (mock) observations to model individual clusters and reconstruct their mass distributions.
Acknowledgements.
We are deeply indebted to Volker Springel for providing access to P-GADGET-2 prior to release, and for support in using and modifying it. The simulations were carried out on the IBM-SP4 machine at the Centro Interuniversitario del Nord-Est per il Calcolo Elettronico (CINECA, Bologna), with CPU time assigned under an INAF-CINECA grant, on the IBM-SP3 at the Italian Centre of Excellence “Science and Applications of Advanced Computational Paradigms”, Padova, and on the IBM-SP4 machine at the Rechenzentrum der Max-Planck-Gesellschaft with CPU time assigned to the Max-Planck-Institut für Astrophysik. E. P. is supported by the German Science Foundation under grant number BA 1369/6-1. K. D. acknowledges support by a Marie Curie Fellowship of the European Community program “Human Potential” under contract number MCFI-2001-01227.References
- Balsara (1995) Balsara, D. 1995, J. Comp. Phys., 121, 357
- Bartelmann et al. (1995) Bartelmann, M., Steinmetz, M., & Weiss, A. 1995, A&A, 297, 1
- Bartelmann & Weiss (1994) Bartelmann, M. & Weiss, A. 1994, A&A, 287, 1
- Jubelgas et al. (2004) Jubelgas, M., Springel, V., & Dolag, K. 2004, MNRAS, 351, 423
- Kazantzidis et al. (2004) Kazantzidis, S., Kravtsov, A. V., Zentner, A. R., et al. 2004, ApJL, 611, L73
- Kravtsov et al. (2005) Kravtsov, A., Nagai, D., & Vikhlinin, A. 2005, ApJ, submitted; preprint astro-ph/0501227
- Lewis et al. (2000) Lewis, G. F., Babul, A., Katz, N., et al. 2000, ApJ, 536, 623
- Meneghetti et al. (2004) Meneghetti, M., Bartelmann, M., Dolag, K., et al. 2004, A&A, submitted; preprint astro-ph/0405070
- Meneghetti et al. (2003) Meneghetti, M., Bartelmann, M., & Moscardini, L. 2003, MNRAS, 340, 105
- Meneghetti et al. (2000) Meneghetti, M., Bolzonella, M., Bartelmann, M., Moscardini, L., & Tormen, G. 2000, MNRAS, 314, 338
- Miralda-Escude (1993a) Miralda-Escude, J. 1993a, ApJ, 403, 497
- Miralda-Escude (1993b) Miralda-Escude, J. 1993b, ApJ, 403, 509
- Monaghan & Gingold (1983) Monaghan, J. & Gingold, R. 1983, J. Comp. Phys., 52, 374
- Morris & Monaghan (1997) Morris, J. & Monaghan, J. 1997, J. Comp. Phys., 136, 41
- Narayan & Medvedev (2001) Narayan, R. & Medvedev, M. V. 2001, ApJL, 562, L129
- Navarro & Benz (1991) Navarro, J. F. & Benz, W. 1991, ApJ, 380, 320
- Navarro & White (1994) Navarro, J. F. & White, S. D. M. 1994, MNRAS, 267, 401
- Sarazin (1988) Sarazin, C. L. 1988, X-ray emission from clusters of galaxies (Cambridge University Press, Cambridge)
- Springel & Hernquist (2002) Springel, V. & Hernquist, L. 2002, MNRAS, 333, 649
- Springel & Hernquist (2003a) Springel, V. & Hernquist, L. 2003a, MNRAS, 339, 289
- Springel & Hernquist (2003b) Springel, V. & Hernquist, L. 2003b, MNRAS, 339, 312
- Springel et al. (2001) Springel, V., Yoshida, N., & White, S. 2001, New Astronomy, 6, 79
- Steinmetz (1996) Steinmetz, M. 1996, IAUS, 171, 259
- Tormen (1997) Tormen, G. 1997, MNRAS, 290, 411
- Tormen et al. (2004) Tormen, G., Moscardini, L., & Yoshida, N. 2004, MNRAS, 350, 1397
- Torri et al. (2004) Torri, E., Meneghetti, M., Bartelmann, M., et al. 2004, MNRAS, 349, 476
- White (1996) White, S. 1996, in Cosmology and Large-Scale Structure, ed. R. Schaeffer, J. Silk, M. Spiro, & J. Zinn-Justin (Elsevier, Dordrecht), 395
- Yoshida et al. (2001) Yoshida, N., Sheth, R., & Diaferio, A. 2001, MNRAS, 328, 669
- Yoshida et al. (2002) Yoshida, N., Stoehr, F., Springel, V., & White, S. 2002, MNRAS, 335, 762