Merging Galaxies in GOODS-S: First Extragalactic Results from Keck Laser Adaptive Optics
Abstract
The Center for Adaptive Optics Treasury Survey (CATS) aims to combine deep HST images in the optical with deep Keck adaptive optics (AO) data in the near-infrared (NIR) to study distant galaxies, AGN, and supernovae. We recently achieved an important new milestone by securing the first Keck laser guide star AO image of faint galaxies. Six galaxies with redshifts ranging from 0.3-1.0 were targeted in one pointing in the GOODS-S field. Two are Chandra Deep Field South sources, XID-56 and XID-536, with complex morphologies suggestive of recent merger activity. Substructures seen in the NIR AO image (FWHM ), including multiple tight knots in XID-56 and a double nucleus in XID-536, are confirmed in the optical HST images. These structures are unresolved in the best seeing-limited ( FWHM) NIR images. Stellar population synthesis models of the substructures indicate that XID-56 is a gas rich merger with a recent burst of star formation and significant amounts of dust. XID-536 appears to be a merger of two evolved stellar populations.
Subject headings:
galaxies: active – galaxies: jets – galaxies: stellar content – instrumentation: adaptive optics1. Introduction
For the past 10 years, the Hubble Space Telescope (HST) has provided deep, high-resolution imaging of galaxies in the optical, revealing structural parameters on kiloparsec scales to redshifts . Recently, the Keck laser guide star (LGS) adaptive optics (AO) system (P. Wizinowich et al. 2004) achieved similar resolution () in the NIR. The Great Observatories Origins Deep Survey (GOODS; Giavalisco et al. 2004) southern field was targeted during engineering time as part of the Center for Adaptive Optics Treasury Survey (CATS). The CATS project aims to combine deep optical HST imaging with high resolution AO data to study faint galaxies out to high redshift. The high resolution imaging from optical to NIR enables stellar population synthesis modeling of 1-2 kpc structures to redshifts and beyond. The addition of Keck AO to HST to band optical photometry provides a wavelength range sufficient to distinguish between old stellar populations and young, dusty star bursts. This work builds on previous natural guide star (NGS) AO imaging efforts by CATS team members, most notably Glassman et al. (2002) who discussed the evolution of structural parameters of galaxies in the NIR, and Steinbring et al. (2004), who combined HST and NGS AO images to study the structural parameters and stellar populations of galaxies at redshifts .
This attempt is the first time that GOODS-S has been observed with the Keck AO system. GOODS-S is free of bright stars () and therefore unsuitable for NGS AO with current high-resolution systems. The field, however, contains 20 stars bright enough for tip-tilt correction with the Keck LGS AO system (). We selected a pointing that contains six galaxies () including two Chandra sources (Giacconi et al. 2002) that appear in HST images to be galaxy mergers. This paper will present stellar population synthesis modeling of subcomponents within the two Chandra sources, XID-56 and XID-536 (ID’s from column 1 of the 1 Ms catalogue in Rosati et al. 2002). The analysis indicates that the stronger Chandra source, XID-56, is undergoing a dusty starburst. The weaker Chandra source, XID-536, appears to be a merger of two old stellar components.
We adopt Vega magnitudes and a flat, , cosmology throughout.
| XID11Rosati et al. 2002 | R.A. (J2000) | Dec. | z | 22Photometry based on the GOODS and images, Giavalisco et al. 2004. K-correction were performed as in C. Wilmer et al. 2005, in preparation. | 22Photometry based on the GOODS and images, Giavalisco et al. 2004. K-correction were performed as in C. Wilmer et al. 2005, in preparation. | log() [ergs/sec] |
|---|---|---|---|---|---|---|
| 56 | 03:32:13.24 | -27:42:40.9 | 0.61 33Szokoly et al. 2004 | -22.17 | 0.539 | 43.5 33Szokoly et al. 2004 |
| 536 | 03:32:10.76 | -27:42:34.6 | 0.42 44J. Lotz et al. 2005, in preparation | -21.69 | 0.752 | 41.9 55Estimated from the hard and soft x-ray fluxes in Rosati et al. 2002. |
2. Observations and Measurements
2.1. AO Observations
Observations were obtained with the Keck II (10m) telescope LGS AO system (Bouchez et al. 2004; P. Wizinowich et al. 2004) and the facility infrared science camera NIRC2, with a 1024x1024 Aladdin-3 InSb array. On October 4, 2004 UT, the GOODS-S field was imaged in (2.2 microns) with the wide camera of NIRC2, yielding 40 mas pixel scale over a field of view of 40x40. Individual frames were 120 seconds, taken using a 5x5 dither pattern with a typical dither separation of 3. The field was centered 20 southwest of an tip-tilt star ( 03:32:13.75, -27:42:13.9), and the laser was positioned in the middle of the field, roughly 10 from each Chandra source.
In addition to the science frames, images of the tip-tilt star were obtained in the LGS AO mode, in order to obtain an estimate of the on-axis point-spread-function (PSF). These images were taken with the 10 mas pixel scale to fully sample the PSF. The FWHM of the on-axis PSF is measured to be 0.06.
Image reduction was performed with typical reduction procedures of infrared imaging data (Glassman et al 2002). We found that best flat field images are created by combining all individual AO data frames. The flat-field is created by first masking off bad pixels and locations of objects. Since the background at fluctuates significantly due to variations in the OH night sky lines, a relative scale factor is calculated for each image, and this scale factor is applied to the frame before producing the flat-field image. The final flat is produced from the median of the scaled unmasked values at each pixel. Images are reduced by dividing them by the flat and then subtracting a constant equal to the average remaining sky flux. Images are de-warped through bi-linear interpolation to remove known field distortion within the camera (as much as 2 pixel deviation from a true rectilinear grid). Individual images were aligned by selecting two objects that are bright enough to be centroided within each frame. Once aligned, frames were combined into a final image by taking the median of the valid pixels at each location, yielding a total exposure time of 66 minutes.
2.2. Additional Data Sets
An advantage of observing in the GOODS field is the wide variety of publicly available data. This paper draws on the following: 1) the GOODS HST imaging (Giavalisco et al. 2004) in the and bands are used for morphology and optical photometry; 2) the 1 Ms Chandra Deep Field South (Giacconi et al. 2002) observation identifies and quantifies AGN activity; and 3) deep ISAAC imaging in the band (B. Vandame et al., in preparation) is used to flux calibrate our AO images.
Spectroscopic redshifts from Szokoly et al. (2004) for XID-56 and J. Lotz et al. (in preparation) for XID-536, confirm the photometric redshifts from COMBO-17 (Wolf et al. 2004).
2.3. Photometry and Basic Measurements
The AO observations are flux calibrated by matching objects in the deep ISAAC images of the same region. The color transformation between and is on the order of 0.05 mags or smaller, a difference that is not large enough to affect our conclusions.
Photometry of the HST and AO images of galaxies XID-56 and XID-536 was measured with circular apertures using the IDL APER program. Sky regions were chosen at radii free of contamination from objects. Section 4 presents the results of small aperture ( radius) photometry on the cores of each system, while Table 1 summarizes results of large aperture ( radius) photometry of the galaxies. Within Table 1 we list object XID (Rosati et al. 2002), R.A. and Dec., spectroscopic redshift (Szokoly et al. 2004; Lotz et al. 2005, in prep), restframe and derived from the 4-band HST photometry, and x-ray luminosity. A detailed description of the K-corrections is provided in C. Wilmer et al. (in preparation). The convolution between HST filter response curves and galaxy SEDs from Kinney et al. (1996) followed Fukugita, Shimasaku, & Ichikawa (1995), by resampling filters and spectra to the same dispersion (1 Å). Rest-frame color and magnitude are derived from observed color and magnitude as in Gebhardt et al. (2003). The x-ray luminosity of XID-56 is from Szokoly et al. (2004), while that of XID-536 is estimated from its measured hard and soft, x-ray fluxes (Rosati et al. 2002).
The photometry shows that both galaxies are luminous (L⋆) with XID-56 0.2 magnitudes () bluer than XID-536. XID-56 is a 40x stronger x-ray source than its redder counterpart and is classified as a Seyfert 2 galaxy based on its optical spectrum and x-ray emission (Szokoly et al. 2004).
3. Morphology
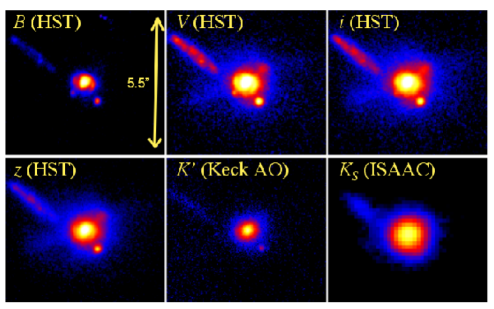
Both Chandra sources have morphologies suggestive of recent merger activity. Figure 1 shows the (HST) and (Keck AO) images for galaxy XID-56. Also shown is the ISAAC image which lacks the detail found in the AO image. The morphology of this object includes: 1) a fairly blue core surrounded by several blue arc-like structures; 2) a tight knot which is bright in the optical and NIR and lies 0.83 (5.5 kpc) SW of the core; and 3) a very blue, linear structure of length 2.5 (16 kpc) that lies to the NE of the galaxy. VLA 1.4 GHz maps of the region (K. Kellermann 2005, private communication) contain a strong radio source, which may indicate that the linear feature is an optical counterpart to a radio jet. While the radio map shows a slight extension in the direction of the linear feature the resolution () is not high enough to confirm the nature of the feature. Therefor we can not rule out the possibility that the feature is a very linear tidal interaction with a smaller galaxy. Interestingly, the feature is not aligned with the center of the main galaxy, but rather points towards the bright knot SW of the galaxy.
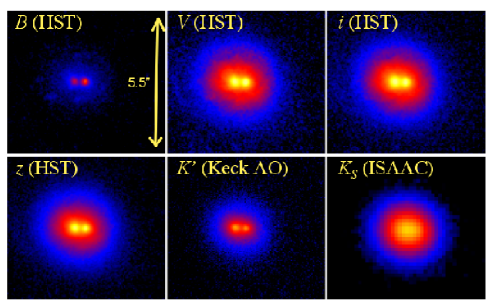
Figure 2 shows the images for galaxy XID-536. The center of this galaxy is composed of two concentrations with visual sizes on the order of 2 kpc. Both are fairly red, indicative of either old or dusty stellar populations. Because the two distinct concentrations are seen to be similar even in the reddest wavebands, they are likely to be cores of two previous galaxies in the later stages of merging, rather than the result of a single core bifurcated by dust. The seeing limited ISAAC image is unable to resolve the two cores which have a separation of 0.3 or 1.7 kpc.
4. Stellar Populations
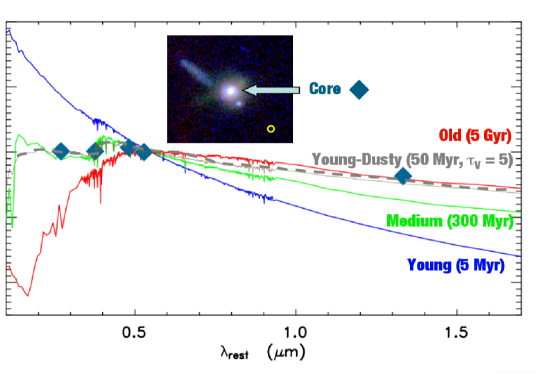
High resolution imaging allows us to measure the spectral energy distributions (SEDs) of kiloparsec-scale components in each galaxy. This paper focuses on the cores of each system. Figure 3 plots the fluxes from circular aperture photometry centered on the nucleus of XID-56 (blue diamonds), with an aperture radius of in each band. Over-plotted are Bruzual and Charlot (2003; hereafter BC03) single-burst, dust-free, model spectra that span a range of plausible ages (5 Myr, blue; 300 Myr, green; 5Gyr, red). We use BC03 models with a Chabrier (2003) initial-mass function, Padova 1994 evolutionary tracks, and solar metallicity. Also plotted is a young (50 Myr) dusty () population created with a Charlot & Fall (2000) dust model, with an ambient dust fraction, , of 0.3. The models are normalized at a rest wavelength of 5500Å, which corresponds to the band at this redshift. The optical fluxes of the core are well matched to either the young dusty model or the intermediate age stellar population. The Keck AO flux in breaks the degeneracy of these two models by matching the core of this galaxy to a very young and dusty model.
To check whether light from the central AGN may be contributing to the SED, we generated an SED for an annulus with an inner radius of 0.2 and an outer radius of 0.8. The SED for this region (not plotted) is indistinguishable within the errors from the the SED of the core.
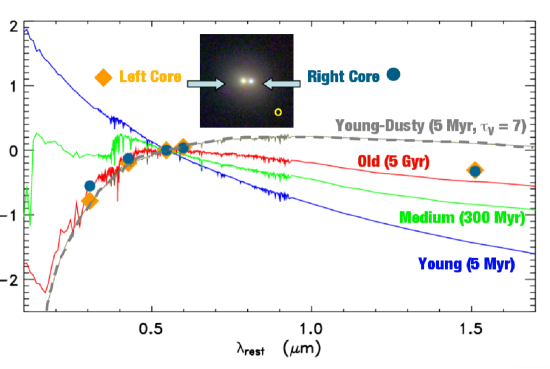
Figure 3 shows the SEDs for the two nuclei (orange triangle and blue circle for E and W cores respectively) of XID-536, also using circular apertures with radii of . The two nuclei (ie. cores) have very similar SEDs, with the W core slightly bluer in the optical. The optical fluxes for both cores are consistent with either the old, dust free, stellar population (5 Gyr) or the young dusty (5 Myr, ) model. The Keck AO data, however, rule out the young dusty model and indicate that both cores are old, well evolved systems. The point lies slightly higher than the old SED model, which may indicate a small amount of dust in this merger ( is consistent with the data). It should also be noted that the SEDs of the two nuclei are inconsistent with the very red nuclear regions of luminous infrared galaxies such as Arp 220. The SED of the core of Arp 220 continues to rise in the NIR (Mazzarella et al. 1992; Shioya, Taniguchi & Trentham 2001) as opposed to leveling off in the case of XID-536.
To ensure that the results above are insensitive to uncertainties in the AO PSF, we performed aperture photometry on the tip-tilt star images. We compared the photometry from a radius aperture with photometry from a aperture to see if we are missing significant light in the wings of the PSF. The magnitude difference between the two apertures for the LGS AO PSF is mags. In comparison, the magnitude difference for the HST PSF’s is mags for all bands. This indicates that, at most, the -band photometry should be shifted 0.1 mags with respect to the HST photometry, an amount that does not alter the results of this paper. A similar test on a point-like object in the science frame also indicates a shift no greater than 0.1 mags.
5. Discussion
Hierarchical clustering models predict that the large spiral and elliptical galaxies of today build up from a series of mergers of smaller components (Baugh et al. 1998; Mao, Mo & White 1998; Somerville, Primack & Faber 2001). During a typical merger event, gas and dust are funneled into the center of the galaxy and form new stars (Mihos & Hernquist 1996; Cox et al. 2004). This scenario appears to explain the morphology of XID-56, which has a blue core and various blue structures indicating recent and ongoing star formation.
One outstanding problem for hierarchical clustering models is matching the observed bi-modal color distribution of galaxies on the color-magnitude diagram (Blanton et al. 2003) and specifically creating the brightest red galaxies (Bell et al. 2004; Springel, Di Matteo & Hernquist 2005). In current semi-analytic model prescriptions (Somerville et al. 2005, in prep) the star formation is either quenched before galaxies are big enough to become the brightest red galaxies of today, or residual gas inside the systems eventually becomes cool enough to form new stars, making them blue. In order to make the largest red galaxies, it may be necessary to meet two conditions: 1) have some feedback mechanism such as an AGN which quenches further star formation in massive halos (Springel, Di Matteo & Hernquist, 2005; Di Matteo, Springel & Hernquist, 2005); and 2) have the merger be of two relatively gas free systems (Bell et al. 2004). While XID-536 shows signs of recent merger activity, its SED does not show signs of vigorous star formation. Its luminosity () and color are consistent with galaxies lying on the brighter end of the red sequence of the color magnitude diagram. We surmise that this is an example of two evolved stellar systems, where AGN activity has expelled or heated gas that might otherwise have been able to form new stars.
Keck LGS AO photometry in the NIR is now possible on the same sub-arcsec scales as the HST optical. The addition of NIR fluxes is found to be critical to distinguish among stellar population models that otherwise match the optical SED. In this paper, we identify two merging systems, one of which is unusual in that it appears to be between two evolved stellar populations. Large statistically complete samples are needed to determine the merger rate of evolved stellar systems.
References
- Baugh, Cole, Frenk, & Lacey (1998) Baugh, C. M., Cole, S., Frenk, C. S., & Lacey, C. G. 1998, ApJ, 498, 504
- Bell et al. (2004) Bell, E. F., et al. 2004, ApJ, 608, 752
- Blanton et al. (2003) Blanton, M. R., et al. 2003, ApJ, 594, 186
- Bouchez et al. (2004) Bouchez, A. H., et al. 2004, Proc. SPIE, 5490, 321
- Bruzual & Charlot (2003) Bruzual, G., & Charlot, S. 2003, MNRAS, 344, 1000
- Chabrier (2003) Chabrier, G. 2003, PASP, 115, 763
- Charlot & Fall (2000) Charlot, S., & Fall, S. M. 2000, ApJ, 539, 718
- Cox et al. (2004) Cox, T. J., Primack, J., Jonsson, P., & Somerville, R. S. 2004, ApJ, 607, L87
- Di Matteo et al. (2005) Di Matteo, T., Springel, V., & Hernquist, L. 2005, Nature, 433, 604
- Fukugita et al. (1995) Fukugita, M., Shimasaku, K., & Ichikawa, T. 1995, PASP, 107, 945
- Gebhardt et al. (2003) Gebhardt, K., et al. 2003, ApJ, 597, 239
- Giacconi et al. (2002) Giacconi, R., et al. 2002, ApJS, 139, 369
- Giavalisco et al. (2004) Giavalisco, M., et al. 2004, ApJ, 600, L93
- Glassman et al. (2002) Glassman, T. M., Larkin, J. E., & Lafrenière, D. 2002, ApJ, 581, 865
- Kinney et al. (1996) Kinney, A. L., Calzetti, D., Bohlin, R. C., McQuade, K., Storchi-Bergmann, T., & Schmitt, H. R. 1996, ApJ, 467, 38
- Mazzarella et al. (1992) Mazzarella, J. M., Soifer, B. T., Graham, J. R., Hafer, C. I., Neugebauer, G., & Matthews, K. 1992, AJ, 103, 413
- Mihos & Hernquist (1996) Mihos, J. C., & Hernquist, L. 1996, ApJ, 464, 641
- Mo, Mao, & White (1998) Mo, H. J., Mao, S., & White, S. D. M. 1998, MNRAS, 295, 319
- Rosati et al. (2002) Rosati, P., et al. 2002, ApJ, 566, 667
- Shioya et al. (2001) Shioya, Y., Taniguchi, Y., & Trentham, N. 2001, MNRAS, 321, 11
- Somerville, Primack, & Faber (2001) Somerville, R. S., Primack, J. R., & Faber, S. M. 2001, MNRAS, 320, 504
- Springel et al. (2005) Springel, V., Di Matteo, T., & Hernquist, L. 2005, ApJ, 620, L79
- Steinbring et al. (2004) Steinbring, E., et al. 2004, ApJS, 155, 15
- Szokoly et al. (2004) Szokoly, G. P., et al. 2004, ApJS, 155, 271
- Wizinowich et al. (2004) Wizinowich, P. L., et al. 2004, Proc. SPIE, 5490, 1
- Wolf et al. (2004) Wolf, C., et al. 2004, A&A, 421, 913