Diffusion coefficient and acceleration spectrum from direct measurements of charged cosmic ray nuclei
Abstract
We discuss the potentials of several experimental configurations dedicated to direct measurements of charged cosmic ray (CR) nuclei at energies 100 GeV/n. Within a two-zone propagation model for stable CRs, we calculate light primary and secondary nuclei fluxes for different diffusion and acceleration schemes. We show that the new detectors exploiting the long and ultra long duration balloon flights could determine the diffusion coefficient power index through the measurement of the boron-to-carbon ratio with an uncertainty of about 10-15 %, if systematic errors are low enough. Only space-based or satellite detectors will be able to determine with very high accuracy even in the case of important systematic errors, thanks to the higher energy reach and the less severe limitations in the exposure. We show that no uncertainties other than those on affect the determination of the acceleration slope , so that measures of light primary nuclei, such as the carbon one, performed with the same experiments, will provide valuable information on the acceleration mechanisms.
keywords:
Cosmic rays , Propagation models , Direct measurementsPACS:
95.30.-k , 96.40.-z , 96.40.De , 98.70.Sa1 Introduction
Charged particles arriving at Earth with energies between about eV and
eV are believed to have galactic origin. Their acceleration is very likely due to the
action of supernova remnants, while their subsequent diffusion in the Galaxy is driven by the
turbulent, irregular component of the galactic magnetic field.
The most abundant galactic cosmic ray particles have energies in the 100 MeV/n - 10
GeV/n range, where several additional phenomena such as electromagnetic energy losses, convection,
diffusive reacceleration and solar modulation are believed to contribute in shaping their spectra.
The most realistic description of CR propagation is given by diffusion models, in which the several
free parameters inherent to a specific model need to be fixed by observations.
The low-energy tail of the CRs spectrum is shaped by several competing effects, so that it is very
difficult to disentangle each physical component. On the other hand, most
data have been collected for energies 50 GeV/n and their interpretation has not yet led to a
clear understanding of any of the above-mentioned physical ingredients.
The high energy part of the spectrum - let’s say GeV/n -
is basically due to
acceleration and diffusion, all the other effects being minor if not negligible.
The best-founded assumptions on the diffusion coefficient and the injection spectrum are
power-laws, and this is what is grossly observed for the flux of nuclei.
A wealth of experimental measurements are available, with different degrees of
accuracy in the region up to 100 GeV/n; on the contrary,
the higher energy region is poorly known. The most recent direct measurements in this region
have been provided by the series of balloon flights of JACEE [1] and RUNJOB
[2], while most of the data results from indirect measurements, by means of
ground arrays observing air showers.
New data have recently been added by the ATIC Collaboration [3],
connecting the lowest energy region to the highest energy available data. The new
CREAM project [4] has been developed and is now in data taking
phase, with the aim of dramatically increasing the available
statistics in the energy region up to 500 TeV and possibly more,
thus making new and precise measurements of the spectral characteristics of CRs.
In the present paper, we explore the performances required for new detectors
to disentangle the fundamental parameters describing the propagation of nuclei
at energies above about 100 GeV/n and below the knee region.
In Sect. 2 we report on the status of experimental projects aimed at the
measurement of CR nuclei at energies 1 GeV/n. In Sect. 3
we describe a diffusion model for galactic CRs, and highlight
the main features affecting the propagation of particles in the higher energetic range.
Sect. 4 summarizes the method employed for the simulation of the experimental conditions.
In Sect. 5 we present our results focusing on the possibilities to measure
the diffusion coefficient slope by means of the boron-to-carbon (B/C) data and the acceleration
spectrum by means of primary light nuclei fluxes such as the carbon one. In Sect.
6 we draw our conclusions.
2 Experimental status and projects
| Experiment | Years | Elements | Energy | Exposure | |
| GeV | m2 sr | (m2 sr days) | |||
| Balloon instruments | |||||
| mubee [12] | 1975-87 | 1 Z 26 | 104-3 105 | 0.6 | 22 |
| sanriku [13] | 1987-91 | 8 Z 26 | 2 102-3 104 | 4.81 | 4.45 |
| jacee [1] | 1979-95 | 1 Z 26 | 2 103-8 105 | 2-5 | 65-107 |
| runjob [2] | 1995-99 | 1 Z 26 | 104-3 105 | 1.6 | 43 |
| tracer [14] | 2002-04 | 5 Z 28 | 1.6 102-1.6 104 11footnotemark: 1 | 5 | 70 |
| atic [3] | 2000-03 | 1 Z 28 | 10-105 | 0.25 | 3.5 |
| cream [4] | 2004 | 1 Z 28 | 103-106 | 0.5/1.3 22footnotemark: 2 | 35-14033footnotemark: 3 |
| Space instruments | |||||
| proton 1-4 [10] | 1965-68 | All particles,p,He | 100-106 | 0.05-10 | 5-2000 |
| sokol [16] | 1984-86 | 1 Z 26 | 2 103-105 | 0.026 | 0.4 |
| heao-3 [11] | 1979-80 | 4 Z 28 | 9.6-560 11footnotemark: 1 | 0.14 | 33 |
| crn [17, 18] | 1985 | 4 Z 26 | 7 102-3 104 | 0.1-0.5/0.5-0.922footnotemark: 2 | 0.3-3 |
| Projects | |||||
| nucleon-klem [19] | 1 Z 26 | 102-107 | 0.19 | 190 | |
| ams-02 [26] | 1 Z 26 | 1-104 | 0.5 | 500 | |
| access [23] | 1 Z 28 | 103-5 106 | 1/8 22footnotemark: 2 | 300-8000 | |
| proton 5 [20] | 1 Z 28 | 103-107 | 18 | 18000 | |
| inca-cstrd [21] | 1 Z 28 | 105-107 | 48 | 48000 |
(1) the energy range refers to oxygen;
(2) the two numbers refer to low and high Z respectively;
(3) CREAM had a succesful 40 days flight in December 2004-January 2005, but it is planned
to exploit ULDB flights of 100 days in the near future.
In Table 1, we collected the past and current experiments as well as new projects
directly measuring charged CRs nuclei in the energy range above 1 GeV/n and spanning a wide range in Z.
Direct measurements of charge and energy of CR nuclei started in the
sixties, exploiting the balloon and spacecraft techniques. Scintillators
and Cerenkov detectors were employed for charge measurement, while ionization
calorimeters measured the nucleus energy [5, 6, 7, 8, 9, 10, 11].
Four experiments [1, 2, 12, 13] exploited passive detectors like nuclear
emulsions and X-ray films: due to their sensitivity also to inclined tracks,
they allowed to reach a much bigger exposure compared to active
detectors, thus in principle exploring the highest energy region (about 10 to 1000 TeV).
The most precise measurements on relative abundances of elements with Z from 4 up to 28
came from the HEAO-3 mission, whose data have been extensively used to tune and check models.
AMS-01 (a spectrometer flown on the space shuttle Discovery including a permanent magnet,
a tracker, time-of flight hodoscopes and a Cerenkov counter) brought
further information on proton and helium up to about 100 GeV/n [15].
Among the present experiments, a fully active bismuth germanate (BGO)
calorimeter flew on ATIC [3], while
TRACER [14] employed a transition radiation detector.
The development of the Long Duration technology is now giving the
possibility to balloon experiments to fly for more than 20-30 days, thus
reaching much higher exposures.
CREAM [4] employs for the first time both a calorimeter and a transition
radiation detector, thus allowing an intercalibration of the energy measurement with two
independent techniques with different systematic biases. This apparatus is planned to
exploit the Ultra Long Duration Balloon flights technology, which relies on new superpressure
closed balloons with a pumpkin-shape design and is
now in test phase; it will hopefully fly up to 100 days.
New space instruments have also been proposed: a) the NUCLEON russian satellite program which will
include the KLEM detector (silicon microstrips and scintillator strips) [19]; b) a ionization
calorimeter on a series of Proton-5 satellite missions [20],
with the aim of measuring the spectrum of elements up to
more than 1000 TeV, reaching an accuracy of 2-5% in the slope determination;
c) INCA [21], a ionization neutron calorimeter with 48 m2sr acceptance; its main aim being
the study of the electron spectrum, it is expected to measure also primary nuclei in the knee
region. A proposal for an integration of this calorimeter with a Compton
scatter transition radiation detector has been recently presented [22].
The ACCESS [23] project was not chosen for the last MIDEX phase by NASA, but has been
included in the hope of a reproposition as a free-flyer.
We should also mention the sophisticated spectrometers which were flown on
balloons, with the main aim of measuring antimatter and light isotopes [24].
They are not included in the Table because of their quite
different aim, but they also gave very precise information on the proton
and helium flux up to around 100 GeV/n; the energy range has been extended by the Bess-TeV [25]
upgrade of Bess-98, reaching about 500 GeV and 200 GeV/n for proton and helium nuclei respectively.
The new AMS-02 [26] large acceptance magnetic spectrometer has been conceived
to study origin and structure of the dark matter and to measure antinuclei; it will also
be able to extend the knowledge on the composition of charged CRs from the 100 MeV/n region
up to about 1 TeV/n.
3 Propagation of CRs in the Galaxy
Despite scarce theoretical and observational knowledge of the key parameters responsible for acceleration and propagation of galactic CRs, phenomenological models able to reproduce data can be built. The most realistic propagation models are the diffusion ones, even if the so–called leaky box model has been often preferred in the past for its simplicity [27]. In Refs. [28, 29], a two-zones diffusion model has been developed and shown to reproduce several observed species in the low-energy part of the CR spectrum ( 0.1-100 GeV/n). In this model, the Galaxy has been cylindrically shaped (with =20 kpc), with a thin disc (half-hight =0.1 kpc) containing the sources and the interstellar medium (ISM) surrounded by a diffusive halo of half-thickness 2-15 kpc. The transport equation for the nucleus in a diffusion model is in principle valid in a very wide range of energies and can be written as:
| (1) | |||
Steady-state has been assumed and is the differential density of the nucleus as
a function of energy and galactic coordinates (). In this equation, the first term
represents spatial diffusion with diffusion coefficient , which has been assumed to be
independent of Galactic coordinates. is the convection
velocity, assumed here to be constant throughout the Galaxy (except in the thin disk) and to be
directed outward along the z-direction. The term
proportional to in the left-hand side of Eq. (1) takes into account all the sources of cosmic
rays: primary sources with injection spectrum , secondary spallative production from
heavier nuclei and destructive reactions (radioactive-decay terms have been omitted for
simplicity). The right-hand side of Eq. (1) contains – through the coefficients
and – the terms responsible of the energetic
changes suffered by charged particles during propagation: Coulomb, ionization and adiabatic
expansion losses, and gains due to second order reacceleration. Diffusive, or continuous,
reacceleration is due to the scattering of charged particles on the magnetic turbulence in the
interstellar hydrodynamical plasma. The diffusive reacceleration coefficient is related to the
velocity of such disturbances, called the Alfven velocity , and is naturally connected to
the space diffusion coefficient . For example, diffusive reacceleration contributes
significantly in shaping the boron–to–carbon (B/C) ratio at kinetic energy per nucleon E around
1 GeV/n. Indeed, all energy losses and gains are effective only in the
low-energy tail of the CR spectrum and thus are irrelevant in the analysis carried in
the following of our paper, which deals with E 100 GeV/n.
The so-called sporadic, or distributed, reacceleration has been
considered in the literature [30, 31] and is based on the possibility that
CRs be reaccelerated during their wandering in the Galaxy by supernova remnants (SNRs) and gain a
small amount of energy at each encounter.
Convection may dominate at low energies, depending on the value of and if is large.
It may compete with diffusion up to few tens of GeV/n,
but its role becomes negligible at higher energies. The importance of
spallation processes
depends on the nucleus, but at energies 100 GeV/n they are not much relevant
except for heavy nuclei (e.g. iron) [32]. We also note that
the different assumptions on the distribution of the ISM - homogeneously distributed (as assumed in
our analysis) or spatial dependent - are irrelevant at high energies and for the species
considered in our analysis.
Diffusion depends on the rigidity () of the particle and the diffusion coefficient is
usually assumed to have the form: . is linked to the
level of the hydromagnetic turbulence and to the density spectrum of these irregularities
at different wavelength. The Kolmogorov theory for the turbulence spectrum predicts
=1/3, while the case for a hydromagnetic spectrum with =1/2 has been obtained by
Kraichnan [33]. On the other side, the phenomenological interpretations of CR
spectra have not led to fix because of the
complicated treatment of the physical phenomena which are relevant at the energies in which most
cosmic particles have been collected. Fits to the B/C ratio within the diffusion model of Eq. (1)
prefer high values for ( 0.5-0.75), while the Kolmogorov spectrum turns out to be
disfavored [28, 29, 34]. The =1/3 case can
reproduce quite well the peculiar B/C peak observed at 1 GeV/n but it tends to
overestimate the data at increasing energies, predicting a quite flat B/C ratio (see
also later). The highest values of seem on the other side not very realistic.
In fact they are only marginally consistent with observations of interstellar scintillation
[35, 36] and are highly incompatible with the level of anisotropy
measured at 1-100 TeV [37].
Data on CR fluxes do not extend to sufficiently high energies
and are not sufficiently precise in order to constrain .
The acceleration spectrum of primary CRs is believed to be determined by supernovae (SN) remnants and
super-bubbles [38], which are the only known engines in the Galaxy able to provide the right
amount of energy to particles up to eV. The acceleration spectrum follows a
power-law in momentum, , with located somehow between 2.0 and 2.5.
Even if a precise value for cannot be predicted, the effective spectral index as derived by
several indirect observational tests and by numerical studies is close to 2.0-2.1
[38] (and refs. therein), [39]. Very recently, the TeV -ray image of a SN
remnant - already observed in the X-ray spectrum with a very similar morphology - strongly indicates
that high energy nuclei are accelerated in this site [40]. The -ray data are well
reproduced by a photon spectral index which seems to prefer low values, even if the
experimental sensitivity is not yet sufficient to put strong constraints. Higher values of 2.4 are favored by propagation models for GCRs with very low , such as the Kolmogorov
spectrum.
The above-described diffusion model has been tested on the B/C and sub-Fe/Fe ratios and shown to fit well
existing data, which we remind lie in the low-energy tail of the galactic CR spectrum
[28, 29].
The propagation parameters able to reproduce such ratios give also rise to a secondary antiproton flux which is
in very good agreement with measurements [41]. A further, yet weaker, degree of consistency is given
by an analysis of radioactive isotopes [42].
In this case, the diffusion model has been modified
in order to take into account a local under-dense region, relevant when dealing with short-living species.
The model has also been validated at higher energies through a study of the mean logarithmic mass of the CR
[32] beam.
For further details on this propagation model and considerations on
other possible approaches we refer to Ref. [43] and references therein.
4 Detector design and simulation
To pursue the objective of extracting information about crucial propagation
parameters in the high energy region, an experimental apparatus should have the
following characteristics:
(i) A large exposure, to have enough statistics: to detect about 10 nuclei
at energies above 10 TeV/n, if taking the elemental fluxes from [44],
a collecting power 53 m2sr days is to be reached for carbon nuclei,
while more than 250 m2sr days are necessary for Iron.
(ii) A good energy resolution: this is especially crucial to detect changes of slope
in the energy spectra (e.g. the knee in the proton spectrum) or to study spectral
smoothness. A constant 40% energy resolution is enough to see an increase in the
spectral slope of about 0.3 crossing the knee. The same resolution or better is required
to find small deviations from smoothness, of the order of 10% [20].
(iii) A charge resolution such as to distinguish e.g. carbon from boron nuclei;
models ask for a B/C ratio of some percent around 1 TeV/n, so that a
resolution of about 0.2 charge units is needed.
Combining different detectors in the same experiment gives a powerful tool to overcome
individual technical limitations: for example, redundant measurements of energy allow
a cross-calibration of the detectors, thus overcoming the problem of direct energy calibration
which at the highest energies explored is possible for TRDs but not for calorimeters.
A very careful study of systematic errors is mandatory, as these are the main cause of uncertainty
in all the measurements. Exposures and efficiencies in selecting and
tracking the events can be studied by means of Monte Carlo simulations; for both energy and
charge determination, redundancy can help in reducing the ambiguities.
Although a serious discussion of systematics depends on each specific detector, a constant
contribution to the overall error on the flux measurements will be introduced
in our analysis.
In order to explore the performances of new detectors, a simulation has been built
with the following ingredients:
(a) the input flux; the particle spectrum is numerically given by the propagation model.
Different power laws with increasing slope in contiguous energy ranges are fitted to the
spectrum to better follow the expected behavior.
The flux is normalized to the best experimental low energy datum (e.g. the flux as derived by
[11] at 10.6 GeV/n).
(b) the experimental apparatus, in terms of collecting power and energy
resolution. We use = 1.3, 5 and 10 m2sr, similar to the quoted geometrical
factors of some of the current and future experiments and a set of exposure
times of 30, 100 and 1000 days, which roughly correspond to long and ultra
long duration balloon flights and satellite conditions, respectively.
The expected number of events above a given energy E for an assumed
collecting power and input spectrum m-2s-1sr
can be written as:
| (2) |
where depends on the slope and normalization of the input flux.
Following the approach of [45], the cumulative distribution function for E in the considered energy range
can be written as
| (3) |
and the probability distribution function for the events is obtained by differentiation
| (4) |
The number of events N of Eq.2 is the mean value of the Poisson distribution of the true number of events in a given range ; the poissonian fluctuation is computed in small energy bins (equal bins in logarithmic scale so that, for any interval j, =constant) covering the full interval, in order to correctly weight also the bins with few events. The energy of each i-th event is then randomly sampled in the energy interval from the power law spectrum; being a standard uniform variate
| (5) |
and
| (6) |
In each interval [Ej-Ej+1], the mean energy is
| (7) |
The detector response is modeled as a Gaussian distribution with mean equal to the input energy and width given by the energy resolution. In the following, a constant 40% energy resolution will be assumed; the case for resolutions either decreasing or increasing with energy will however be checked. The detection efficiency is here assumed not to depend on energy and will be included in the systematic uncertainties.
5 Results and discussion
The aim of this section is to study the potentials of different experimental configurations in connection with the determination of the diffusion coefficient slope and the acceleration power spectrum . We show how well their physical value could be singled out with high-energy data on the B/C ratio and the carbon flux.
5.1 B/C and the diffusion coefficient slope
The boron-to-carbon ratio has always been considered the best quantity
to study diffusion properties. At energies around GeV/n, this ratio is strongly
affected by the low-energy phenomena described in Sect. 3. In particular,
the observed bump at 1 GeV/n can be naturally explained by diffusive reacceleration,
without invoking any artificial break in the diffusion coefficient.
The most precise B/C data
have been obtained in the energy range 0.6-35 GeV/n by the HEAO-3 experiment [11],
the highest energy points having been collected by CRN [17].
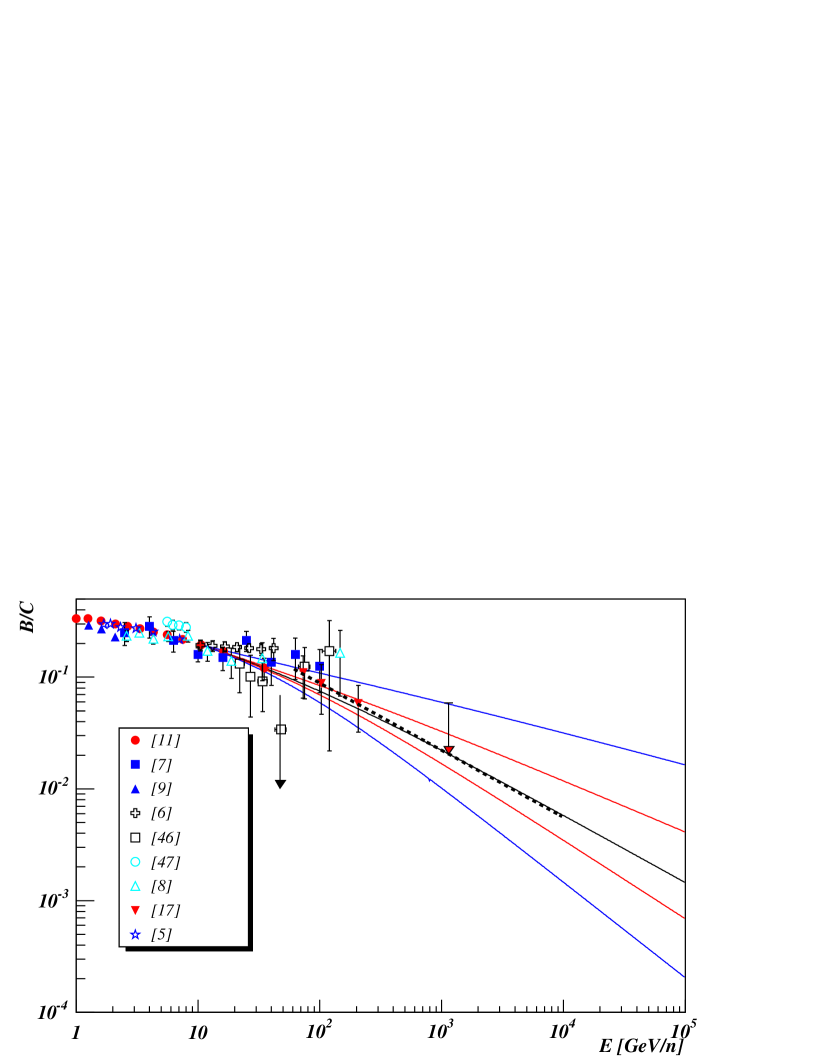
In Fig. 1 we plot a collection
of data on the B/C ratio giving emphasis to the higher energy part of the spectrum.
Along with the experimental data, we also plot the theoretical predictions calculated with
the full diffusion model briefly outlined in Sect. 3.
We have chosen five illustrative configurations of the propagation parameter space,
which will be also employed in the following of our analysis as bench marks.
At the energies we deal with, the parameter which mostly shapes the B/C ratio is the
diffusion coefficient slope, namely . The constant in the diffusion coefficient enters with
the source abundances in the global normalisation of B/C, so that
its precise value is of scarce relevance in the B/C predictions.
We thus identify cases 1-2-3-4-5 with
, respectively.
All the other propagation parameters ()
have been fixed according to the best fits to B/C data [29]. Indeed
their exact value is not very important when
working with a secondary-to-primary flux ratio at energies 100 GeV/n.
The dashed line in Fig.1 corresponds to the power law
, where the coefficient 1.4 has been fixed to the theoretical
prediction for the =0.6 case at 1000 GeV/n. This line shows that
for energies 1000 GeV/n the B/C ratio can be well approximated by a
power law in energy with index , as one expects from the high energy
limit: secondary/primary .
At E=100 GeV/n the difference between the simple power law and the calculated flux
is 20%. Below this energy, it is clear that the effects of energy changing,
convection, halo size and spallations become more and more important in
shaping the B/C ratio, as studied in Refs. [28, 29].
This figure wants to emphasize the discrepancy among the models
- basically due to the values -
with increasing energy. At energies 100 TeV/n the predictions for
B/C ratio in the =0.3 and =0.85 case - both not excluded by low energy
data, even if =0.85 is a quite extreme value -
differ by two orders of magnitude.
Different predictions for lead to B/C whose relative values
increase with increasing energy. This high energy region is thus very
interesting from an experimental point of view, since it could bring - at
least in principle - to a clear determination of the actual diffusive regime.
Finally, we want to underline that the injection spectrum has no relevance in the calculation
of this ratio. We have checked that for E 10 GeV/n the results for the B/C ratio
are practically unchanged if we vary (equal for each nucleus)
in the very large range 1.8-2.5, as well as if we fix for each nucleus
(, indeed) as derived in Ref. [44].
Following the procedure outlined in Sect. 4, the expected number of carbon and boron
events can be derived by selecting a given set of experimental conditions (exposure, time
and resolution) and an input flux.
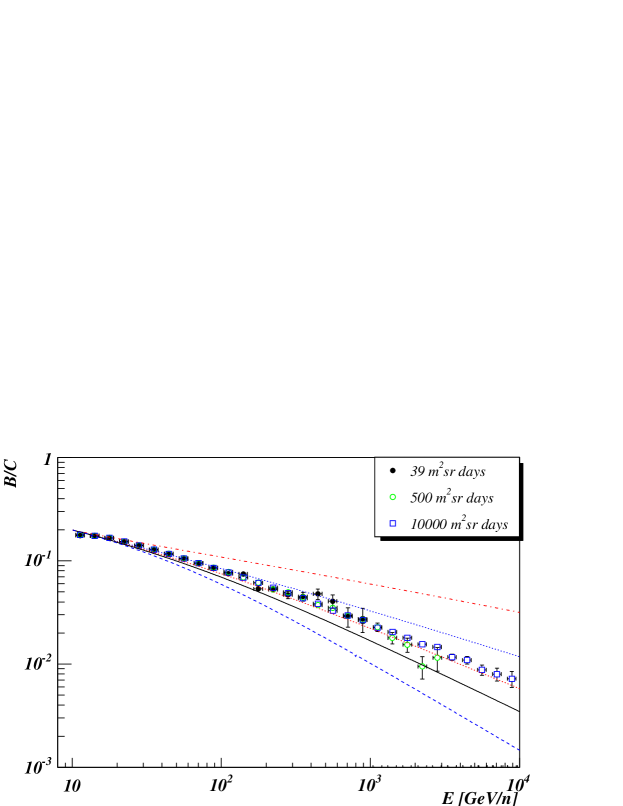
Fig.2 shows the B/C ratio as obtained from case 1
(upper panel, corresponding to =0.3) and from case 3 (bottom panel, =0.6),
for three different collecting powers.
The maximum energy at which the B/C ratio can be measured
with a significant number of events - we are requiring at least 10 events for Boron nuclei - goes
from about 900 GeV/n to more than 10 TeV/n when the exposure increases from about 40 m2sr
days up to 10000 m2sr days. The various correction factors which must be
considered in the analysis of real data (e.g. due to selection
efficiency or interaction losses in the apparatus) would have the effect of lowering the maximum detectable energy.
As an example, a global efficiency of 30% would shift it by a factor 1.5 for the
smallest exposure considered here and case 3 as input.
The same effect is produced for balloon experiments due to spallation processes in the
residual atmospheric grammage of 4-5 g/cm2.
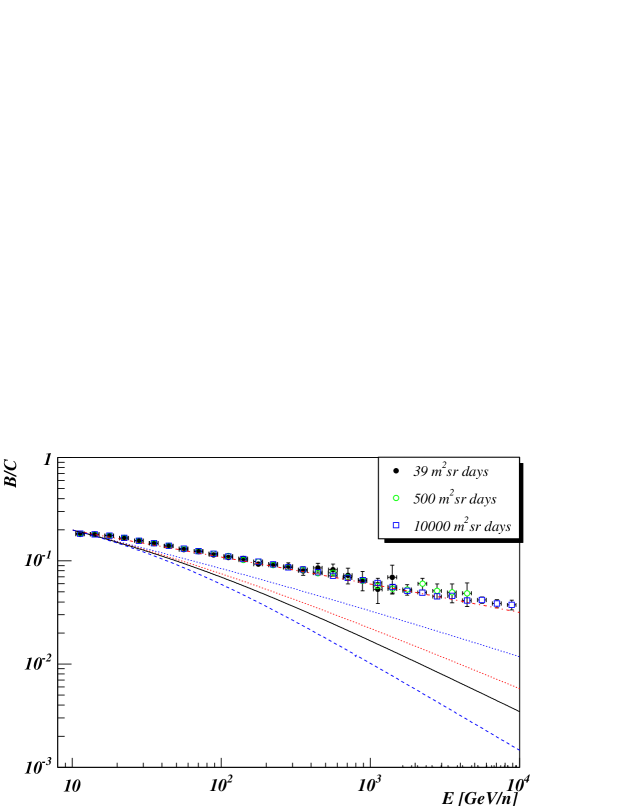
¿From this figure it is evident that the two theoretical models could be easily distinguished already by
experiments with acceptance of about 1 m2 sr and flying time of forty days (in our example: 1.3
m2 sr and 30 days data taking). Note however that the figure has been
obtained without considering the systematic uncertainties.
The inclusion of a finite energy resolution of the detector in the simulation has important consequences
on the ability to measure the B/C ratio and to distinguish among different models: it produces in fact
a distortion which reflects the change in the carbon and (more) in the boron spectra due to the energy
fluctuation. The steepness of the spectra makes it more likely to move low energy events to high energy
bins, so that the effect is bigger for weaker spectra. In the case of model 1, for example, the measured
B/C will be some percent higher than what expected for an ideal detector, that is a “zero resolution”
one, almost constantly from 100 GeV/n on; on the contrary, using the input spectrum of model 5 the B/C
ratio appears to be from 12 to 18% higher when going from 100 to 1000 GeV/n. A correction for this
effect has to be applied before the comparison with expectations; the binning of the data should be
carefully chosen in order to be bigger than the uncertainty due to energy resolution.
Using two different input models j and k, we simulated the expected number of carbon and boron
events. The
difference between the B/C ratios so derived can be quantified by performing a relative test
| (8) |
where we put at denominator the variance
of the difference. In order to fully exploit the high energy region which can be explored by the current and
future apparata, where only acceleration and diffusion dominate the cosmic
rays spectrum, the summation starts from 100 GeV/n.
The ratio between the carbon and boron fluxes is only mildly sensitive
to systematic errors (most of which are supposed to be independent from the considered
nucleus), which are however to be included in the total error. Since a full discussion on systematics
can only be done for each specific apparatus, we consider here only a constant systematic error to be
added in quadrature to the statistical one.
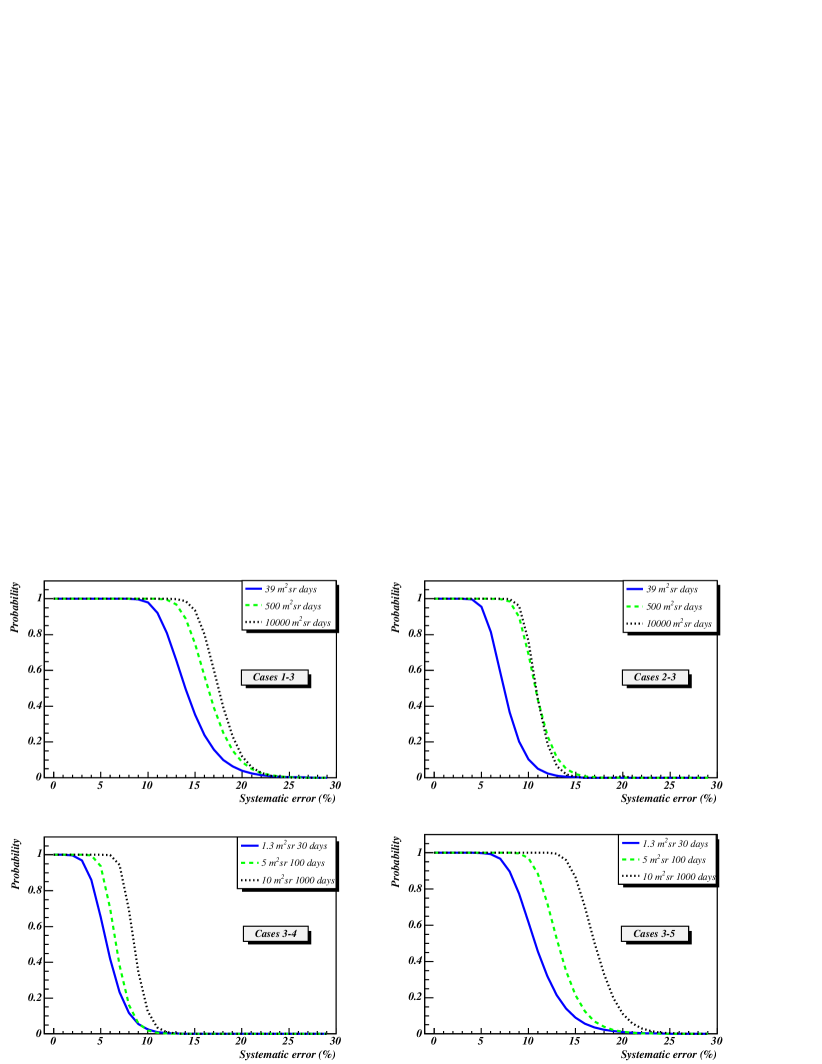
Fig.3 shows the result for the data sets respectively expected from model 3 and each of the other
ones as a function of the systematic uncertainty, for three different experimental collecting powers.
We should remind that even at the lowest energy of 100 GeV/n the
percentage difference between models is big, going from about 7% for models 3 and 4 up to 30% for
models 1 and 2. Exposures are such that even for the smallest experimental configuration considered here
the statistical errors are quite small and in the ideal case of no systematic effects all models
could be separated.
As obvious, the sensitivity increases with differences between the two compared values, in
our case the ones labeled (1-3) and (3-5) for which =0.30 and 0.25 respectively. For
example, a =0.3 case can be distinguished from a =0.6 case with 90% C.L. if the
systematic error stays below 12% even in the less favourable experimental conditions considered.
In the case of a satellite-like exposure, these two models could be distinguished even in presence
of a 15% systematic error. On the other hand, the range of sensitivity raises up to more than 20
TeV/n for satellite-based experiments, thus allowing to tag bench marks with =0.10-0.15
(e.g. case 2 from 3 or case 3 from 4), but only if systematic uncertainties are kept
below 10%.
The analysis shown in Fig.3 is meant to illustrate the ability of a
given experimental setup to discriminate between two fixed and arbitrarily
chosen values. In order to evaluate the accuracy in the determination of
, we now perform a minimization procedure on the simulated
B/C data, leaving , , and as free parameters.
As expected, the resulting has no structure with respect to , and , whose effect
is in practice reabsorbed in a global normalization of the spectra. On the contrary, the calculated
s are such that a minimum for can always be clearly
identified.
If systematics can be considered negligible, the determination of the
diffusion coefficient slope can be obtained at 10-15% significance from B/C
data collected with the 39 m2 sr days simulated experiment, and at 8%-10% for the 500 m2 sr
days case.
However, we find that can be determined with significance level of 15% or
10% respectively for the 500 m2 sr days or 10000 m2 sr days
simulated experiment, if the systematic errors are of order 10%. Very low
accuracy is predicted in this case from the lowest exposure experiment (39
m2 sr days).
As expected, the obtained accuracies are consistent with the probability curves shown
in Fig.3; e.g., the case 3-4 presented in this figure (bottom left) considers
two differing by 15-20% and shows that they are perfectly
separated only if the systematic uncertainties lay below 2-3% for the smallest
collecting power. This agrees with our previous conclusion, namely that the
accuracy on is at the level of 10% for a collecting power of
39 m2 sr day and negligible systematics.
We emphasize once again that the above results are derived including systematic
uncertainties which are assumed to be independent on energy: while this is true for trigger efficiency
or event reconstruction, or even for Monte Carlo corrections, other systematic errors like those due to
energy resolution will depend on energy and could alter the considered fluxes.
A spectral deformation of the B/C ratio at high energies has been proposed in
Ref. [31] as due to distributed reacceleration (see above). CR
particles can have sporadic encounters with SNRs, during which they could gain small
amount of energies. The modification of the primary spectrum comes out to be
independent of energy, while the effect for secondaries increases with energy
just as the diffusion coefficient in the Galaxy. Thus, the ratio of reaccelerated
B/Cre to standard B/C would be roughly described by
(B/C)re/ (B/C) ,
where is the
momentum corresponding to the maximum of the observed particle spectrum (in
Ref. [31] it is assumed =0.6 GeV/n). The real
situation is rather more complicated than this description, which nevertheless
gives us the correct trend and the possible magnitude of the effect.
The expected deformation of the B/C ratio would be greater
for greater . Moreover, as figured out in Ref. [31],
its intensity would strongly depend on the value of the
circumstellar hydrogen density, . The higher , the lower the
distortion. In the case of =0.6,
an effect of one order of magnitude would be expected at 1 TeV/n for
=0.003 cm-3, a very low number, indeed.
For higher and more plausible values of the
hydrogen density, the B/C ratio could be enhanced by a factor of two.
If the diffusion is Kolmogorov-like, only very small could give an observable
effect (about a factor two). But in this case it would be less ambiguous to
correctly interpret data, while in case of higher this sporadic reacceleration
effect could be mimicked by smaller effects.
Non-stationary models have also been studied, taking into account the fact that SN
might be considered discrete sources in the Galaxy, so that a time-dependent diffusion equation
should be solved [49]. However, it seems plausible that the B/C ration would not be modified
in shape, but only in a overall normalization factor [50].
5.2 Primary fluxes and acceleration spectra
Primary fluxes trace back to the diffusion and acceleration properties, since they are produced directly in the acceleration sites. Charged CR nuclei heavier than protons suffer catastrophic losses due to nuclear destruction on the interstellar H and He. These reactions become irrelevant on the CR spectrum at energies of about 1 TeV/n, depending on the nuclear species. The effect of inelastic interactions lowers and flattens the flux, giving rise to a final shape that is harder than a pure power-law , being .

This effect has been studied by computing the carbon flux according to the full diffusion model
(case 2 and , but in this context their value is not relevant)
with and without inelastic destructions; the result is plotted in Fig.4
(for iron flux, see Fig. 1 in [32]).
The difference between the two cases is about 30% at 100 GeV/n, and at 1 TeV/n it is still 5%.
Thus, it is in principle not correct to expect a pure power law spectrum from energies
above few tens of GeV/n, as often claimed in literature. Of course, the error bars on the existing
experimental data for primaries (except for protons, maybe) still justify this approximation.
¿From the experimental point of view, data about fluxes of primary nuclei were collected in the past
for Z26 up to few TeV/n, but with decreasing statistical significance as the energy
grows higher.
At the highest energies, the only available data sets come from emulsion chamber
experiments [1, 2, 16] which measure groups of elements; systematics are quite
large, e.g. the results for the CNO group differ between JACEE and RUNJOB by a factor
of 2 in normalization. More recently, the first data from a one day test flight of TRACER have been
published for Z8 nuclei [48].
We have calculated the carbon flux for a propagation model in agreement with
the B/C analysis presented above, with the only aim to qualitatively reproduce
the data at the energies in discussion. So we do not care much about the level of
agreement with lower energy data, aware that a thorough study of the propagation
of primaries at low energies would require many deeper insights, which are
beyond the scope of the present paper.
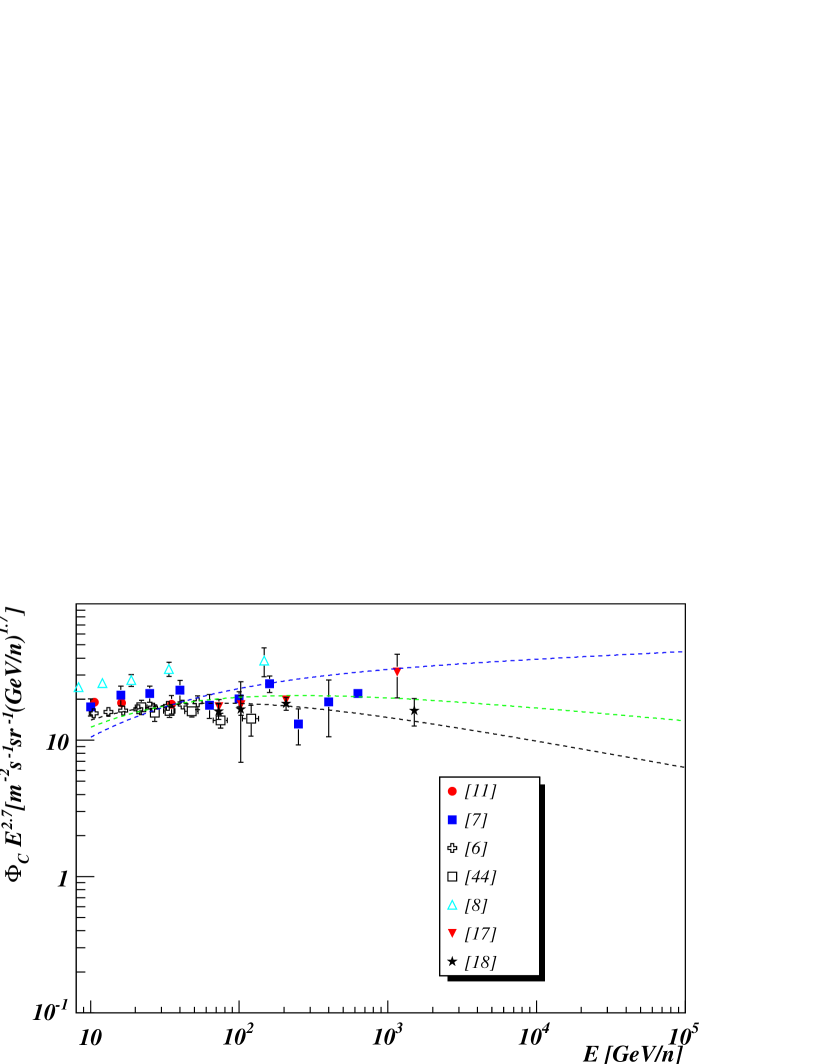
Figure 5 shows a compilation of the data on carbon flux together with the
calculated flux for model 3 (=0.6) and =1.9, 2.05 and 2.2.
The normalization has an important role
in this calculations and may be ascribed to the value of the source abundances, which are
very poorly known, and of . We refer our normalization to the fluxes measured at 35 GeV/n [11],
where the total error (statistical and systematic) is about 15%.
The expected number of events from the above described model and for different values of have been calculated following the procedure described in Sect.4 for different experimental exposures; the corresponding flux is shown in Fig. 6.
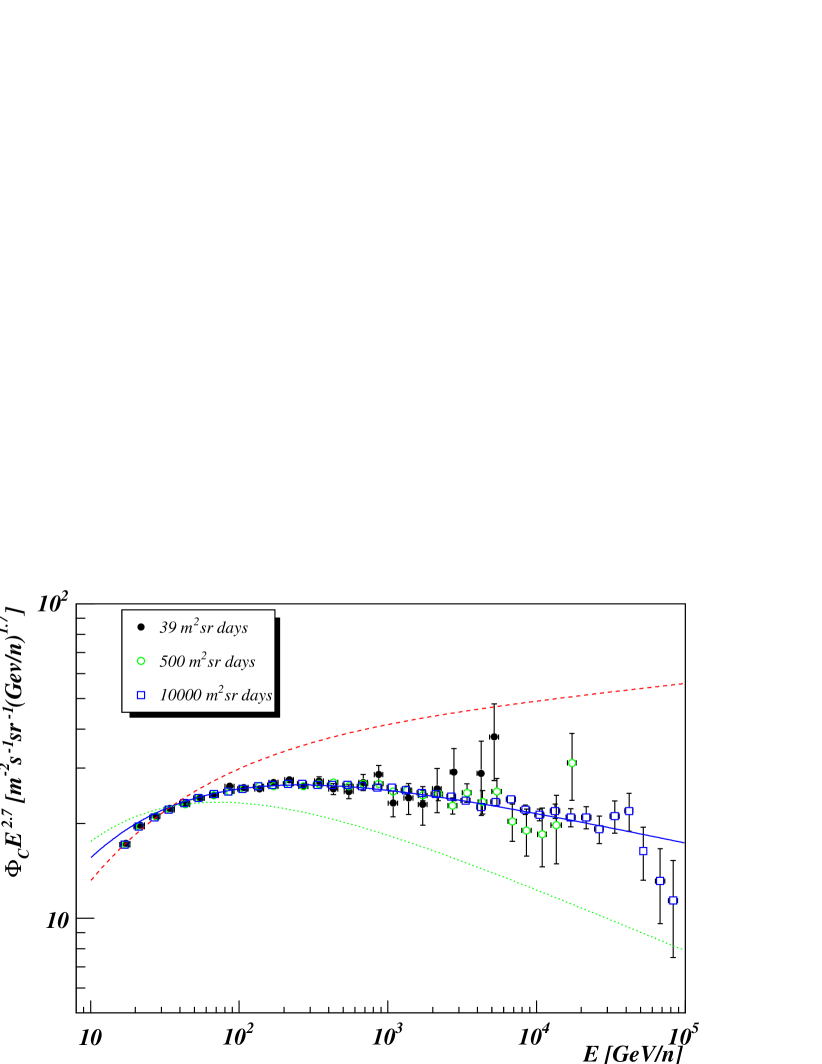
We have also checked that this flux is almost independent of the assumed energy
resolution by changing it from a constant value to an either decreasing or increasing behavior
as a function of the particle energy (from 40% at 100 GeV/n to either 50% or 30% at 1000 GeV/n).
Indeed, it can be shown that the energy resolution plays a minor role as compared to the event statistics
(to collecting power) in the estimation of spectral slopes for simple power laws [45].
The statistical error on the expected events is less than 2% up to about 500 GeV/n, rising to
10% at 2 TeV/n for the smallest exposure, with 500 m2sr days it lowers to few percent at
1-2 TeV/n: the new detectors will so have full ability to cover the high energy range with
sufficient statistical precision.
With a minimization procedure, the expected data are fitted to a power law and
the slope is determined with an error lower than 1% in a range E=0.1-10 TeV/n.
The effect of adding a constant systematic error of 10% is of more than doubling the error on .
This result implies that the experimental errors on the carbon flux (the same conclusion is reached for
oxygen) will not add any uncertainty in the determination of the
acceleration power law index other than the one carried by the diffusion
slope . If the latter is determined within 10% from B/C
measurements, the same experiment will let us fix the former within an equal
uncertainty level by means of primary fluxes determination.
The knowledge of will lead to a better understanding of the acceleration processes inside
galactic supernova remnants. In particular, we note that even in a LDB mission
it could be possible to reach 1 TeV/n with quite good statistical accuracy, thus allowing to
confirm or exclude whether lies towards low-values 1.9-2.1, or in the higher range 2.3-2.4
at a 3 level.
6 Conclusions
A two-zone diffusion model for stable, galactic CRs has been extensively used to generate
different predictions on the primary and secondary nuclei fluxes, which in turn are used to
evaluate the expected events in various experimental configurations similar to present or next
generation apparata. They will substantially exploit a high collecting power in the high energy
region ( 100 GeV/n), where the low energy effects and most of the peculiarities of the model
can be neglected. We have shown that new
detectors exploiting the long and ultra long duration balloon flights, or even more future space
missions, will provide valuable information about both the diffusion coefficient slope and the
acceleration spectrum of galactic CRs.
An experimental determination of through the
measurement of the B/C ratio is at reach of the new generation of detectors, some of which
are already taking data. An experiment like CREAM - which during its first flight collected data for
more than 40 days breaking all the previous flight and duration
records444http://cosmicray.umd.edu/cream/cream.html - is in principle able to distinguish
between a Kolmogorov-like or a different turbulent regime, determining with an uncertainty
of about 10-15%, if systematic errors are low enough. If the latter were
important and at a level of about 10%, the uncertainties on the derived would be huge.
Experiments reaching collecting powers of hundreds m2 sr days have the potential of fixing
at about 85% confidence level even in the case of important systematic errors, or at 90%
if the latter are of the order of the statistical ones.
Only space-based or satellite detectors will be able to determine with very high
accuracy. In fact, even if they would be affected by not negligible systematic errors, the covered
energy range would be significantly wider (we discussed the case with maximal energy of order 30
TeV/n).
A careful measurement of the single fluxes will shed new light on the
acceleration spectrum: in the high energy region the new generation apparata will be able to
measure the spectrum slope for light nuclei with a negligible error.
No further uncertainty other than the
one affecting as derived from the B/C ratio will then be added to the
determination of the acceleration slope . This last parameter is thus expected to be
measured with an uncertainty of 10-15% in the near future, allowing to exclude large ranges of
values and leading to a much clearer understanding of the acceleration processes.
The spectra of the single elements of the CR beam will be measured with very good
statistics up to more than some 1014 eV (which is the correct unit to be used when
comparing with indirect measurements, for which only the energy/particle is determined).
With a careful analysis of the
experimental systematics, absolute particle fluxes will be provided, thus giving more than a
decade calibration region to the Extensive Air Shower detectors.
Direct measurements based on adequate statistics in the region of overlap with the Extensive Air
Shower explored region are of main importance in order to give ground based experiments a firm
reference point, thus helping in deriving the mean composition of the CR beam towards
and at the knee and in checking the models which are used to derive the energy. Around
1014 eV, the flux uncertainty can be set at present around 30%; with the new
experiments now under way or in project, we can expect to significantly reduce it.
The same is true for what regards the mean mass: results from indirect measurements are far
from clear [51], while data from direct detection still show about 30% uncertainty
above 1014 eV, which can surely be lowered at least to 15-20% with the new apparata.
At high energy, above 100 GeV/n,
the primary nucleons contribute mainly to neutrino-induced upward through-going or stopping
muons [52]; most important are protons and helium nuclei, while heavier ones contribute
less than 10% at all energies. Apparata with the considered exposures will be able
to measure also proton and helium spectra with unprecedented accuracy, thus allowing to reduce
the present uncertainty in the all nucleon spectrum, which including all the available data is
still around 30% in the TeV range.
We want to emphasize that a better understanding of the propagation properties is of great significance
for the study of signatures of new physics in CRs. Indirect signals of dark matter pairs annihilating in
the halo of our Galaxy could be found in antiproton, antideuteron or positron CRs. This research is
limited by the uncertainties in the propagation parameters, that dramatically affect the fluxes of
charged particles located in the whole diffusive halo [53]. For instance, if this
uncertainty were significantly reduced, it would be possible to exclude supersymmetric models
predicting antiproton fluxes exceeding the present measurements [54]. A better
signal–background discrimination would come from antideuteron measurements [55], and a
reduction of the astrophysical uncertainties on the calculated fluxes would be even more desirable.
We conclude by reminding that important parameters – other than and – describing
our Galaxy in relation to the propagation of charged particles can be fixed only with very precise low
energies data, and for various species. This in principle could be done by the AMS experiment on the
Space Station [26], which could measure fluxes from hundreds MeV/n up to TeV/n and for 1 Z
26.
7 Acknowledgements
We warmly thank D. Maurin and R. Taillet for the usage of numerical code for cosmic ray propagation developed in collaboration with one of the author (F.D.), and M.Aglietta, B.Alessandro, T. Janka, P.S. Marrocchesi, D. Maurin and G. Raffelt for useful discussions. F.D. acknowledges the A. von Humboldt Stiftung for financial support while at MPI in München.
References
- [1] K.Asakimori et al., ApJ 502 (1998) 278.
- [2] A.V.Apanasenko, Astropart.Phys. 16 (2001) 13.
- [3] H.S.Ahn et al., COSPAR-04; V.I.Zatsepin et al., Proc. 28th Int. Cosmic Ray Conf., Tsukuba, Japan (2003) 1829.
- [4] E.S.Seo et al., Adv.in Space Res. 33 (2004) 1777.
- [5] R.Dwyer and P.Meyer, ApJ 322 (1987) 981.
- [6] J.A.Lezniak and W.R.Webber, ApJ 223 (1978) 676.
- [7] M.Simon et al., ApJ 239 (1980) 712.
- [8] C.D.Orth et al., ApJ 226 (1978) 1147.
- [9] R.C.Mahel et al., Ap&SS 47 (1977) 163.
- [10] N.L.Grigorov et al., Proc.12th Int.Cosmic Ray Conf., Hobart, 5(1971)1746.
- [11] J.J.Engelmann et al., A&A 233 (1990) 96.
- [12] V.I.Zatsepin et al., Proc.23rd Int. Cosmic Ray Conf., Calgary (Canada) 2 (1993) 13.
- [13] M.Ichimura et al., Phys.Rev.D48 (1993) 1949.
- [14] F.Gahbauer et al., ApJ 607 (2004) 333.
- [15] J.Alcaraz et al., Phys.Lett. B472 (2000) 215; J.Alcaraz et al., Phys.Lett. B494 (2000) 193.
- [16] I.P.Ivanenko et al., Proc.23rd Int.Cosmic Ray Conf., Calgary (Canada) 2 (1993) 17.
- [17] S. P. Swordy et al., ApJ 349 (1990) 625.
- [18] D.Müller et al., ApJ 374 (1991) 356.
- [19] G.Bahsindzhagyan et al., Proc.28th Int.Cosmic Ray Conf.,Tsukuba (Japan) (2003) 2205.
- [20] N.L.Grigorov, Cosmic Res. 40, 2 (2002) 107.
- [21] A.P.Chubenko et al., Proc. 28th Int.Cosmic Ray Conf., Tsukuba (Japan) (2003) 2221; R.A.Mukhamedshin et al., Proc. 28th Int.Cosmic Ray Conf., Tsukuba (Japan) (2003) 2225.
- [22] R.A.Mukhamedshin et al., Proc. 28th Int.Cosmic Ray Conf., Tsukuba (Japan) (2003) 2225.
- [23] M.H.Israel et al., NASA Report NP-2000-05-056-GSFC.
- [24] W.Menn et al., ApJ 533 (2000) 281; R.Bellotti et al., Phys.Rev. D60 (1999) 052002; M.Boezio et al., ApJ 518 (1999) 457; T. Sanuki et al., ApJ 545 (2000) 1135.
- [25] S. Haino et al., Phys.Lett. B594 (2004) 35.
- [26] J.Burger, Eur.Phys.J. C33 (2004) 941.
- [27] V.S. Berezinskii, S.V. Buolanov, V.A. Dogiel, V.L. Ginzburg, & V.S. Ptuskin 1990, Astrophysics of Cosmic Rays (Amsterdam: North–Holland).
- [28] D. Maurin, F. Donato, R. Taillet, P. Salati, ApJ 555 (2001) 585.
- [29] D. Maurin, R. Taillet, F. Donato, A&A 394 (2002) 1039.
- [30] A. Wandel et al., ApJ 316 (1987) 676; A. Wandel, A&A 200 (1988) 279.
- [31] E.G. Berezhko et al., A&A 410 (2003) 189.
- [32] D. Maurin, M. Cassé, E. Vangioni-Flam, Astropart. Phys. 18 (2003) 471.
- [33] R. H. Kraichnan, Phys. Fluids 8 (1965) 1385.
- [34] F.C. Jones et al., ApJ 547 (2001) 264.
- [35] J.W. Armstrong, J.M. Cordes, B.J. Rickett, Nature 291 (1981) 561.
- [36] J. Scalo, B. G. Elmegreen, Ann.Rev.Astron.Astrophys. 42 (2004) 275.
- [37] M.Aglietta et al., ApJ 470 (1996) 501; T.Antoni et al., ApJ 604 (2004) 687.
- [38] L. O’C. Drury et al., Space Sci. Rev. 99 (2001) 329.
- [39] E.G. Berezhko, V.K. Yelshin, L.Y. Ksenofontov, Astropart. Phys. 2 (1994) 215.
- [40] F. A. Aharonian et al. (H.E.S.S. Collaboration) Nature 432 (2004) 75.
- [41] F. Donato et al., ApJ 563 (2001) 172.
- [42] F. Donato, D. Maurin, and R. Taillet, A&A 381 (2002) 539.
- [43] D. Maurin et al., Research Signposts, ”Recent Research Developments in Astrophysics”, astro-ph/0212111.
- [44] B.Wiebel-Sooth et al., A&A 330 (1998) 389.
- [45] L.W.Howell, Nucl.Instr. and Meth.Phys.Res. A480 (2002) 741.
- [46] E.Juliusson et al.,ApJ 191 (1974) 331.
- [47] J.H.Caldwell, ApJ 218 (1977) 269.
- [48] F.Gahbauer et al., ApJ 607 (2004) 333.
- [49] R. Taillet et al., ApJ 609 (2004) 173.
- [50] I.Büsching et al., ApJ 619 (2005) 314.
- [51] J.Ahrens et al., Astropart. Phys. 21 (2004) 565.
- [52] The Super-Kamiokande Collaboration, Ashie Y. et al., hep-ex/0501064, subm. to Phys. Rev. D.
- [53] F. Donato et al., Phys. Rev. D69 (2004) 063501.
- [54] A. Bottino et al., Phys. Rev. D70 (2004) 015005.
- [55] F. Donato, N. Fornengo, P. Salati, Phys. Rev. D62 (2000) 043003.