Sidebands to the lower kilohertz QPO in 4U 1636–53
Abstract
In this Paper we report on further observations of the third and fourth kilohertz quasi–periodic oscillations (QPOs) in the power spectrum of the low–mass X–ray binary (LMXB) 4U 1636–53. These kilohertz QPOs are sidebands to the lower kilohertz QPO. The upper sideband has a frequency 55.51.7 Hz larger than that of the contemporaneously measured lower kilohertz QPO. Such a sideband has now been measured at a significance in the power spectra of three neutron star LMXBs (4U 1636–53, 4U 1728–34, and 4U 1608–52). We also confirm the presence of a sideband at a frequency 55 Hz less than the frequency of the lower kilohertz QPO. The lower sideband is detected at a 3.5 level, only when the lower kilohertz QPO frequency is between 800 and 850 Hz. In that frequency interval the sidebands are consistent with being symmetric around the lower kHz QPO frequency. The upper limit to the rms amplitude of the lower sideband is significant lower than that of the upper sideband for lower kilohertz QPO frequencies 850 Hz. Symmetric sidebands are unique to 4U 1636–53. This might be explained by the fact that lower kilohertz QPO frequencies as high as 800–850 Hz are rare for 4U 1728–34 and 4U 1608–52. Finally, we also measured a low frequency QPO at a frequency of Hz when the lower kilohertz QPO frequency is between 700–850 Hz. A similar low–frequency QPO is present in the power spectra of the other two systems for which a sideband has been observed. We briefly discuss the possibility that the sideband is caused by Lense–Thirring precession.
keywords:
stars: individual (4U 1636–53) — accretion: accretion discs — stars: binaries — stars: neutron — X-rays: binaries1 Introduction
One of the important discoveries made with the Rossi X–ray Timing Explorer (RXTE) satellite is that of the kilohertz quasi–periodic oscillations (QPOs) in the power spectra of 20 accreting neutron star low–mass X–ray binaries (see van der Klis 2000 for a review). Kilohertz QPOs are caused by the motion of matter in regions of spacetime within a few kilometres of the surface of accreting neutron stars, where strong–field gravity is required to describe such motion. They potentially allow one to detect strong–field effects and to constrain the neutron star mass–radius relation. Although there is as yet no agreement about the precise physical mechanism underlying kilohertz QPOs, most models agree that the frequency of one of the observed kilohertz QPOs reflects the frequency of orbital motion at the inner edge of the accretion disc.
The basic phenomenology of kilohertz QPOs consists of two kilohertz QPO peaks, which are separated by =200–360 Hz and which move in frequency by up to 700 Hz in general correlation with mass accretion rate indicators (again see van der Klis 2000 for a review). The highest observed frequency is 1330 Hz (van Straaten et al. 2000), corresponding in the case of a 1.4 M⊙ neutron star to an orbital radius as tight as 15 km. Some of these sources also show X–ray bursts, in which burst oscillations are seen which last for a few seconds and have frequencies between 270 and 620 Hz (see Strohmayer & Bildsten 2004 for a review). These oscillations usually drift by 1-2 Hz but are near the neutron star spin frequency in each source (Chakrabarty et al. 2003). In the millisecond pulsar SAX J1808.4–3658 has been found to be equal to half the spin frequency, which disproves spin–orbit beat frequency models (Wijnands et al. 2003) and suggests instead that the neutron star spin induces resonances in the disk flow, perhaps involving the general relativistic epicyclic frequencies (Abramowicz et al. 2003; Wijnands et al. 2003; Lamb & Miller 2003).
After extensive searches for additional kilohertz QPO peaks at theoretically predicted frequencies which remained unsuccesful (e.g. in Sco X–1; Méndez & van der Klis 2000), Jonker et al. (2000) discovered sidebands at a frequency 50–65 Hz above the lower kilohertz QPO in 4U 1608–52, 4U 1728–34, and 4U 1636–53. Magnetospheric modulation of the lower kilohertz QPO, a beat phenomenon taking place inside the marginally stable orbit as well as Lense-Thirring precession are possible explanations for these sidebands (Jonker et al. 2000). Psaltis (2000) demonstrated that the hydrodynamic disk mode model (Psaltis & Norman 1999) naturally produces a sideband at a frequency near that observed plus several other, as yet unobserved peaks; no other models have so far been able to explicitly accommodate the sideband. The 50–65-Hz frequency difference between the lower kilohertz QPO and the sideband frequency, the ’sideband separation’ , is different in each source and not identical to any of the other QPO frequencies simultaneously observed in the 10–100 Hz frequency range (Jonker et al. 2000).
In this Paper we find evidence for symmetric sidebands to the lower kilohertz QPO in the atoll source 4U 1636–53.
2 Observations, analysis, and results
We used all the proportional counter array (PCA) data from RXTE observations of 4U 1636–53 available to us at the beginning of 2004. Hence, we included the data used by Jonker et al. (2000). The analysis we performed was the same as that done by Jonker et al. (2000). Below, a condensed description of the analysis steps is given; more details can be found in Jonker et al. (2000).
Using 128 s–long segments of high time resolution PCA data (122s resolution), we calculated power spectra up to a Nyquist frequency of 4096 Hz in an energy band of 2–60 keV. The power spectra were searched for lower kilohertz QPOs which are narrow (full–width at half maximum, FWHM, less than 10 Hz) and detected in 128 s at a significance larger than 2. This resulted in a selection of 244 ksec of data.
The lower kilohertz QPO was traced using a dynamical power spectrum (e.g. see plate 1 in Berger et al. 1996) to visualise the time evolution of the QPO frequency. For each power spectrum the lower kilohertz QPO peak was fitted in a range of 200 Hz centred on the traced frequency using a function consisting of a constant plus a Lorentzian. This provides us with a lower kilohertz QPO frequency measurement for each 128 s power spectrum. We used the shift–and–add technique described by Méndez et al. (1998) to shift each lower kilohertz QPO to a reference frequency. Next, the shifted, aligned, power spectra were averaged. The average power spectrum was finally fitted in the range 512–2048 Hz so as to exclude the edges which are distorted due to the shifting. The fit function consisted of a constant to fit the noise and three or four Lorentzians representing the QPOs. The fitted average power spectrum is displayed in Figure 1. Errors on the fit parameters were calculated using (1 single parameter).

We clearly detected the two kilohertz QPOs and the sideband to the lower kilohertz QPO. The sideband was detected at a significance of 6, confirming our previous detection of the sideband in 4U 1636–53 (Jonker et al. 2000). The frequency difference between the frequency of the lower kilohertz QPO and that of the sideband, Hz. The average kilohertz QPO frequency separation, , is 2835 Hz. The FWHM of the sideband, the lower kilohertz QPO and the upper kilohertz QPO is 12.72.7 Hz, 4.860.04 Hz, and 13011 Hz, respectively. Due to the fact that we have combined data with either 3, 4, or 5 active proportional counter units (PCUs) we cannot determine the fractional rms amplitude of the QPO peaks from the combined data. Therefore, we selected data where only 3, 4, or 5 PCUs were active, we fitted those data sets separately. In those separate fits we fixed the FWHM and the frequency of the QPOs to the values found using the complete data set. The fractional rms amplitude of the sideband is consistent with what was found before (see Table 1 and Jonker et al. 2000).
In order to search for changes in the sideband separation frequency we averaged shifted power spectra based on the unshifted frequency of the lower kilohertz QPO in three frequency bands; a lower kilohertz QPO frequency between 700–800 Hz, 800–850 Hz, and above 850 Hz. Interestingly, the average power spectrum in the lower kilohertz QPO frequency interval 800-850 Hz showed evidence for two sidebands located symmetrically around the lower kilohertz QPO peak (see Figure 2). The results of fits to these averaged power spectra are given in Table 1.
| All frequencies | 700–800 Hz | 800–850 Hz | 850–920 Hz | |
| Amount of data (ksec) | 244 | 64 | 80 | 99 |
| Mean stan. dev. (Hz) | 83050 | 76325 | 828 | 877 |
| (Hz) | 2835 | 3256 | 2869 | 2494 |
| (Hz) | – | – | 55.12.5 | – |
| (Hz) | 55.51.7 | 47.73.5 | 57.0 | 562 |
| rms amplitude (%) | 7.540.01 | 7.940.04 | 7.860.02 | 7.120.03 |
| FWHM | 4.860.04 | 5.40.1 | 4.450.06 | 4.900.06 |
| rms amplitude (%) | 4.030.11 | 4.50.3 | 4.00.2 | 3.40.2 |
| FWHM | 13011 | 10415 | 12018 | 8713 |
| rms amplitude (%) | 0.9a | 1.5a | 1.20.2 | 0.8a |
| rms amplitude (%) | 1.30.1 | 1.70.2 | 1.40.2 | 1.20.1 |
| FWHM | 12.72.7 | 145 | 124 | 104 |
| rms amplitude (%) | – | 2.70.2 | 2.30.1 | 1.6a |
| FWHM (Hz) | – | 173 | 204 | – |
| Frequency (Hz) | – | 42.10.8 | 43.51.6 | – |
a 95% upper limits (determined using ).
Adding more data with respect to the analysis performed by Jonker et al. (2000), we now find a QPO at low frequencies (43 Hz, see Figure 3). In order to compare the properties of this low–frequency QPO with that of the kilohertz QPOs and the kilohertz QPO separation frequencies we fitted the average unshifted power spectrum in the frequency range from 1/16–256 Hz in the three lower kilohertz QPO frequency intervals as shown in Table 1. In the frequency range 850 Hz and above the low frequency QPO was undetectable (see Table 1).


3 Discussion
Following the discovery by Jonker et al. (2000) of a new, third, kilohertz QPO in the power spectra of the three atoll–type low–mass X–ray binaries 4U 1608–52, 4U 1728–34, and 4U 1636–53 we obtained additional data with the RXTE satellite of 4U 1636–53 with the goal to study in detail the properties of this third kilohertz QPO, also known as the sideband to the lower kilohertz QPO. We selected 4U 1636–53 since in that source there is evidence for the presence of two sidebands located symmetrically around the lower kilohertz QPO peak frequency.
We confirm the presence of a sideband at a frequency 55.5 Hz higher than that of the lower kilohertz QPO frequency in 4U 1636–53 at a 6 significance level. Furthermore, the addition of the extra data allowed us to investigate the sideband(s) as a function of the lower kilohertz QPO frequency. We found that when the lower kilohertz QPO has a frequency in the range 800–850 Hz there is significant evidence (3.5, single trial) for the presence of a sideband at the lower frequency side of the lower kilohertz QPO. Selecting lower kilohertz QPO frequencies 850 Hz and when combining all the data, the rms amplitude of the lower sideband is significantly less than that of the upper sideband. For the frequency range 700–800 Hz the upper limit is consistent with the rms amplitude of the upper sideband.
In the framework of the sonic–point and spin–resonance model of Lamb & Miller (2003), the sideband is unlikely to be caused by Lense–Thirring precession at the radius where the spin–resonance occurs (near the orbital radius with a Kepler frequency of ), since for neutron star spin frequencies such as those considered here, the Lense–Thirring precession frequency at that radius is 2 Hz, this is much too low. It is possible though that the radiation pattern responsible for the upper kilohertz QPO is modulated by the Lense–Thirring precession at the sonic–point radius, this modulation would then in turn modulate the formation of the lower kilohertz QPO. In such a scenario the upper kilohertz QPO should also display sidebands. The fact that these have not yet been detected can be explained by the large FWHM of the upper kilohertz QPO, which precludes the detection of such sidebands. The skewed shape of the upper kilohertz QPO in the average power spectrum (see e.g. Fig 1) can be explained by the fact that the upper kilohertz QPO rms amplitude and change as a function of kilohertz QPO frequency (e.g. Méndez et al. 1998, Table 1).

If Lense–Thirring precession is responsible for the production of the sideband, and if the sideband separation frequency , reflects the Lense–Thirring precession frequency, would be expected to change as the Keplerian frequency squared (). In Figure 4 we plotted as a function of the lower (left panel) and upper kilohertz QPO (right panel), respectively. The sideband separation frequency is consistent with being constant when the lower/upper kilohertz QPO frequency changed by / Hz, respectively. The best fitting quadratic relation that would be appropriat assuming the lower/upper kilohertz QPO reflects the Keplerian motion at a preferred radius in the disc and the Lense–Thirring precession frequency at that same radius is also shown. The normalisation of the quadratic curve is given by ( is the Lense–Thirring precession frequency, I the moment of inertia of the neutron star, the spin frequency of the star which is 581 Hz in case of 4U 1636–53 from Strohmayer et al. 1997, the speed of light, and the mass of the neutron star). The curve in the left panel requires I45/m to be 3.050.07, that in the right panel 0.170.01, where I45 and m are in units of 1045 g cm2 and M⊙, respectively; the expected range of this quantity is between 0.5 and 2 (Stella & Vietri 1998).
Recently, a model explaining the kilohertz QPOs has been proposed that invokes the existence of a non–linear resonance between the vertical and radial epicyclic frequencies in an accretion disc around a neutron star (Abramowicz et al. 2003). Some versions of this model also include a resonance of these frequencies with the spin frequency of the neutron star (Kluźniak et al. 2004; Lee et al. 2004). The resonance model has been introduced as a way to explain the existence of preferred values in the distribution of QPO frequency ratios (Abramowicz et al. 2003; but see Belloni et al. 2004) as well as the commensurability of the neutron star spin and the kilohertz QPO frequency separation. So far it has not been explored whether a resonance mechanism could also explain the sidebands to the kilohertz QPOs. For instance, it may be possible that the Lense–Thirring precession at the radius at which the main resonance between the vertical and radial epicyclic frequencies occurs produces a modulation of the amplitude of the kilohertz QPOs. In principle, this modulation should produce equally strong sidebands, and should also produce sidebands on both QPOs. Alternatively, since for a rotating neutron star the azimuthal (Keplerian) frequency is larger than the vertical frequency, the sideband could be due to a resonance involving the azimuthal frequency at a radius at which a resonance between the vertical and radial epicyclic frequencies produce the upper and lower kilohertz QPOs. For instance, in this scenario a resonance between the azimuthal and radial frequencies would produce a QPO at a frequency slightly higher than that of the upper kilohertz QPO. The advantage of this mechanism compared to an amplitude modulation is that it could in principle explain the fact that the upper sideband is stronger than the lower sideband. However, it remains unclear how a QPO at a frequency Hz higher than that of the lower kilohertz QPO would appear in this scenario.
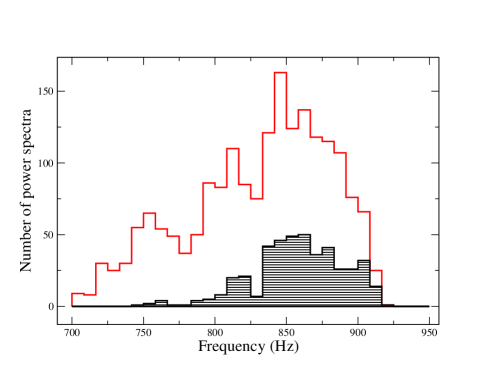
Previously, 4U 1636–53 was the only source out of the three sources where a sideband to the lower kilohertz QPO that showed no low–frequency QPO (Jonker et al. 2000). Now, with the additional RXTE data, we could identify a low–frequency QPO at a frequency of 43 Hz, similar to the one found in 4U 1728–34 and 4U 1608–53 (see Jonker et al. 2000). The probable reason why this low–frequency QPO was not observed before is that the source did not sample the states where this QPO is present often. Much of the new data were obtained in the state showing the low–frequency QPO. From Table 1 it can be seen that the lower kilohertz QPO frequency has to be below 850 Hz for the low–frequency QPO to be detected. Comparing the observed frequency distributions of the data set used by Jonker et al. (2000) (Figure 5 shaded area top panel) with that used in this work (Figure 5 overall grey line top panel) it is clear that besides an increase in the amount of data, the lower kilohertz QPO frequencies in the range 700–850 Hz are much better sampled in the new dataset. A likely explanation for the fact that the distribution of the observed lower kilohertz QPO frequencies is different during the new RXTE observations from that observed in the data set used by Jonker et al. (2000), is that the X–ray flux of 4U 1636–53 has been decreasing over the last few years (see Fig. 5 bottom panel), allowing many of the additional new observations to be obtained at flux levels and at lower kilohertz QPO frequencies which were sparsely observed before in 4U 1636–53 with RXTE

Acknowledgments
Support for this work was provided by NASA through Chandra Postdoctoral Fellowship grant number PF3–40027 awarded by the Chandra X–ray Center, which is operated by the Smithsonian Astrophysical Observatory for NASA under contract NAS8–39073.
References
- Abramowicz et al. (2003) Abramowicz, M. A., Karas, V., Kluzniak, W., Lee, W. H., Rebusco, P., 2003, PASJ, 55, 467
- Belloni et al. (2004) Belloni, T., Méndez, M., Homan, J., 2004, submitted to ApJ
- Berger et al. (1996) Berger, M., et al., 1996, ApJ, 469, L13
- Chakrabarty et al. (2003) Chakrabarty, D., Morgan, E. H., Muno, M. P., Galloway, D. K., Wijnands, R., van der Klis, M., Markwardt, C. B., 2003, Nat, 424, 42
- Jonker et al. (2000) Jonker, P. G., Méndez, M., van der Klis, M., 2000, ApJ, 540, L29
- Kluźniak et al. (2004) Kluźniak, W., Abramowicz, M. A., Kato, S., Lee, W. H., Stergioulas, N., 2004, ApJ, 603, L89
- Lamb & Miller (2003) Lamb, F. K., Miller, M. C., 2003, ApJ
- Lee et al. (2004) Lee, W. H., Abramowicz, M. A., Kluźniak, W., 2004, ApJ, 603, L93
- Méndez & van der Klis (2000) Méndez, M., van der Klis, M., 2000, MNRAS, 318, 938
- Méndez et al. (1998) Méndez, M., van der Klis, M., van Paradijs, J., 1998, ApJ, 506, L117
- Méndez et al. (1998) Méndez, M., van der Klis, M., Wijnands, R., Ford, E. C., van Paradijis, J., Vaughan, B. A., 1998, ApJ, 505, L23
- Psaltis (2000) Psaltis, D., 2000, ApJ, submitted, astroph 0010316
- Psaltis & Norman (1999) Psaltis, D., Norman, C., 1999, ApJ, submitted, astroph 0001391
- Stella & Vietri (1998) Stella, L., Vietri, M., 1998, ApJ, 492, L59
- Strohmayer & Bildsten (2004) Strohmayer, T. E., Bildsten, L., 2004, in X-ray binaries, Cambridge Astrophysics Series: Cambridge University Press, 2004, edited by Lewin, W. H. G.; Van der Klis, M.
- Strohmayer & Markwardt (2002) Strohmayer, T. E., Markwardt, C. B., 2002, ApJ, 577, 337
- Strohmayer et al. (1997) Strohmayer, T. E., Jahoda, K., Giles, A. B., Lee, U., 1997, ApJ, 486, 355
- van der Klis (2000) van der Klis, M., 2000, ARA&A, 38, 717
- van Straaten et al. (2000) van Straaten, S., Ford, E. C., van der Klis, M., Méndez, M., Kaaret, P., 2000, ApJ, 540, 1049
- Wijnands (2001) Wijnands, R., 2001, ApJ, 554, L59
- Wijnands et al. (2003) Wijnands, R., van der Klis, M., Homan, J., Chakrabarty, D., Markwardt, C. B., Morgan, E. H., 2003, Nat, 424, 44