Proper Motions of the BN Object and the I Radio Source in Orion: Where and When Did BN Become a Runaway Star?
Abstract
We present absolute astrometry of the core of the Orion molecular cloud, made with Very Large Array archive data taken over the last two decades. Our analysis reveals that both the BN object and the radio source I have proper motions: the BN object has a proper motion of mas yr-1 (corresponding to a velocity of km s-1 at an adopted distance of 450 pc) to the northwest, while the radio source I has a proper motion of mas yr-1 (corresponding to a velocity of km s-1) to the southeast. The motion of the two sources is nearly antiparallel, diverging from a point in between them, where they were located about 500 years ago. These results suggest that the BN object and the radio source I were part of a multiple young stellar system that disintegrated in the recent past.
1 Introduction
The dynamical decay of triple and multiple young stellar systems, in which one or more member stars are ejected from the group, is expected to have profound effects in the star formation process (Reipurth 2000). However, very few clear examples of fast-moving, runaway objects have been found in association with regions of star formation.
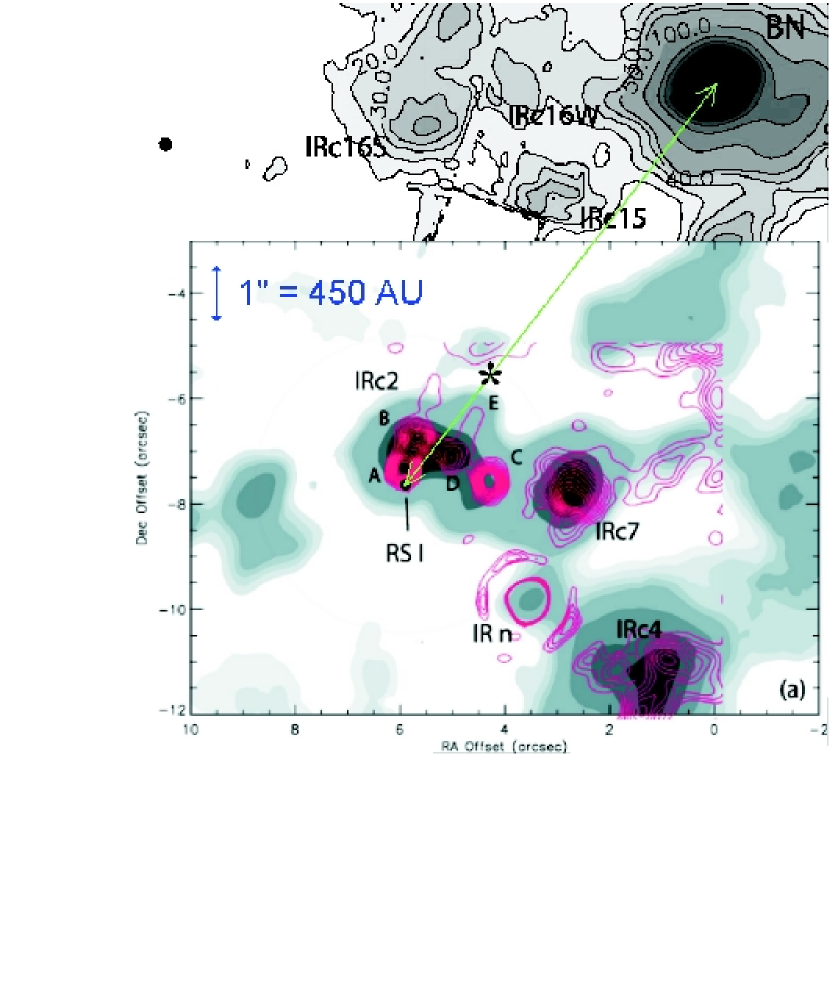
Perhaps the best example of a young runaway star is the Becklin-Neugebauer (BN) object in the Orion region. This bright 2 m source (Becklin & Neugebauer 1967) was first detected as a radio source by Moran et al. (1983). From radio data taken from 1986.3 to 1995.0, Plambeck et al. (1995) discovered that it exhibited a velocity in the plane of the sky of to the NW. In a recent study, Tan (2004) proposed that the BN object was ejected from the Orion Trapezium some 4000 yr ago. However, the possible existence of another runaway star (JW451; Jones & Walker 1988) recently ejected from the Orion Trapezium (Poveda et al. 2005) led us to revise the origin of BN’s large motions. The BN object, the Kleinmann-Low nebula and their immediate environment are very suggestive of another trapezium similar to the visible Orion Trapezium, but still embedded in an obscuring envelope. In fact, the 20 m brightness contours of the BN-KL area (Gezari, Backman, & Werner 1998) show a morphology strongly reminiscent of that of the Orion Trapezium, particularly as it should have looked at 20 m before the UV radiation from Orionis C had ionized and cleared the obscuring envelope. Also, the projected dimensions (d 15” ) and the bolometric luminosity of the BN-KL complex () are similar to those of the Orion Trapezium. Moreover, a number of compact radio and infrared sources are detected in the BN-KL region (see Fig. 6 of Gezari et al. 1998 and Fig. 2 of Shuping, Morris, & Bally 2004), indicating that there are many fainter stars deeply embedded there. Furthermore, from a high resolution study of the region, Shuping et al. (2004) find the star density in the region to be as high as, or even higher than, that of the Trapezium cluster. The strong similarities between the BN-KL complex and the Orion Trapezium motivated us to hypothesize that the former environment is also a propitious place to accelerate a runaway star like BN. In the following we examine observationally the possibility that the BN object might have been accelerated by dynamical interactions occurring within a young multiple stellar system, still embedded in the obscured BN-KL region.
2 Observations
We searched in the archives of the Very Large Array (VLA) of the National Radio Astronomy Observatory (NRAO)111NRAO is a facility of the National Science Foundation operated under cooperative agreement by Associated Universities, Inc. for observations of the Orion BN region taken with high angular resolution ( or better), good coverage of the (u,v) plane, and that were made using as phase calibrator the nearby () quasar 0541-056 (J2000 equinox). We obtained data with these characteristics for five different epochs: 1985.05, 1995.56, 2000.86, 2000.87, and 2002.25 (see Table 1). To obtain reliable absolute astrometry, we used for all epochs the most recent refined position of 0541-056 for 2000.25 (). We found significant proper motions only in the BN object and in the radio source I. The observations of the nearby bright and compact sources A, D, G, and H (see Garay et al. 1987 and Felli et al. 1993 for the nomenclature) did not show significant proper motions in right ascension or declination at a typical 3- upper limit of 2-3 milliarcsecond per year (mas yr-1). Since our data coverage had a large gap between 1985.05 and 1995.56, we used high angular resolution observations taken on 1991.67 and 1991.68 (see Table 1) using different phase calibrators (0501-019 and 0530+135 on both epochs). Assuming that, on the average, the sources A, D, G, and H did not have proper motions, we corrected systematically all positions in the 1991.67 and 1991.68 images to make them consistent with the other epochs. In summary, we analyzed seven epochs taken from 1985 to 2002, with good sampling across this time period. The main observational parameters of these observations are listed in Table 1. All the observations were made in the most extended A configuration and those of 2000.86 and 2000.87 included the Pie Town link, that provides improved angular resolution.
The continuum data were edited and calibrated following the VLA standard procedures. The data for 1985.05, 1991.68, 1995.56, 2000.87 were self-calibrated, while those for 1991.67, 2000.86, and 2002.25, when the continuum was in all cases observed simultaneously with bright maser emission, were cross-calibrated, using the self-calibrated maser solutions to calibrate the continuum. Cleaned maps were obtained using the task IMAGR of AIPS and the ROBUST parameter set to 0.
3 Results
Figure 1 shows the main result of our analysis. By comparing the first and last epoch of the set of seven observations, we clearly see that both the BN object and the radio source I have proper motions, diverging from a point between them. In Figure 2 we show the right ascension and declination of both sources as a function of time. The positions were determined from a linearized least-squares fit to a Gaussian ellipsoid function using the task IMFIT of AIPS. The error in position for each observation was taken to be the sum in quadrature of the relative error of the source in the given image (proportional to the angular resolution over the signal-to-noise ratio) and a systematic error, taken to be 10 mas in right ascension and declination at all epochs.
The absolute proper motions and the position angles of motion are given in Table 2. We conclude that the BN object is moving to the northwest with a velocity in the plane of the sky of , while the radio source I is moving to the southeast with a velocity in the plane of the sky of . If the BN object and the radio source I were in the past part of a multiple stellar system that became disintegrated some 500 years ago (see below), we expect that the ratio of velocities in the plane of the sky, a factor of about 2.3, applies also to the radial velocities. As discussed by Plambeck et al. (1995) and Tan (2004), the ambient molecular cloud has an LSR velocity of about 9 km s-1, while the velocity of the BN object is 21 km s-1, giving a radial velocity of +12 km s-1 with respect to the ambient cloud. On the other hand, the mean velocity of the SiO maser associated with the radio source I is 5 km s-1, giving a radial velocity of -4 km s-1 with respect to the ambient cloud. The ratio of radial velocities is 3 consistent with the value of 2.3 determined from the velocities in the plane of the sky. It should be pointed out, however, that the SiO maser emission traces the interaction of a fast jet with the surrounding medium and that the true radial velocity of the source I may be difficult to recover from the velocity of the SiO masers. We conclude that the BN object moves with a total velocity of 30 km s-1, receding with respect to the molecular cloud , while the radio source I moves with a total velocity of 13 km s-1, approaching with respect to the molecular cloud. The possibility that both the BN object and the radio source I had significant proper motions had been mentioned by Plambeck et al. (1995), Tan (2004), and Bally & Zinnecker (2005), but this is the first time that direct observational evidence is presented.
The relative astrometry between the BN object and the radio source I is very accurate, since it does not include the estimate for the systematic errors that have to be taken into account for the absolute positioning of the sources. We obtain and , corresponding to a total proper motion of toward a position angle of , in excellent agreement with the determination of Tan (2004) from independent millimeter observations ( at a PA of ). Extrapolating the velocity vector backward and assuming no acceleration, we find that the BN object and the radio source I were within of each other (see Figure 3) around epoch (that is, about 500 years ago).
4 Discussion
We will consider two possibilities for the origin of the observed motions of the BN object and source I. First, we will discuss the possibility that they formed a triple system which interacted 500 years ago, forming a very close binary (source I) and the runaway BN object. To examine this possibility, we need to estimate the mass of both objects. From mid-infrared imaging of the Orion BN/KL region Gezari et al. (1998) found a luminosity for the bright core of the BN object of 2500 which corresponds to a central star with a mass (Schaller et al. 1992). On the other hand, if the ionized HII region around BN is optically thin at GHz (as proposed by Plambeck et al. 1995) one obtains an ionizing photon rate of (Mezger, Smith, & Churchwell 1974) that corresponds to (Diaz-Miller, Franco, & Shore 1998). For , conservation of linear momentum of the original triple system implies that for the velocity ratio of 2.3 between the BN object and source I, the total mass of source I should be in the range . If each member of the binary system in I has half the mass, the total luminosity of this source would be in the range . If the primary dominates the mass, the maximum luminosity of source I could be as large as , comparable with the total luminosity of the region. Nevertheless, this latter configuration is dynamically less favorable for ejection.
Source I is detected only in radio continuum emission, and it is not detected even at mid-IR wavelengths (e.g., Plambeck et al. 1995; Greenhill et al 2004). Luminosities of the order of are expected due to its association with SiO masers (Menten & Reid 1995). If the ionized region is optically thin at GHz (see Figure 2 of Beuther et al. 2004) one can estimate the mm flux expected from the hypothetical binary system. If the binary system has 2 components each with a mass of the order of , the predicted optically-thin free-free flux density at GHz is , consistent with a turnover frequency of 100 GHz. On the other hand, if the binary components have masses larger that (using the upper limit of or assuming that the primary dominates) the predicted flux is , i.e., at least a factor of 30 greater than the flux expected from a 100 GHz turnover frequency. In the latter case, the observed relatively weak continuum emission could be due to the presence of an ionized jet as in the case of IRAS 20126+4101 (Hofner et al. 1999) where very high density circumstellar gas “quenches” the normal HII region. The extinction to this source is estimated to be very large, (Gezari et al. 1998; Beuther et al. 2004). Thus, even a very luminous source could be hidden by the obscuring envelope of source I. It is important to emphasize that the results of Beuther et al. (2004) are also consistent with a source that becomes optically thin at much higher frequencies and that the free-free emission of source I can be quite large in the sub-millimeter.
As discussed above, 500 years ago, the BN object was within less than 225 AU of source I, consistent with both sources being members of a compact stellar group. We now assume that the original triple system had a total negative energy given by a fraction of the final binding energy of the binary system in I, , where and are the masses of the primary and secondary stars, respectively, and is the semi-major axis of the binary. Energy conservation implies that , where is the fraction of the total mass of the primary. For and , the semi-major axis is in the range for the range for discussed above, resulting in a period . The relative velocity of the stars at perihelion is , thus one expects . The space velocities of the BN object and the I source indicate that their trajectories make an angle of only with respect to the plane of the sky. The mass ratio of the binary components and the angle of the orbital plane with respect to the sky are not known. One could try to restrict these parameters looking for evidence of velocity asymmetries or time variations of the observed distribution of velocity centroids of the SiO masers (Plambeck et al. 1990; Menten & Reid 1995). However, as noted above, the SiO maser emission may not trace the true radial velocity of the source I. The main implication of the triple system scenario is that source I has to be a massive binary.
A second possible scenario is that instead of having a triple system, the interaction ocurred between several members of a collapsing protostellar group, as modeled by Poveda, Ruiz, & Allen (1967). In this scenario, 500 years ago at the position of ejection (see location of black asterisk in Figure 3), a bound multiple protostellar group experienced close encounters which accelerated BN and I in opposite directions; in order to preserve momentum and the initial negative energy one or more of the protostars, possibly together with their disks and envelopes, recoiled as a tight binary and multiple moving objects (see Fig. 2 in Poveda et al. 1967). This would explain why the region where BN and I were at minimum separation (see Figure 3), is at present nearly devoid of infrared sources. Note that at present the cluster of infrared sources IRc2 (ABCD) is located within 1”-2” to the northwest quadrant of I, in the direction of the original position of the proposed multiple cluster, suggesting that the tight multiple system was initially composed of BN, I and the IRc2 complex, and that the n-body interaction ejected I with a bound close companion together with the IRc2 objects, thus explaining their relative positions at present. This multiple source scenario implies that the members of the IRc2 group should be participating in the expansion with a sizeable fraction of the velocity of I. This possibility can be tested with future astrometric observations of the IRc2 cluster in the infrared. This multiple source scenario would allow source I to be less massive than in the triple source scenario described before.
References
- (1) Bally, J., & Zinnecker, H. 2005, AJ, in press
- (2) Becklin, E. E., & Neugebauer, G. 1967, ApJ, 147, 799
- Beuther et al. (2004) Beuther, H., et al. 2004, ApJ, 616, L23
- Diaz-Miller et al. (1998) Diaz-Miller, R. I., Franco, J., & Shore, S. N. 1998, ApJ, 501, 192
- (5) Felli, M., Churchwell, E., Wilson, T. L., & Taylor, G. B. 1993, A&AS, 98, 137
- (6) Garay, G., Moran, J. M., & Reid, M. J. 1987, ApJ, 314, 535
- (7) Genzel, R., & Stutzki, J. 1989, ARA&A, 27, 41
- (8) Gezari, D. Y., Backman, D. E., & Werner, M. W. 1998, ApJ, 509, 283
- Greenhill et al. (2004) Greenhill, L. J., Gezari, D. Y., Danchi, W. C., Najita, J., Monnier, J. D., & Tuthill, P. G. 2004, ApJ, 605, L57
- (10) Hofner, P., Cesaroni, R., Rodríguez, L. F., & Martí, J. 1999, A&A, 345, L43
- (11) Jones, B. F., & Walker, M. F. 1988, AJ, 95, 1755
- Menten & Reid (1995) Menten, K. M., & Reid, M. J. 1995, ApJ, 445, L157
- Mezger et al. (1974) Mezger, P. G., Smith, L. F., & Churchwell, E. 1974, A&A, 32, 269
- (14) Moran, J. M., Garay, G., Reid, M. J., Genzel, R. Wright, M. C. H., & Plambeck, R. L. 1983, ApJ, 271, L31
- Plambeck et al. (1990) Plambeck, R. L., Wright, M. C. H., & Carlstrom, J. E. 1990, ApJ, 348, L65
- (16) Plambeck, R. L., Wright, M. C. H., Mundy, L. G., & Looney, L. W. 1995, ApJ, 455, L189
-
(17)
Poveda, A., Ruiz, J., & Allen, C., 1967, Bol. Obs. Tonantzintla y
Tacubaya, 4, 86 (http://www.astrosmo.unam.mx/
~luisfr/Poveda67.pdf) - (18) Poveda, A., Allen, C., & Hernández, A. 2005, submitted to ApJ
- (19) Reipurth, B. 2000, AJ, 120, 3177
- Schaller et al. (1992) Schaller, G., Schaerer, D., Meynet, G., & Maeder, A. 1992, A&AS, 96, 269
- (21) Shuping, R. Y., Morris, M., & Bally, J. 2004, AJ, 128, 363
- (22) Tan, J. C. 2004, ApJ, 607, L47


| Frequency | Wavelength | Synthesized Beam | |
|---|---|---|---|
| Epoch | (GHz) | (cm) | ()aaMajor axisminor axis in arcsec; PA in degrees |
| 1985 Jan 19 (1985.05) | 14.940 | 2.0 | |
| 1991 Sep 02 (1991.67) | 22.285 | 1.3 | |
| 1991 Sep 06 (1991.68) | 8.440 | 3.6 | |
| 1995 Jul 22 (1995.56) | 8.440 | 3.6 | |
| 2000 Nov 10 (2000.86) | 43.165 | 0.7 | |
| 2000 Nov 13 (2000.87) | 8.460 | 3.5 | |
| 2002 Mar 31 (2002.25) | 43.215 | 0.7 |
| VelocityaaVelocity in the plane of the sky for an assumed distance of 450 pc (Genzel & Stutzki 1989). | PA | ||||
|---|---|---|---|---|---|
| Source | () | () | () | () | (∘) |
| BN Object | |||||
| I Radio Source |