11email: uwolter@hs.uni-hamburg.de, jschmitt@hs.uni-hamburg.de
Localizing plages on BO Mic††thanks: Based on observations obtained at the ESO VLT
We have obtained a densely sampled time series of Ca ii H&K line profiles of the ultrafast rotating K-dwarf star BO~Mic. Taken at high resolution, the spectra reveal pronounced variations of the emission core profiles. We interpret these variations as signs of concentrated chromospherically active regions, in analogy to solar plages. We further interpret the variations as partly due to the rapid growth and decay of plages, while other variations appear to be caused by plages moved over the visible stellar disk by rotation. The equivalent width of the Ca K core emission changes approximately in anti-phase to the photospheric brightness, suggesting an association of the chromospheric plage regions with pronounced dark photospheric spots. We believe that further analysis of the presented spectral time series will lead to a chromospheric Doppler image of BO mic.
Key Words.:
stars: activity – chromospheres – late-type – stars: imaging – stars: individual: BO Mic1 Introduction
The core emission of the Ca ii H&K lines (3968.49 Å and 3933.68 Å) has become an indispensable tool of stellar atmospheric diagnostics, starting with the pioneering observations of Eberhard & Schwarzschild, (1913). The cores of Ca H&K are formed in high layers of the stellar atmosphere, they react sensitively to the temperature there, i.e. to chromospheric activity.
For the Sun, three components can be discerned in spatially resolved images of the chromosphere: (i) Quiescent regions; (ii) the chromospheric network covering the whole solar surface; (iii) extended regions with increased chromospheric emission, associated with active regions, called plages. Whether a similar hierarchy of chromospherically active regions also exists on stars other than the Sun is only poorly known at present. The observed variability of stellar Ca H&K core emission is usually interpreted as a superposition of rotational modulation and intrinsic long-term variations (e.g. Vaughan et al.,, 1981; Char et al.,, 1993). This interpretation suggests a concentration of chromospheric activity in plage-like regions, leading to the rotational modulation, embedded in more homogeneously distributed chromospherically active regions producing the observed basal fluxes.
Previous studies of Ca H&K emission concentrated on either long-term variability observed at relatively low spectral resolution (e.g. Baliunas et al.,, 1998) or high-resolution “snapshots” (e.g. Linsky et al.,, 1979; Pasquini et al.,, 1988). Only a few studies combine regular phase sampling with high or moderate spectral resolution in order to attempt localizing chromospheric features. Neff et al., (1989) and Busa et al., (1999) analyzed UV observations of the Mg ii h&k lines carried out by the IUE satellite. By applying multi-Gauss fits to the rotationally broadened line profiles of the RS CVn systems HR~1099 and AR~Lac, these authors could detect weak rotational modulation of the profiles and localize chromospheric emission regions on the stellar surface. Because of the barely resolved rotational line broadening and limitations due to the noise level of the spectra, only rough localizations were possible.
In the following, we present first results concerning a more precise localization of chromospheric emission features on the surface of the ultrafast rotating, apparently single young K-dwarf star BO Mic, usually nicknamed “Speedy Mic” (K2V, days). We use observations combining high spectral resolution, dense and continuous phase sampling and high SNR. Its fast rotation and high level of activity (e.g. Bromage et al.,, 1992) make BO Mic a formidable object for such a study.
2 Observations
The observations were performed with the VLT at the ESO Paranal on two nights (2002 August 2 and 7), continuously sampling two complete rotations of BO Mic. The spectrograph Uves was used in a dichroic mode, resulting in covered spectral ranges of 3260 Å to 4450 Å and 4760 Å to 6840 Å at a spectral resolution of .
The red arm spectra have been analyzed to produce high-resolution Doppler images of photospheric spots on BO Mic’s surface (Wolter et al. 2005, below WSW, 2005), details of the data reduction can be found there. In total, we obtained 273 spectra of BO Mic; these spectra have been added in pairs for the subsequent analysis, discarding 18 spectra because of poor SNR due to clouds. The resulting spectra have typical exposure times of about 450 s; their average separation is 540 s. The SNR range from 60 to 120, with a typical value of 90. The following discussion concentrates on the August 2 spectra; the August 7 spectra are of equal quality and show a qualitatively very similar behaviour.
3 Results
3.1 Rotational broadening
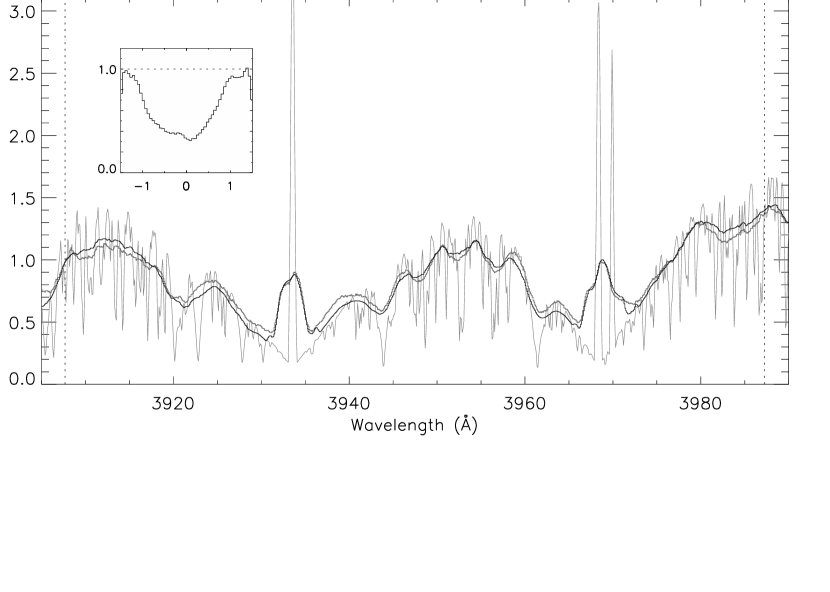
Fig. 1 shows one spectrum from the recorded time series. It is compared to a fit obtained by convolving a narrow-lined template spectrum with a broadening function. The broadening function models the Doppler-broadening due to rotation and the distribution of emission regions on the stellar surface. The fit approximately reproduces all features of the BO Mic spectrum; this illustrates that the Ca H&K emission cores of BO Mic can be interpreted as resulting from emission regions distributed over essentially the whole stellar surface. The broadening function was determined by our deconvolution procedure sLSD (“selective least squares deconvolution”, cf. WSW, 2005).
The used template spectrum has been generated in the following way: We started out from the observed spectrum of a chromospherically active star of similar spectral type with a low projected rotational velocity km/s (HD~155885, K1 V). In order to crudely simulate a star with much stronger chromospheric activity, we modified HD 155885’s spectrum by amplifying the emission cores of both the Ca H&K lines by a factor of 5. Additionally, we added a tentative emission core to the Hϵ line (3970.07 Å). Only adding these amplified line emission cores leads to a qualitatively correct fit to the observed spectra of BO Mic.
3.2 Emission core variations
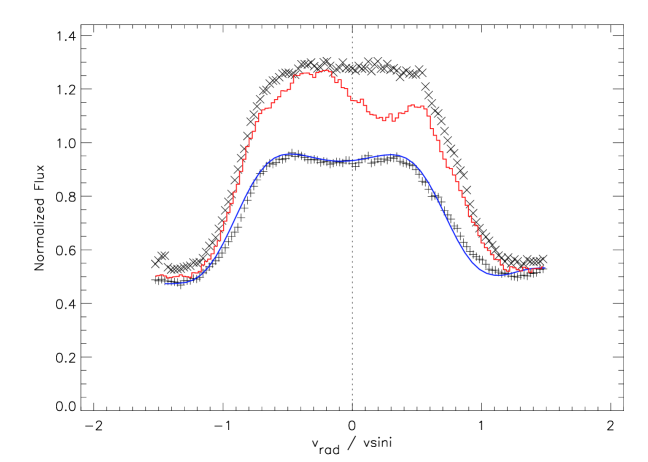
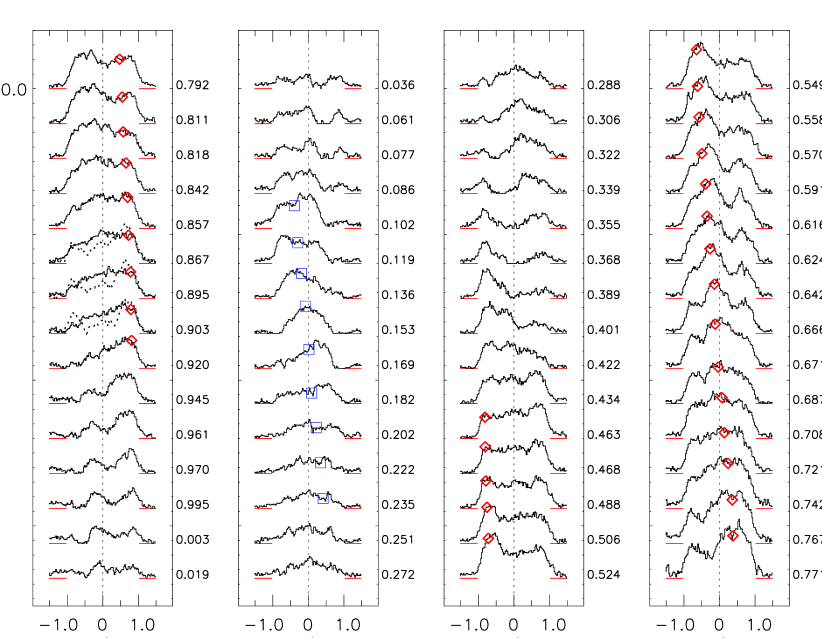
Fig. 2 provides a more detailed view of the Ca K core profile of BO Mic. To illustrate the total range of observed variations, the upper and lower envelope of all observed profiles have been plotted; these are termed the maximum and minimum profile in the following, respectively.
The line profiles have been normalized to the surrounding line flanks of the Ca K line (between 3923.5 Å and 3925.5 Å). This normalization introduces no significant error when comparing Ca K cores at different phases: As the maximum and minimum profiles in Fig. 2 show, the line flanks outside the emission core do not show variations above the noise level. The wavelength scale has been transformed to units of projected rotation velocity, using a value of 134 km/s, as determined by WSW, (2005).
Fig. 2 clearly illustrates the large amplitude of the variations. Practically all core profiles show pronounced deformations, making most of them significantly asymmetric. In contrast, the symmetry of the maximum and minimum profiles is quite striking.
As also shown in Fig. 2, this minimum profile can be closely approximated by convolving the template spectrum of Fig. 1 with an analytic rotation profile (Gray,, 1992; WSW,, 2005). More precisely, the Ca K core of the template spectrum has been reduced by 80% in equivalent width and broadened by a Gaussian of 0.8 Å width in order to obtain a close fit to the minimum profile flanks. This convolution describes the broadening of the line core due to rotation, assuming emission regions homogeneously distributed over the whole stellar surface. It adopts a linear limb darkening law with a limb darkening parameter of , i.e. it represents a limb brightening. Regardless of the adopted linear law, a pronounced limb brightening is required to approximate the line core profile.
The variations of the core equivalent width are plotted in Fig. 4. They should be interpreted with some care, since they depend on the level of chromospheric emission and the value of the underlying photospheric continuum. A comparison with the simultaneous photospheric lightcurve plotted in the same figure (reconstructed from our Doppler images, cf. WSW, 2005) shows that the maximum core equivalent width indeed coincides closely with the photospheric brightness minimum. Qualitatively, this would even result from a constant chromospheric emission level, due to photospheric variations alone. However, the Ca K core flux variations are far too strong to be explained in this way. They amount to about of the average flux (cf. Fig. 2), while the photospheric brightness varies only by about . However, the shape variations of the Ca K core are not affected by this argument; only these shape variations are analyzed in the following.
3.3 Rotational modulation
Fig. 3 shows the continuously sampled variations of the Ca K line core for one complete rotation of BO Mic. Rotation phases were calculated using the same ephemeris as WSW, (2005), based on the rotation period determined by Cutispoto et al., (1997): . For each rotation phase the difference of the observed and the minimum profile has been plotted. Here, this procedure merely serves a compact graphical representation; the variations are equally well visible in the observed core profile without this subtraction (cf. Fig. 2).
Many of the core shape deformations change too fast to be attributable to rotational modulation. An example is illustrated in Fig. 3 by the square-marked feature at phases 0.102 - 0.235. The squares mark the rotationally induced migration of a profile deformation caused by a tentative equatorial feature. Such a profile deformation shows the fastest possible migration associated with a fixed feature directly on the stellar surface. Note that the squares do not match the observed evolution of the most pronounced deformations at these phases. As a consequence these variations must be caused by intrinsic variations of the emitting regions on the surface, i.e. by their growth or decay. Note that some of these changes take place on timescales of about 10 minutes, the typical separation of two subsequent profiles.
On the other hand, several variations of the core shape are clearly suggestive of rotational modulation: They show the characteristic appearance in the blue wing of the line core and a migration towards the red. As an example, the diamonds in Fig. 3 approximately mark one such “bump” apparently migrating though the profiles. The corresponding surface feature would be located at mid-latitude on the stellar surface (at latitude and longitude, using the coordinates of WSW, 2005).

4 Summary and discussion
We study the Ca H&K emission cores of the ultrafast rotating pre-main-sequence star BO Mic, our observations continuously cover two complete stellar rotations. The observed line cores can be approximated by the rotationally broadened template spectrum of a slowly rotating star. The used template spectrum models an extremely chromospherically active star; it was generated from an observed K-dwarf spectrum by massively amplifying the emission cores of the Ca H&K and Hϵ lines. No slowly rotating late-type star known to us shows a level of chromospheric emission comparable to the resulting template spectrum, confirming BO Mic’s strong chromospheric activity.
Despite the large asymmetry of the individual emission profiles, the minimum Ca K core profile reconstructed from all observed spectra is nearly symmetric, it can be closely approximated using an analytic rotational broadening function. This approximation suggests to interpret the minimum profile as a proxy of BO Mic’s “basal” chromospheric emission, originating from regions homogeneously distributed over the whole stellar surface. In this respect, these regions are possible analogues of the solar chromospheric network; this interpretation is supported by the inferred limb brightening which is also observed for solar chromospheric faculae when measuring their contrast to the photospheric continuum.
The equivalent width of the Ca K core varies approximately in anti-phase to the photospheric brightness. This strongly suggests that plage-like chromospheric emission regions on BO Mic’s surface are associated with active regions, hence with dark spots.
The observed Ca H&K line cores show pronounced and strongly variable deformations. Due to the large of BO Mic, these deformations can be assigned quite precise radial velocities in the Doppler-broadened profiles. As a result, they can be associated with well-defined emission regions on the stellar surface, assuming that chromospheric flows are slow compared to the rotational velocities.
The line cores vary significantly on timescales down to about 10 minutes. The manifold core profiles indicate a complex distribution of chromospherically active regions on the surface of BO Mic subjected to rapid intrinsic evolution. Several deformations of the time series show a migration through the line profile consistent with rotational modulation, i.e. with emission regions fixed on the surface, moved over the visible stellar disk by rotation.
Using the Ca K core profile deformations to localize strong chromospheric emission regions on BO Mic’s surface does not lead to a straightforward identification with pronounced features of our photospheric Doppler images. We believe that this is due to the complex surface distribution of the emission regions, making a Doppler imaging analysis of the Ca H&K line profiles necessary. We are confident that a further analysis of our observations will lead to a chromospheric Doppler image of BO Mic.
Acknowledgements.
U.W. acknowledges financial support from Deutsche Forschungsgemeinschaft, DFG - SCHM 1032/21-1.References
- Baliunas et al., (1998) Baliunas S.L., Donahue R.A., Soon W.A., Henry G.W., 1998, in ASP Conf. Ser. Vol. 154, p. 153
- Bromage et al., (1992) Bromage G.E., Jeffries R.D., Innis J.L., et al., 1992, ASP Conf. Ser., Vol. 26, 80
- Busa et al., (1999) Busa I., Pagano I., Rodono M., Neff J.E., Lanzafame A.C., 1999, A&A, 350, 571
- Char et al., (1993) Char S., Foing B.H., Beckman J., Garcia Lopez R.J., Rebolo R., 1993, A&A, 276, 78
- Cutispoto et al., (1997) Cutispoto G., Kürster M., Pagano I., Rodono M., 1997, Information Bulletin on Variable Stars, 4419, 1
- Eberhard & Schwarzschild, (1913) Eberhard G., Schwarzschild K., 1913, ApJ, 38, 292
- Gray, (1992) Gray D.F., 1992, The observation and analysis of stellar photospheres, Cambridge Univ. Press, Cambridge
- Linsky et al., (1979) Linsky J.L., Worden S.P., McClintock W., Robertson R.M., 1979, ApJS, 41, 47
- Neff et al., (1989) Neff J.E., Walter F.M., Rodono M., Linsky J.L., 1989, A&A, 215, 79
- Pasquini et al., (1988) Pasquini L., Pallavicini R., Pakull M., 1988, A&A, 191, 253
- Vaughan et al., (1981) Vaughan A. H., Preston G.W., Baliunas S.L., et al., 1981, ApJ, 250, 276
- WSW, (2005) Wolter U., Schmitt J.H.M.M., van Wyk F., 2005, A&A, in press