Thermal and non-thermal nature of the soft excess emission from Sérsic 159-03 observed with XMM-Newton
Abstract
Several nearby clusters exhibit an excess of soft X-ray radiation which cannot be attributed to the hot virialized intra-cluster medium. There is no consensus to date on the origin of the excess emission: it could be either of thermal origin, or due to an inverse Compton scattering of the cosmic microwave background. Using high resolution XMM-Newton data of Sérsic 159-03 we first show that strong soft excess emission is detected out to a radial distance of 0.9 Mpc. The data are interpreted using the two viable models available, i.e., by invoking a warm reservoir of thermal gas, or relativistic electrons which are part of a cosmic ray population. The thermal interpretation of the excess emission, slightly favored by the goodness-of-fit analysis, indicates that the warm gas responsible for the emission is high in mass and low in metallicity.
1 Introduction
Galaxy clusters often feature an excess of soft X-ray radiation above the contribution from the hot intra-cluster medium (ICM), known as the cluster soft excess phenomenon. Among the clusters that display this phenomenon is Sérsic 159-03, whose soft excess was initially discovered from ROSAT PSPC data by Bonamente, Lieu and Mittaz (2001), and later confirmed by an earlier XMM-Newton observation of Kaastra et al. (2003); the Sérsic 159-03 excess is one of the strongest observed to date. In this paper we analyze a deep (122 ks) XMM-Newton observation of this cluster. This is the highest S/N observation of a soft excess cluster to date, and we use for the first time these data to confirm the earlier detections and to determine the presence and characteristics of the soft excess. In a companion paper (Mittaz, Lieu and Bonamente 2005) we use the XMM-Newton data of this and other clusters to investigate the presence of OVII lines associated with the soft excess.
The origin of the soft excess emission in galaxy clusters is yet uncertain. There is incresing evidence in favor of a thermal origin of the soft excess, especially since the report of OVII emission lines associated with the soft emission of a few clusters observed by XMM-Newton (Kaastra et al. 2003). A non-thermal origin of the phenomenon is also possible, which requires a widespread presence of relativistic electrons that scatter the cosmic microwave background (Hwang et al. 1997; Sarazin and Lieu 1998; Lieu et al. 1999; Bonamente, Lieu and Mittaz 2001).
This paper is structured in the following way. In section 2 we describe the XMM-Newton data of Sérsic 159-03, with emphasis on the performance of the low-energy (E2 keV) response of the EPIC instruments. For this purpose we also analyze an XMM-Newton observation of PKS 2155-304, which we use as a calibration target. In section 3 we establish the presence of the soft excess emission in our XMM-Newton data, and provide the thermal and non-thermal modelling. In sections 4 and 5 we discuss the physical interpretation of the thermal and non-thermal models, comparing our results with the large scale simulations of Cen and Ostriker (1999) and of Cheng et al. (2004). In section 6 we summarize our results, and indicate that the thermal scenario is the favorite interpretation of these data. Finally, in section 7 we compare our results with earlier works on Sérsic 159-03.
Throughout the paper we assume a Hubble constant of km s-1 Mpc-1, and an , and =0.05 cosmology. At the source’s redshift of z=0.058, 1 arcmin corresponds to 72 kpc. All quoted uncertainties are 90% confidence, unless otherwise specified.
2 XMM-Newton data of Sérsic 159-03
2.1 Data and data reduction
Sérsic 159-03 was observed by XMM-Newton on Nov. 20-21, 2002 for 122 ks, observation ID was 0147800101. The observation collected data with the EPIC imaging spectrometers (MOS1, MOS2 and pn) featuring the thin filter.
The data was reduced using the SAS software provided by the XMM-Newton team, following the standard procedure: the EPIC pipelines were run on the raw data, in order to apply the most current calibration information, available through the CCF files also provided by the XMM-Newton calibration team. For the MOS detectors (MOS1 and MOS2), events were selected having pattern12 and flag=0. For pn, we selected events with pattern=0 and flag=0. This is the same selection as in Kaastra et al. (2003).
2.2 Time-variable particle background
The EPIC background comprises a variable component due to soft protons, which is sometimes enhanced by orders of magnitude over the quiescent rate. The energy band above 10 keV is dominated by this radiation, and can therefore be used to monitor the presence of such particle background ‘flares’ (e.g., Arnaud et al. 2001; Lumb et al. 2002; Nevalainen et al. 2003).
We extract light curves of our Sérsic 159-03 observation at energies 9.5 keV (MOS) and 10 keV (pn), and discard those time intervals where the count rate exceeds the quiescent count rate. The threshold levels for rejection were set to respectively 108 and 112 counts (500 s)-1 for MOS1 and MOS2, and 168 counts (500 s)-1 for pn, similar to the levels of Kaastra et al. (2003). This reduction process leaves respectively 69 ks, 67 ks and 64 ks of clean data for MOS1, MOS2 and pn.
2.3 Background subtraction
We use the background event files provided by the XMM-Newton Science Operation Center for the purpose of background subtraction (Lumb et al. 2002). This is a collection of 8 blank-sky fields at high Galactic latitude, which we filtered with the same criteria as the cluster field. In so doing, we ensure that the soft proton background (see section 2.2) is correctly subtracted. The cosmic X-ray background, however, is the dominant background component at the low energies (E1 keV) where the cluster soft excess radiation is present. This photonic component of the background features sky variations (% at keV: Snowden et al. 1998; Kaastra et al. 2003), which need to be accounted for when establishing the presence of the soft excess emission.
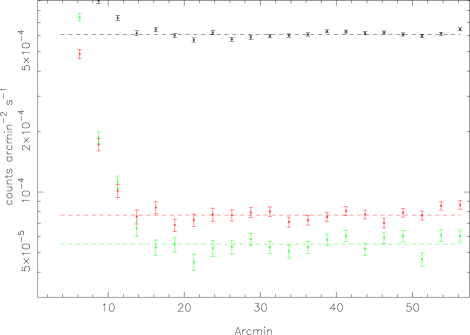
The XMM-Newton detectors cover an area of 14 arcmin radius ( 1 Mpc) and therefore cannot investigate the cosmic X-ray background in the neighborhood of Sérsic 159-03. For this purpose, we analyze a ROSAT pointed observation of the cluster, covering an area of 1 degree radius ( 4.3 Mpc). This is the same observation in which we initially discovered the soft excess emission of Sérsic 159-03 (Bonamente, Lieu and Mittaz 2001). The radial profiles of the X-ray emission in the R2, R4 and R7 bands, respectively 0.25 keV, 0.75 keV and 1.5 keV, are shown in Figure 1. It clearly shows that the R2, R4 and R7 band surface brightness profile reaches a constant value at 12 arcmin radius from the cluster’s center. The emission in all PSPC bands maintains a constant level of emission out to the limiting radius of the PSPC detector.
On larger scales, a low-resolution measurement of the local soft X-ray background is available through the ROSAT All-Sky Survey maps (Snowden et al. 1998). We obtain RASS images around Sérsic 159-03 and around the 8 pointings that constitute the XMM-Newton background through the NASA Skyview facility. We use the R12 and R45 band images 111RASS bands R12 and R45 are similar to bands R2 and R4 of the pointed ROSAT data. that cover the 1 keV band where the soft excess is strongest, and observe that the 10 degree region around Sérsic 159-03 features a soft X-ray background 20% higher than that of the Lumb et al. (2002) background fields in both R12 and R45 band (Table 1), and no indication of a spatial gradient in the R12 and R45 band emission. The 0-1 degree region is clearly affected by the diffuse cluster emission, which is included in the RASS maps.
| Field | 0-1 deg. | 1-2 deg. | 2-5 deg. | 5-10 deg. |
|---|---|---|---|---|
| R12 | ||||
| Sérsic 159-03 | 1.09 | 0.99 | 0.99 | 1.02 |
| Background | 0.81 | 0.79 | 0.77 | 0.78 |
| Avg. back. | 0.79 | |||
| R45 | ||||
| Sérsic 159-03 | 0.18 | 0.14 | 0.13 | 0.13 |
| Background | 0.11 | 0.11 | 0.12 | 0.11 |
| Avg. back. | 0.11 | |||
Note. — Fluxes are in units of counts s-1 arcmin-2. The resolution of the RASS maps are 40 arcmin, so that the central 1 degree region of the Sérsic 159-03 observation is affected by the hot ICM emission.
The analysis of the ROSAT data around Sérsic 159-03 indicates that the cluster’s soft emission reaches the background level at a distance of 12 arcmin from the cluster’s center. The available data cannot determine the nature of the 20% enhancement of the background near Sérsic 159-03, with respect to the background fields of Lumb et al. (2002). For that purpose, spectroscopic observations with few eV resolution are needed that measure the redshift of the background emission. Such resolution will become available with ASTRO-E2. The enhancement is likely of local (Galactic) origin, although large-scale emission at the cluster’s redshift cannot be ruled out.
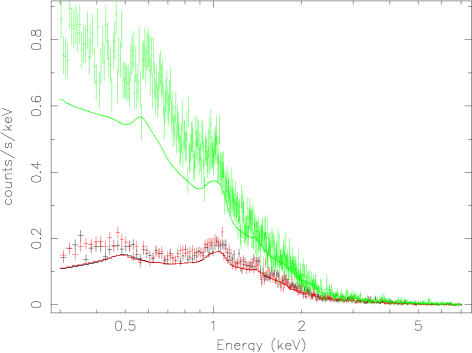
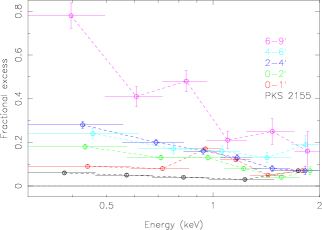
In this paper we follow a conservative approach, and assume that the enhancement in the background is entirely of local origin. We therefore use the 12-14 arcmin XMM-Newton data to model this background enhancement, and subtract this additional background component from the Sérsic 159-03 spectra. This method is equivalent to that of Mittaz, Lieu and Bonamente (2005), in which we use XMM-Newton data to investigate in more detail the presence of OVII and OVIII emission lines in the soft excess spectra of a few galaxy clusters, including Sérsic 159-03. Kaastra et al. (2003) followed a different approach, and opted to use the background fields of Lumb et al. (2002) with the addition of a systematic error in an effort to account for possible variations of the soft X-ray background. Our choice of using the 12-14 arcmin region to estimate the local soft X-ray background results in no detection of OVII emission lines from Sérsic 159-03. This conclusion is evident in the 4-6 arcmin spectrum of Sérsic 159-03 (Figure 2), which shows no evidence of an emission feature at keV. Similar results apply to the 6-9 and 9-12 arcmin annuli. Further details on the presence of emission lines associated with the soft excess can be found in Mittaz, Lieu and Bonamente (2005).
2.4 Assessment of EPIC’s soft X-ray calibration
We limit our analysis to the 0.3-7 keV energy range, where the accuracy of the EPIC effective area calibration is 10 % (Kirsch 2004). We assess directly the soft calibration of the EPIC detectors through the analysis of the XMM-Newton observation of PKS 2155-304, a bright BL Lac source observed with the thin filter for 58.5 ks (observation ID 0080940301). The observation, reduced following the same steps as the cluster observation, features respectively 24 ks and 33 ks of useful MOS2 and pn data (MOS1 was used in timing mode). This observation was affected by event pile-up near the detector aimpoint position. In order to eliminate this unwanted effect, our spectra were extracted from an annular region that excludes the aimpoint. This choice renders our data free of pile-up events.
BL Lac objects are variable, and their X-ray spectra are generally well fit by power-law models (e.g., Ravasio et al. 2002; Wolter et al. 1998). A spectral break is sometimes needed to account for spectral curvature (e.g., Perri et al. 2003; Chiappetti et al. 1999).
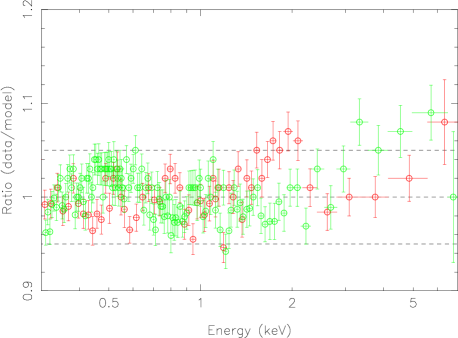
We fit the PKS 2155-304 data in the same way in which we will subsequently fit the cluster data. We fit jointly the MOS and pn spectra, after ascertaining that the individual spectra are consistent with one another. Spectra were binned with a minimum of 25 counts per channel. First, we fit the full 0.3-7 keV range with an absorbed power-law model, fixing the column density at the Galactic value of 1.36 cm-2 (Dickey and Lockman 1990). The model fits the data well, and the low energy residuals are 5% (Fig. 3(a)). We then fit the same model to the 2-7 keV data. In Table 2 we show the results of the fits: the two fitting methods yield consistent results, indicating that the source follows a simple power law in the selected energy range, as already known from a previous study (Kaastra et al. 2003). 222A broken power law model provides no improvement to the 0.7-7 keV fit of our spectrum, providing further indication that the spectrum is well described by a single power law. Even in those epochs when the source could not be fit by a simple power law model, e.g., in the BeppoSAX observation of Giommi et al. (1998), the residuals from the best-fit single power law model did not exceed 20% in the entire 0.7-7 keV band, and were 10% in the softest X-ray channels (0.3-1 keV).
| Norm. MOS2 | Norm. pn | (dof) | |
|---|---|---|---|
| 0.3-7 keV fit | |||
| 2.7930.004 | 0.03410.0001 | 0.02480.0001 | 1.23(1085) |
| 2-7 keV fit | |||
| 2.7600.030 | 0.0330.001 | 0.0240.001 | 1.03(626) |
Note: The normalization constant of the power-law model is in the XSPEC customary units.
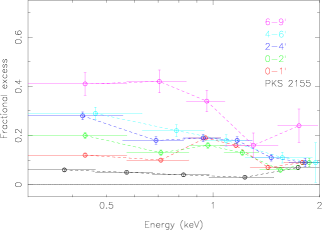
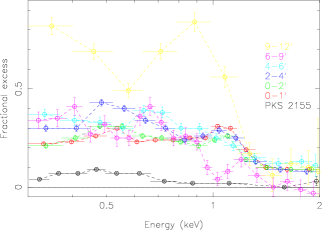
We now extrapolate the best-fit 2-7 keV model down to 0.3 keV, in order to investigate the low-energy residuals. The average residuals in the 0.3-1 keV band are respectively +5% and +6% for MOS2 and pn, as shown in Figure 3(b), with deviations of less than 10%. We therefore conclude that the level of systematic uncertainties of the EPIC detectors at keV is less than 10%, and that cluster soft excess fluxes in this band are real when they exceed that figure. A steep power-law model like that of PKS 2155-304 exaggerates any positive low energy residuals relative to a thermal cluster spectrum, thereby providing a conservative test of the low-energy calibration. A difference by a few % in the 0.3-1 keV soft excess fluxes of MOS and pn is also within the calibration uncertainties.
Alternatively, we fit the 0.3-7 keV spectra with a power-law model of variable absorbing column. The resulting power-law index is consistent with the numbers of Table 2, and the best-fit column density is consistent with the Galactic value. This result indicates that the apparent deficit in the absorbing column seen in this cluster (section 3.2) and in others (Kaastra et al. 2003) is not an artifact due to calibration uncertainties, but is the results of a genuine excess of soft photons.
3 Presence of soft X-ray excess emission in the EPIC data of Sérsic 159-03
3.1 Spectral extraction and fitting
We extracted spectra in 8 annuli of outer radii 1, 2, 3, 4, 6, 9, 12 and 14 arcmin. We use the outermost annulus (12-14 arcmin) only for the purpose of obtaining a model of the local soft X-ray background, as described in section 2.3. Spectra were extracted in 15 eV bin, and then rebinned to ensure that at least 25 counts were present in each bin. We used the XSPEC software for the spectral analysis, the optically thin thermal model was MEKAL, and the Galactic absorption cross sections those of Morrison and McCammon (1983) 333 See Bonamente, Lieu and Mittaz (2001) for discussion on the available cross section compilations.. The absorption column was fixed at the Galactic value ( cm-2; Dickey and Lockman 1990), except in one case explicitly discussed in section 3.2. We fit jointly the MOS1, MOS2 and pn spectra, enforcing the same normalization constants between the MOS1 and MOS2 spectra, and allowing the pn spectrum to have a separate normalization. We use the 0.3-7 keV energy range in the spectral fitting.
3.2 Simple models of the Sérsic 159-03 spectra
3.2.1 1-temperature model with central ‘cooling’ gas
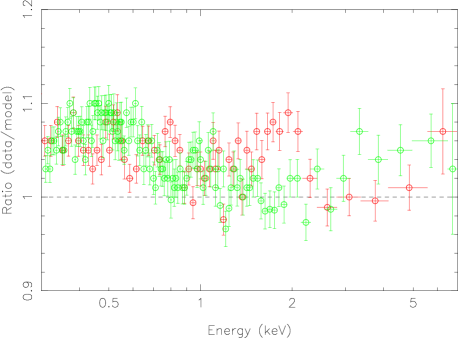
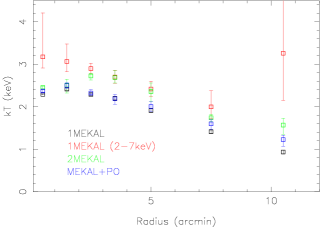
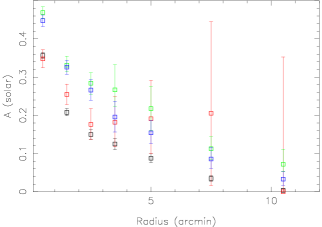
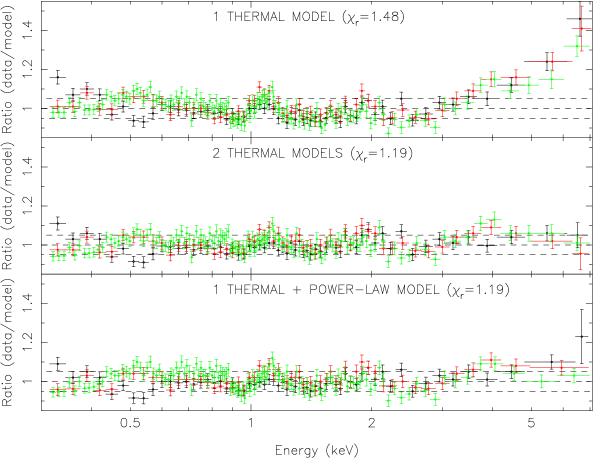
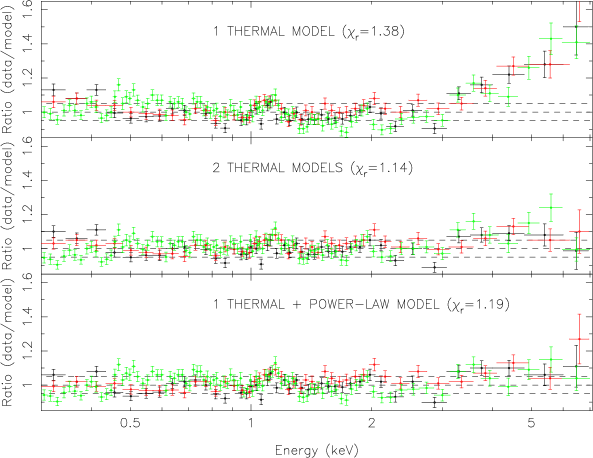
First, we attempt to fit the 0.3-7 keV spectra with a simple thermal model. The innermost regions of Sérsic 159-03 host cooler gas, due to the cooling of the hot ICM. Earlier XMM-Newton observations (Kaastra et al. 2001; Kaastra et al. 2004a; Peterson et al. 2003) revealed that the cooler gas in Sérsic 159-03 is confined to the central 2 arcmin. We account for this cooler gas as in Kaastra et al. (2003), i.e., by adding a second phase at 1/2 the temperature of the hot ICM in the innermost two annuli (0-1 and 1-2 arcmin radius). This simple model fails to describe the data accurately and results in very steep temperature and abundance gradients (see Figure 4). A steep temperature profile was also found in an earlier XMM-Newton observation of Sérsic 159-03 by Kaastra et al. (2001), where the spectra were fitted to a similar 1-temperature model. In Figure 5(a) and 6(a) we show the residuals from the best-fit 1-temperature model for two representative annuli. The residuals exceed the 5% level seen in the case of the calibration target PKS 2155-304 (Figure 3) and follow large-scale trends such as a negative deviations between 1.2 and 3 keV and positive deviations at low and high energies, especially evident in the higher quality pn data (green in Figures 5 and 6). This behavior indicates the need for an additional spectral component, as will be discussed in section 3.3.
Alternatively, we tried to account for cooler gas in the central regions using a classical cooling flow model, and fitted the 0.3-7 keV spectra of the inner annuli with a 1-temperature thermal model plus a cooling flow model. The fits are not acceptable and of same goodness-of-fit as those obtained using the 1-temperature thermal model plus the additional phase at 1/2 the temperature described above in this section.
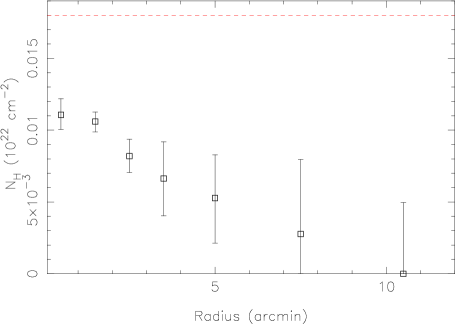
3.2.2 1-temperature model with central ‘cooling’ gas and with variable
We investigate the possibility of modelling the Sérsic 159-03 spectra with the same 1-temperature thermal model of section 3.2.1, with the absorption column density as a free parameter. Although the best-fit statistic improves, the fit is physically unacceptable, as the best-fit absorption column is significantly sub-Galactic (Figure 7). The best-fit is consistent with null Galactic absorption in certain annuli. A similar result was found in the data of the Coma cluster (Bonamente, Joy and Lieu 2003) and of several other clusters observed by Kaastra et al. (2003), and is indicative of an excess of soft X-ray radiation with respect to this simple 1-temperature hot ICM model.
3.2.3 1-temperature model fitted to the 2-7 keV band
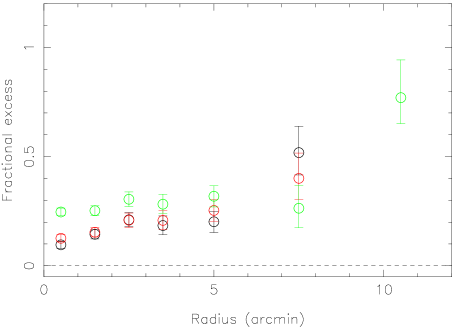
Next, we discard the low-energy portion of the spectra (E2 keV) from the fit, and fit the 2-7 keV data to the simple 1-temperature thermal model. In this case, we are no longer sensitive to the presence of the central ‘cooling’ gas, and we drop the additional thermal model (at 1/2 the temperature of the hot plasma) from the 0-1 and 1-2 arcmin annuli. The results are now statistically acceptable, and the radial profiles of temperature and abundance are less steep than in the case of the 0.3-7 keV fit above (Figure 4). In order to assess the presence of the soft excess emission, we extrapolate this best-fit hot ICM model at lower energies in the same way as we did for the calibration source PKS 2155-304. Strong soft excess emission is found in all annuli, as shown in Figure 2 for the 4-6 arcmin region. In Figures 8 and 9 we show the fractional excess in the 0.3-1 keV band, defined as , where is the observed soft flux, and is the prediction from the hot ICM model. The soft excess exceeds the level of the calibration uncertainties (see section 2.4) and it is therefore due to a genuine excess of soft X-ray radiation with respect to the 2-7 keV thermal model. It is important to stress that this model is not used to measure the soft excess flux, but only to establish the presence of an excess emission at low energy that cannot be attributed to calibration uncertainties. Soft excess fluxes will be measured by the models of section 3.3. In fitting the 2-7 keV band alone we have ignored the Fe-L complex, which is an important temperature diagnostic of the X-ray spectra. This model is also presented for the sake of comparison with earlier results, e.g., those of Nevalainen et al. (2003), where the authors fit the 2-7 keV XMM-Newton spectra of A3112, A1795 and Coma and find a fractional excess % (see Figures 4 and 5 of Nevalainen et al. 2003).
3.3 More complex models of the Sérsic 159-03 spectra
Having established the presence of an extra soft component in the XMM-Newton spectra of Sérsic 159-03, we employ an additional component in the spectral fitting in order to account for the excess emission.
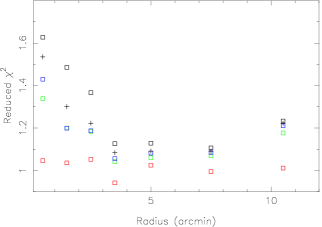
3.3.1 2-temperature model with central ‘cooling’ gas
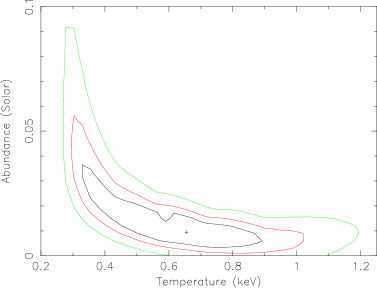
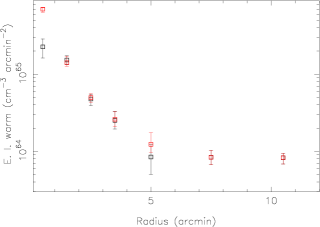
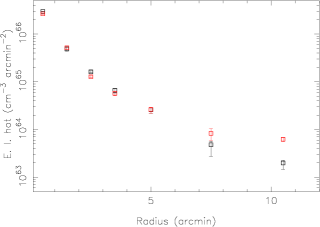
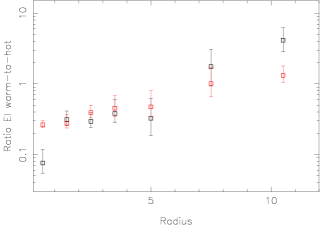
First, we consider a 2-temperature model where both the hot ICM temperature and the warm gas temperature are free parameters. In the innermost two annuli the hot thermal component features a sub-component, as described in section 3.2.1. This model constitutes a significant statistical improvement over the simple 1-temperature model (see Figure 4). The residuals of the 2-temperature model are now consistent with the level of the calibration uncertainties, and are shown in Figures 5(b) and 6(b) for two representative annuli. The additional thermal component features a temperature of 0.2-0.8 keV and abundances of 0.1 solar (Figure 10). The abundance and temperature of the warm phase are correlated parameters. In Figure 11 we show the contour plot of the two parameters for the region 4-6 arcmin, showing how the XMM-Newton data can constrain the physical properties of the warm plasma model. Similar results apply to the other regions. It is also clear, from the radial distribution of the emission integral () of the two phases, that the warm phase dominates at large radii, where the hot ICM emission becomes weak (Figure 12).
3.3.2 1-temperature model with central ‘cooling’ gas plus power-law model
We then consider a 1-temperature model plus a power-law component. This model is again an improvement over the simple 1-temperature model, and the fit statistic indicates that the 2-temperature model is only marginally preferred to this non-thermal model (Figure 4). The residuals of this non-thermal model are shown in Figures 5(c) and 6(c) for two representative annuli. In Figure 13 we show the radial profiles of the power-law index of the power-law component.
4 Thermal interpretation of the soft excess emission
The 2-temperature model of section 3.3.1 provides the most satisfactory fit to the 0.3-7 keV spectra. In the following we provide the physical interpretation of the thermal modelling of the soft excess emission discussing two possible scenarios.
4.1 Clumpy warm intra-cluster gas à la Cheng et al. (2005)
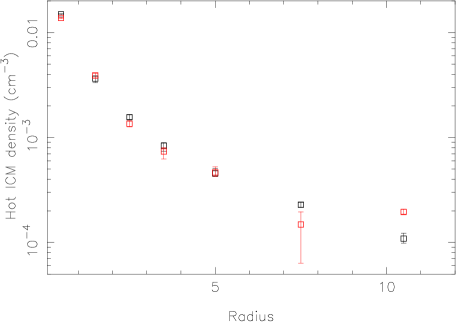
The warm gas responsible for the soft excess may be in a high-density ( cm-3) and clumpy intra-cluster phase with volume filling factor . This is the scenario that results from the simulations of Cheng et al. (2005), in which a small fraction of the intra-cluster gas remains at low temperature and high density during the accretion process. This phase of the intra-cluster medium is able to reproduce quantitatively the typical soft excess emission detected in several clusters (e.g., Bonamente et al. 2002). We provide an estimate of the warm gas mass assuming that the warm gas is in pressure equilibrium with the hot gas. First, we deproject the emission integral of the hot phase (Figure 12) to obtain the hot gas density (Figure 14). Our results for the hot gas density are in very good agreement with those from an earlier XMM-Newton observation by Kaastra et al. (2001). The warm gas density is then calculated assuming pressure equilibrium, , and it is in the cm-3 range. Using the measured emission integral of the warm phase, defined as , we estimate the volume filling factor and hence the warm gas mass. The volume filling factor is of a few percent () and the total warm gas mass is M⊙ ( M⊙ from MOS and M⊙ from pn data). For comparison, the hot gas mass is ( from MOS and from pn data). Reiprich and Boheringer (2002) measure a total gravitational mass of out to the same radius of our analysis (0.9 Mpc), resulting in a gas mass fraction of . If the excess emission follows the simple model presented in this section, the warm gas will contribute to an additional 25% of the total baryonic mass. The cooling time of the warm gas is shorter than the Hubble time at all radii, and the replenishment of the warm gas becomes a dynamical phenomenon.
For comparison with the soft excess of the Coma cluster (Bonamente, Joy and Lieu 2003) we also estimate the warm gas mass in the case of an intra-cluster phase with volume filling factor . In this case, the warm gas would not be in pressure equilibrium with the hot gas and it would have a total mass of ( from MOS and from pn data). This result is similar to that of Coma, where and warm gas yielded (Bonamente, Joy and Lieu 2003).
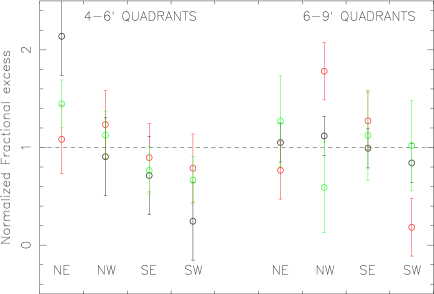
If the soft excess emission is indeed clumpy as described by the Cheng et al. (2005) model, significant azimuthal variations of the excess could be present. In order to test the presence of azimuthal variations of the soft emitter, we divided the two annuli with the highest quality data (4-6 and 6-9 arcmin) into quadrants, and applied to them the analysis described in section 3.2.3 to measure the fractional excess in the 0.3-1 keV band. In Figure 15 we plot the fractional excess detected in each quadrant, normalized by the average fractional excess in that annulus. At the resolution of our XMM-Newton data we cannot detect statistically significant azimuthal variations, although deviations at the level of 50% of the average are allowed by the data. A similar study of azimuthal variations of the soft excess in Coma also yielded inconclusive results (Bonamente, Joy and Lieu 2003).
4.2 Warm intergalactic gas à la Cen and Ostriker (1999)
Alternatively, the warm gas may be located in a diffuse halo or filaments around the cluster, not in direct contact with the hot ICM and extending beyond the cluster’s virial radius.
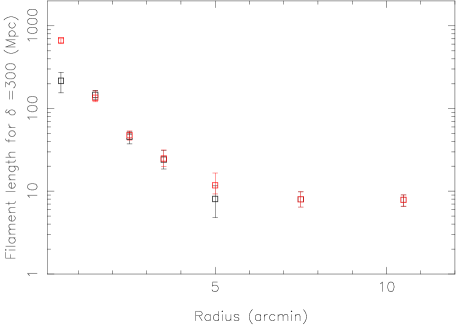
We assume that the detected warm emission resides in filaments of constant density . In this case, the emission integral of each annulus becomes
| (1) |
where is the volume of the filament, is the area of each annulus, and is the length of the filament along the line of sight. From the measured emission integral we cannot, at the same time, determine the density and the length of the filament. If we assume that cm-3, corresponding to a baryon overdensity of , we can measure the filament lenght and mass implied by this model. The filaments would be as long as an improbable few hundred Mpc (Figure 16), and the total filament mass is ( from MOS and from pn data), resulting in a filament-to-hot gas mass ratio of ( from MOS data and from pn data). If the filaments are less dense, then the length and mass estimates would increase; in fact, , and for a given emission integral . These results are again similar to those of the Coma cluster, where 3 (Bonamente, Joy and Lieu 2003). Similar models for the excess emission based on a diffuse halo of warm gas were described in Kaastra et al. (2004b) and Lieu and Mittaz (2004). One can derive similar results for the filament mass of this scenario assuming that the filaments have a given size, instead of a given density as assumed above. In this case, the large emission integral of the warm gas measured at small radii (Figure 12) implies denser filaments towards the central cluster regions.
Mittaz et al. (2004) investigated whether the soft excess emission could be quantitatively explained by the large-scale filaments seen in the simulations of Cen and Ostriker (1999), Cen et al. (2001) and Davé et al. (2001). The emission from filaments around the simulated clusters was a few orders of magnitude below the level needed to explain the typical soft excess emission as, e.g., that of Sérsic 159-03. We therefore alert the reader that those simulations are not in quantitative agreement with the soft excess measured in Sérsic 159-03 and in other clusters.
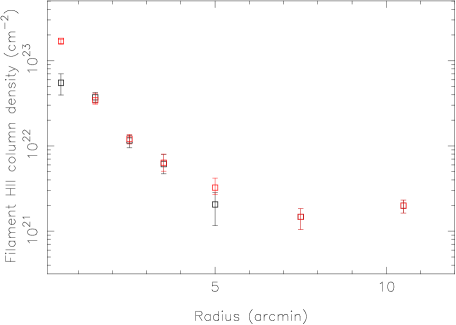
Other simulations by Fang et al. (2002) also find that a large fraction of baryons is in a warm filamentary phase of the intergalactic medium. If the excess emission of Sérsic 159-03 is due to the filaments model described in this section, the excess implies HII column densities cm-2, as shown in Figure 17. The associated OVII and OVIII column density depends on the exact ionization structure of the gas: assuming a ionization fraction of , valid for a gas in collisional equilibrium at keV (e.g., Fang et al. 2002), and an average metal abundance of 5% solar (see section 3.3), the OVII and OVIII column densities implied by the excess emission of Sérsic 159-03 exceed cm-2. 444This calculation assumes an oxygen abundance of relative to the hydrogen number density, and oscillator frequencies of 0.696 and 0.416 for the OVII and OVIII absorption lines (e.g., Fang et al. 2002). This result is qualitatively consistent only with the brightest regions of the Fang et al. (2002) simulations (see Figures 4 and 5 of Fang et al. 2002).
4.3 Discussion of thermal interpretation
The first thermal scenario (section and 4.1) is preferred to the second (section 4.2), given that the calculations of Mittaz et al. (2004) show no quantitative agreement between the measured soft excess and the simulation predictions. In the case of a clumpy intra-cluster gas à la Cheng et al. (2005) a shorter-than-Hubble cooling time is a inherent feature of the model, and the soft excess emission is a dynamical phenomenon. The filaments à la Cen and Ostriker (1999) discussed in section 4.2 would be as long as several 100 Mpc, or even in excess of 1 Gpc if the filaments are less dense than cm-3, in disagreement with the current observational and theoretical understanding of large-scale structures.
The total baryon content of clusters is a useful probe of cosmology. The thermal interpretation of the soft excess implies a warm gas mass that may be comparable to that of the hot ICM, and therefore significant when evaluating the baryon mass in clusters. Allen et al. (2004) analyze a sample of clusters at z0.9 and find that the baryonic fraction in that sample is f0.12. In calculating the total baryonic mass, they account for the X-ray emitting hot ICM and the luminous matter, and use a bias factor that accounts for the fact that the baryon fraction in clusters, as seen in simulations (Eke et al. 1998), is lower than for the universe as a whole by about 15%. They give constraints on and that are in agreement with other measurements (SN1a and CMB measurements). The soft excess emission in Sérsic 159-03 and in other clusters (e.g., Bonamente et al. 2002) may be indicative of a massive warm baryonic component in clusters. Given our mass estimates for the warm baryons provided in section 4, we envisage two possibilities that conciliate the thermal origin of the soft excess with the results of Allen et al. (2004): the warm baryons have a mass of 15% of the hot gas mass or the warm gas, being in structures that are not virialized (e.g., the model in section 4.2), should not be counted as ”cluster” baryons.
5 Non-thermal interpretation of the soft excess emission
Alternatively, the excess emission may be of non-thermal nature. In this section we investigate the physical interpretation of the non-thermal modelling of section 3.3.
5.1 IC scattering of relativistic e- off the CMB
A population of relativistic electrons in the cluster would scatter the cosmic microwave background (CMB), and give rise to soft X-ray radiation via an inverse Compton scattering (e.g., Huang 1997; Sarazin and Lieu 1998; Lieu et al. 1999). A relativistic electron with a Lorentz factor will up-scatter a CMB photon to an energy of
| (2) |
Electrons with are needed to generate soft excess photons in the 0.3-2 keV band.
Relativistic electrons in clusters may be generated by diffusive shock acceleration. The acceleration produces a power-law distributed population of electrons which, upon scattering with the CMB photons, creates power-law radiation spectrum (Ribicki and Lightman 1979). The relationship between the two power-law indices is
| (3) |
where is index of the differential number electron distribution, and is the differential photon number index. For Galactic cosmic ray electrons it is typically observed an index , corresponding to . Relativistic electrons undergo Coulomb losses at low-energies and radiative losses at higher energies. In the regime (where is the electron Lorents factor) and for typical cluster conditions, radiative losses will steepen the electron spectrum in a few years since acceleration (Lieu et al. 1999; Ip and Axford 1985). The results of Figure 13 show a power-law index 2. This indicates that, if the soft excess is of cosmic ray origin, the electron population was injected in the cluster environment a few years ago.
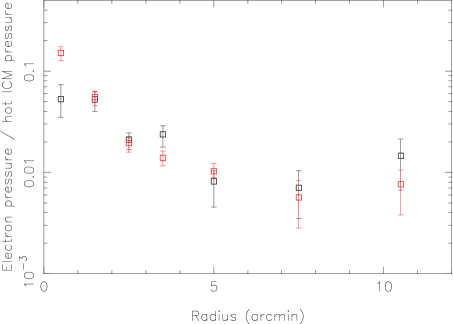
The modelling of section 3.3 yields the luminosity of the power-law component which can then be used to determine the energy of the underlying electron population (Lieu et al. 1999), via
| (4) |
where is the luminosity of the non-thermal radiation in units of erg s-1, and the Lorentz factors corresponding to the boundaries of the XMM-Newton data (0.3-7 keV). From this, one can calculate the electron pressure () and compare it with the hot ICM pressure. The resuls are shown in Figure 18, which indicate that the non-thermal electron pressure is a few % of the thermal pressure at all radii.
5.2 Discussion of the non-thermal interpretation
If the soft excess is of non-thermal nature, relativistic electrons must be present throughout the central 1 Mpc radius of Sérsic 159-03. The cluster has no known signature of non-thermal activity (e.g., no detected radio halo or strong radio sources). It is possible, however, that non-thermal activity may have occurred in the past. The steeper-than-Galactic power law indices indicate an aging of the non-thermal population.
The presence of relativistic particles at a distance of 1 Mpc from the cluster center is challenging. In fact, the Bohm diffusion time for relativistic electrons exceeds a Hubble time in the typical cluster environment (Volk, Aharonian and Breitschwerdt 1996). The widespread presence of relativistic particles would require several sites of local acceleration, or alternative means of transport from the acceleration site to Mpc distances. The acceleration could be provided by several shocks (e.g., accretion shocks) or, alternatively, AGN jets, of which we have no evidence at present. Diffuse shocks accelerate ions as well as electrons (Bell 1978a,b; Axford, Leer and Skadron 1977; Blandford and Ostriker 1978). The ions, due to the higher mass, do not emit effectively, but will carry the bulk of the energy, exceeding the electron energy by a factor of . This in turn implies that the estimates of Figure 18 will have to be increased by the same factor, with the relativistic particles now in approximate energy equipartition with the hot ICM pressure. This result was already noted in the Coma cluster (Lieu et al. 1999) and in our previous study of Sérsic 159-03 with ROSAT data (Bonamente, Lieu and Mittaz 2001). With the current XMM-Newton data we have provided more precise estimates of the non-thermal pressure in Sérsic 159-03. The presence of relativistic ions can only be avoided if the electrons are accelerated by an alternative means that do not accelerate the ions, such as AGN electron/positron jets.
6 Origin of the soft excess emission of Sérsic 159-03
The soft excess emission of Sérsic 159-03 is of genuine celestial origin. Knowledge of the XMM-Newton detectors and direct use of the calibration source PKS 2155-304 (section 2.4) showed that the emission is not a detector artifact. Moreover, the emission cannot be caused by wrong assumptions on the HI Galactic absorbing column. In order to explain the excess emission, the Galactic column density is required to be more than two times lower than the measured Galactic value ( cm-2) and even lower than the Lockman Hole value ( cm-2) for certain annuli. Bregman et al. (2003) showed that anisotropies in the distribution of the HI column density towards galaxy clusters may affect the transmission of extragalactic soft X-ray radiation. Such effect, however, is only relevant at energies keV (e.g., Figures 1 and 9 of Bregman et al. 2003), and it has no influence on the soft excess detected in this paper at keV with the XMM-Newton detectors.
The thermal and non-thermal models examined in this paper constrain the nature of the soft excess emission from Sérsic 159-03. The formal goodness-of-fit statistic does not provide a definitive indication of the origin of the soft emission. The thermal scenario is only marginally favored over the non-thermal (Figure 4), similarly to the case of the Coma cluster (Bonamente, Joy and Lieu 2003). The large extent of the detected excess emission ( 1 Mpc radius) renders unlikely a purely non-thermal interpretation of the excess, due to the long diffusion times of relativistic particles which cannot easily diffuse throughout the entire cluster volume (see section 5).
The XMM-Newton data of Sérsic 159-03 indicate that warm gas located within the virial radius provides the bulk of the soft excess radiation. The gas may be in a clumpy phase of the ICM (section 4.1) as advocated by the simulations of Cheng et al. (2004), with a mass of 25% of the hot gas mass. Although we do not confirm the direct detection of OVII and OVIII emission lines associated with the excess emission, the warm gas emission is consistent with a metal abundance of a few % solar. The soft emission is unlikely to originate from large-scale filaments à la Cen and Ostriker (1999), which would encompass a total mass in excess of that of the hot ICM.
It is possible that a fraction of the soft excess, especially in the central regions, is of non-thermal nature (section 5). Although there is no evidence at present of non-thermal activity in Sérsic 159-03, past AGN or diffusive shock acceleration may have fostered the presence of relativistic electrons in the cluster environment. Our calculations show that the relativistic particles would be near or below pressure equipartition with the hot gas.
7 Comparison with earlier observations of Sérsic 159-03
The initial report of soft excess in Sérsic 159-03 was based on low resolution ROSAT PSPC data (Bonamente, Lieu and Mittaz 2001). The ROSAT data were able to detect soft excess emission out to a radius of 9 arcmin. The mass estimates for the warm intra-cluster gas model had significantly larger errors, but are in agreement with the present XMM-Newton results. The non-thermal fit results based on these earlier data have a power-law index that is significantly higher than that of the present analysis (see Table 2 of Bonamente, Lieu and Mittaz 2001). The reason is likely attributable to the narrower ROSAT band, and it is the cause for the higher non-thermal perssure estimates we obtained based on that observation.
The first XMM-Newton results on Sérsic 159-03 were based on an earlier ks observation, and are described in Kaastra et al. (2001). In that paper no attempt was made to detect or measure the soft excess, but the authors focused on the properties of the hot gas. Our estimates of the hot gas temperature, abundance and density are in good agreement with theirs (see Figures 1–3 of Kaastra et al. 2001).
Kaastra et al. (2003) analyzed the same XMM-Newton observation as Kaastra et al. (2001) in order to investigate the soft excess emission. They report the presence of soft excess emission out to a radius of 12 arcmin, in agreement with our present results. Their thermal and non-thermal models for the excess emission also indicate that the two models have similar goodness of fit in the central regions, in agreement with our present findings. The backround subtraction technique they employ, however, differs from the one used in this paper in that we now use a local background. The different background subtraction is the reason for a variance with our results at large radii, e.g., their detection of OVII emission lines associated with the soft excess emitter is not confirmed in our analysis (see section 2.3).
The same authors provide an estimate of the warm gas mass in Kaastra et al. (2004b), based on the same earlier XMM-Newton observation. Their warm gas estimate follows a model reminiscent of our warm intergalactic filaments à la Cen and Ostriker (1999). They assume a fiducial radius for the volume of the emission and estimate a constant density for the warm gas, and find a warm gas mass of , higher than our corresponding estimate by a factor of 10. The difference can be explained by the simplifying assumptions of their model.
The properties of the central ‘cooling’ gas of Sérsic 159-03 were also studied in detail by Kaastra et al. (2004a). They find that cooling gas is significantly present only at radii 2 arcmin. Our best-fit hot ICM temperatures are again in agreement with those of Kaastra et al. (2004a).
8 Conclusions
In this paper we have analyzed a high S/N XMM-Newton observation of Sérsic 159-03and provided a wide range of models for the soft excess emission. We employed a different method of background subtraction than the earlier XMM-Newton observations of Kaastra et al. (2003) which accounts for spatial variations of the soft X-ray background.
First, we showed that soft excess emission is strongly detected throughout a Mpc radius region, confirming earlier detections based on lower S/N data (Kaastra et al. 2003; Bonamente, Lieu and Mittaz 2001). We ruled out the possibility that the excess emission is caused by peculiarities in the absorbing column of Galactic gas, or that the emission is an artifact of the XMM-Newton detectors.
We then investigated several thermal and non-thermal models in search of the origin of the soft excess emission. The thermal models assume the presence of warm ( K) gas either intermixed with the hot gas, or in diffuse structures extending beyond the cluster virial radius. The non-thermal model requires the widespread presence of relativistic electrons with Lorentz factor .
We calculated the density and mass budget for the thermal models and the pressure budget for the non-thermal model, and concluded that the most likely interpretation for the soft excess emission of Sérsic 159-03 is warm gas located within the virial radius of the cluster, which contributes an additional 25% of the total cluster baryonic mass.
References
- (1) Allen, S. W., Schmidt, R. W., Ebeling, H., Fabian, A. C. and van Speybroeck, L. 2004, MNRAS, 353, 457.
- (2) Axford, W.I., Leer, E. and Skadron, G. 1977, Proc. 15th Int. Cosmic-Ray Conference (Plovdiv), 11, 132.
- (3) Bell, A.R. 1978a, MNRAS, 182, 147.
- (4) Bell, A.R. 1978a, MNRAS, 182, 443.
- (5) Blandford, R.D. and Ostriker, J.P. 1978, A&A, 221, L29.
- (6) Bonamente, M., Lieu, R., Joy, M.K. and Nevalainen, J.H. 2002, ApJ, 576, 688.
- (7) Bonamente, M., Lieu, R. and Mittaz, J.P.D. 2001, ApJ, 561, 63.
- (8) Bonamente, M., Joy, M.K. and Lieu, R. 2003, ApJ, 585, 722.
- (9) Bregman, J.N., Novicki, M.C., Krick, J.E. and Arabadjis, J.S. 2003, ApJ, 597, 399.
- (10) Cen, R. and Ostriker, J.P. 1999, ApJ, 514, L1
- (11) Cen, R., Tripp, T.M., Ostriker, J.P. and Jenkins, E.B. 2001, ApJ, 559,L5
- (12) Cheng, L.-M., Borgani, S., Tozzi, P., Tornatore, L., Diaferio, A., Dolag, K., He, X.-T., Moscardini, L., Murante, G. and Tormen G., 2005, A&A, 431, 405
- (13) Chiappetti, L. et al. 1999, ApJ, 521, 552.
- (14) Davé, R., Cen, R., Ostriker, J.P., Bryan, G.L., Hernquist, L., Katz, N., Weinberg, D.H., Norman, M.L. and O’Shea, B. 2001, ApJ, 552, 473
- (15) Dickey, J.M. and Lockman, F.J. 1990, ARA&A, 28, 215 i
- (16) Eke, V.R., Navarro, J.F. and Frenk, C.S. 1998, ApJ, 503, 569.
- (17) Fang, T., Bryan, G.L. and Canizares, C.R. 2002, ApJ, 564, 604.
- (18) Ferrando, P. et al. 2002, Proceedings of the Symposium ‘New Visions of the X-ray Universe in the XMM-Newton and Chandra era’, Noordwijk, The Netherlands (astro-ph/0202372).
- (19) Giommi, P. et al. 1998, A&A, 333, L5.
- (20) Hwang, C.-Y. 1997, Science, 278, 1917
- (21) Ip, W.-H. and Axford, W. I. 1985, A&A, 149, 71.
- (22) Kaastra, J. S., Ferrigno, C., Tamura, T., Paerels, F. B. S., Peterson, J. R. and Mittaz, J. P. D 2001, A&A, 365, 99.
- (23) Kaastra, J.S., Lieu, R.,Tamura, T., Paerels, F. B. S. and den Herder, J. W. 2003, A&A. 397, 445
- (24) Kaastra, J.S. et al. 2004a, A&A, 413, 415.
- (25) Kaastra, J.S., Lieu, R., Tamura, T., Paerels, F.B.S and den Herder, J.W.A. 2004b, Proceedings of the colloquium ”Soft excess emission and related phenomena”.
- (26) Kirsch, M. 2004, XMM-Newton Users Group Meeting Presentations, http://xmm.vilspa.esa.es/ external/xmm_user_support/usersgroup/20040602/epic_calib.pdf
- (27) Landini, M. and Monsignori Fossi, B. C. 1990, A&AS, 82, 229.
- (28) Lieu, R., Ip, W.-I., Axford, W.I. and Bonamente, M. 1999, ApJ, 510,L25.
- (29) Lieu, R. and Mittaz, J.P.D. 2004, Proceedings of the colloquium ”Soft excess emission and related phenomena”.
- (30) Lumb, D. H., Warwick, R. S., Page, M. and De Luca, A. 2002, ApJ, 389, 93.
- (31) Mittaz, J.P.D., Lieu, R., Cen, R. and Bonamente, M. 2004, ApJ617, 860.
- (32) Mittaz, J.P.D., Lieu, R. and Bonamente, M. 2005, ApJ, in preparation.
- (33) Morrison, R. and McCammon, D. 1983, ApJ, 270, 119.
- (34) Nevalainen, J.H., Lieu, R., Bonamente, M. and Lumb, D. 2003, ApJ, 584, 716.
- (35) Nevalainen, J.H., Markevitch, M. and Lumb, D. 2005, ApJ submitted.
- (36) Perri, M. et al. 2003, A&A, 407, 453.
- (37) Peterson, J. R., Kahn, S. M., Paerels, F. B. S., Kaastra, J. S., Tamura, T., Bleeker, J. A. M., Ferrigno, C. and Jernigan, J. G. 2003, ApJ590, 207.
- (38) Ravasio, M. et al. 2002, A&A, 383, 76.
- (39) Reiprich, T.H. and Boehringer, H. 2002, ApJ, 567, 716.
- (40) Rybicki, G.M. and Lightman, A.P. 1979, ‘Radiative processes in astrophysics’, John Wiley and sons.
- (41) Sarazin, C.L. 1988, X-ray emission from clusters of galaxies, Cambridge Astrophysics Series (Cambridge: Cambridge University Press)
- (42) Sarazin, C.L. and Lieu, R. 1998, ApJ, 494, L177.
- (43) Snowden, S.L. et al. 1997, ApJ, 485, 125.
- (44) Snowden, S.L., Egger, R., Finkbeiner, D.P., Freyberg, M.J. and Plucinsky, P.P. 1998, ApJ, 493, 715.
- (45) Volk, H. J., Aharonian, F. A. and Breitschwerdt, D. 1996, Space Sc. Rev. 75, 279.
- (46) Wolter, A. et al. 1998, A&A, 335, 899.