High-spatial resolution observations of NH3 and CH3OH towards the massive twin cores NGC6334 I & I(N)
Abstract
Molecular line observations of NH3 (J,K)=(1,1), (2,2) and CH3OH at 24.93 GHz taken with the Australian Telescope Compact Array (ATCA) toward the massive twin cores NGC6334 I & I(N) reveal significant variations in the line emission between the two massive cores. The UCHii region/hot core NGC6334 I exhibits strong thermal NH3 and CH3OH emission adjacent to the UCHii region and coincident with two mm continuum peaks observed by Hunter et al. (in prep.). In contrast, we find neither compact NH3 nor thermal CH3OH line emission toward NGC6334 I(N). There, the NH3 emission is distributed over a broad region () without a clear peak, and we find Class I CH3OH maser emission with peak brightness temperatures up to 7000 K. The maser emission peaks appear to be spatially associated with the interfaces between the molecular outflows and the ambient dense gas. Peak NH3(1,1) line brightness temperatures K in both regions indicate gas temperatures of the same order. NH3 emission is also detected toward the outflow in NGC6334 I resulting in an estimated rotational temperature of K. Furthermore, we observe CH3OH and NH3 absorption toward the UCHii region, the velocity structure is consistent with expanding molecular gas around the UCHii region. Thermal and kinematic effects possibly imposed from the UCHii region on the molecular core are also discussed.
1 Introduction
The prominent molecular cloud/Hii region complex NGC6334 at a distance of 1.7 kpc is composed of a series of luminous star forming regions at various stages of evolution (Neckel, 1978; Straw & Hyland, 1989). During the initial radio and infrared studies completed over twenty years ago, a confusing family of nomenclature was introduced for this region. Letters A-F refer to VLA 6cm continuum sources (Rodriguez et al., 1982), while Roman numerals I through VI refer to far-infrared sources (McBreen et al., 1979; Loughran et al., 1986). While each center of activity contains CO hot spots and various masers, the youngest region appears to be radio source “F” (which corresponds to infrared source “I” and IRAS source 17175–3544) located at the northeastern end of the complex. Even the earliest far-infrared maps (Gezari, 1982) resolved the emission of source I into two cores: the sources I and I(N), which are separated by . With the cold dust emission, only a few red infrared sources and weak cm continuum emission (e.g., Gezari 1982; Tapia et al. 1996; Sandell 2000; Carral et al. 2002), Source I(N) is considered to be the least evolved object in the region.
1.1 NGC6334 I
A well-known, cometary compact Hii region lies at the heart of source I (e.g., Carral et al. 1997) and contains associated OH masers (Brooks & Whiteoak, 2001; Gaume & Mutel, 1987), Class II CH3OH masers (Ellingsen et al., 1996) and H2O masers (Moran & Rodríguez, 1980; Forster & Caswell, 1989). Recent mid-infrared imaging with OSCIR at the Keck II telescope has identified a candidate star (IRS1E) for the excitation source of the compact Hii region (De Buizer et al., 2002). Single dish bolometer maps from JCMT reveal a compact () strong (sub)mm continuum source with an estimated dust temperature of 100 K (Sandell, 2000). A SEST line-survey (Thorwirth et al., 2003) shows rich molecular line emission in the mm wavelength range similar to prototypical high-mass star-forming regions such as Orion-KL. Comparable results are obtained in a mini line survey near 345 GHz (McCutcheon et al., 2000). A CO(2–1) outflow with a velocity range of km s-1 emanates from NGC6334 I (Bachiller & Cernicharo, 1990) and a similar outflow is also seen in the H76 and H92 recombination lines (de Pree et al., 1995). Several knots of shock-excited H2 emission have been detected near the ends of this outflow (Davis & Eisloeffel, 1995; Persi et al., 1996; Megeath & Tieftrunk, 1999) along with NH3 (3,3) masers (Kraemer & Jackson, 1995). The driving source(s) for the outflow were claimed to be either the powering source of the UCHii region, or an adjacent object. One candidate is the cold m source I:KDJ2 located to the north-west of the UCHii region (as resolved by MIRAC2 at IRTF), which is not seen at shorter wavelengths (Kraemer et al., 1999). Alternatively, the powering source of the UCHii region and I:KDJ2 may both drive independent outflows.
1.2 NGC6334 I(N)
Similar to source I, the JCMT bolometer maps show I(N) to be a strong source of (sub)mm continuum emission (Sandell, 2000). The estimated dust temperature is lower around 30 K. While source I is stronger than I(N) in CS (5–4) (Kraemer & Jackson, 1999) and in CS (7–6), the HC3N (15–14) line is much stronger in I(N) than in I (Megeath & Tieftrunk, 1999; Sollins & Megeath, 2004). Further differences can be seen in the 230 GHz line survey where the CH3OH bands (at 240-242 GHz and 250-252 GHz) are fainter in I(N) than I (Thorwirth et al., 2003), probably indicating a younger age for this region. Similar conclusions were drawn by McCutcheon et al. (2000) based on their smaller line survey and spectral line mapping of the two regions. Indeed, in striking contrast to I, the I(N) region shows no mid-infrared emission and only a few red infrared sources (Tapia et al., 1996). Traditionally, I(N) has also been known as lacking cm continuum emission; however, two faint ( mJy), compact cm sources have recently been detected with the VLA (Carral et al., 2002). One object sits only from the (sub)millimeter continuum peak, and is consistent with the ionizing radiation from a B2 ZAMS star. This cm peak is associated with Class II CH3OH maser emission (Ellingsen et al., 1996). Furthermore, Class I CH3OH maser emission has been mapped at 44 GHz and shows emission peaks distributed over approximately (Kogan & Slysh, 1998). A bipolar outflow has also been mapped in the SiO(2–1) and (5–4) transitions with the SEST in south-east north-west direction approximately coincident with the distribution of the Class I CH3OH maser at 44 GHz (Megeath & Tieftrunk, 1999). These authors also find independent evidence for outflow activity in H2 clumps, which are present but less pronounced than in source I.
1.3 Concerted ATCA and SMA observations
Because NGC6334 I & I(N) are close to each other – thus sharing a similar large-scale environment – but in different evolutionary stages, they are the ideal target sources to characterize the evolutionary differences in physical and chemical properties of massive star-forming regions. Both sources have been thoroughly investigated at near/mid-infrared wavelength and at lower spatial resolution in the radio and mm regime (with some already mentioned exceptions). However, high-spatial resolution molecular line and continuum studies from short cm to submm wavelength have been lacking so far because of its location in the southern hemisphere. This situation has changed over the last couple of years with the advent of the 12 mm and 3 mm systems at the Australian Telescope Compact Array (ATCA) and the dedication of the Submillimeter Array (SMA). Therefore, we started a combined effort to investigate the molecular line and continuum emission from 12 mm to the submm regime employing both instruments. Here, we present the NH3(1,1), (2,2) and the CH3OH (near 25 GHz) results from the ATCA, whereas a separate paper outlines the first SMA results toward these sources at 217 GHz (Hunter et al., in prep.).
The SMA data show three mm continuum sources toward NGC6334 I, two of them adjacent to the UCHii region and one approximately coincident with the cm continuum peak (Hunter et al. in prep.). Toward NGC6334 I(N), they detect another mm continuum peak (a few arcsecond offset from the cm-peak) with a little bit of more extended emission. These mm peak positions will be compared with our NH3 and CH3OH emission throughout this paper. Furthermore, Hunter et al. (in prep.) detect very collimated SiO(5–4) outflows in NGC6334 I & I(N), and the outflow orientation in both sources is approximately the same in the north-east south-west direction. It is important to mention that the new outflow in NGC6334 I(N) is approximately perpendicular to the previously observed larger-scale outflow (Megeath & Tieftrunk, 1999).
2 Observations
The sources NGC6334 I & I(N) were observed on July 6th and 7th of 2004 with the Australian Telescope Compact Array (ATCA) in the compact 750D configuration with 5 antennas and a baseline range between 31 and 719 m. Antenna 6 was also included, resulting in a maximum projected baseline of km. The phase reference centers are given in Table 1. The observed lines are the NH3(1,1) and (2,2) inversion lines, with the frequencies of the main hyperfine components at 23.695 GHz and 23.723 GHz, and one spectral setup at 24.932 GHz covering three CH3OH lines at 24.9287 GHz (CH3OH()E), 24.9335 GHz (CH3OH()E) and 24.9344 GHz (CH3OH()E). In addition, we observed the cm continuum emission with one spectral unit covering a bandwidth of 128 MHz centered at 22.08 GHz. A good uv-coverage was obtained through regular switching between both sources and the three spectral setups. The spectral resolution of the observations was 16 kHz corresponding to a velocity resolution of km s-1. The primary beam of the ATCA at the given frequency is . The data were reduced with the MIRIAD package. Applying a robust weighting of 1 (closer to natural than uniform weighting, thus stressing the shorter baselines) the synthesized beam is . We smoothed the data to 0.5 km s-1 channels, and the rms per 0.5 km s-1 is mJy. The rms of the 22 GHz continuum and some of the velocity-integrated line maps are partly slightly higher, mainly because of more pronounced side-lobe effects due to the strong emission features. The values are given in each Figure separately .
3 Observational Results
The spatial distribution of the molecular gas is significantly different between NGC6334 I and NGC6334 I(N) (Figures 1 & 2). Toward NGC6334 I, we find strong thermal, compact NH3 and CH3OH emission in close proximity to the UCHii region. In contrast, the NH3 emission toward NGC6334 I(N) exhibits very extended emission without a compact component, and we find no thermal CH3OH feature but only strong maser emission.
3.1 NGC6334 I
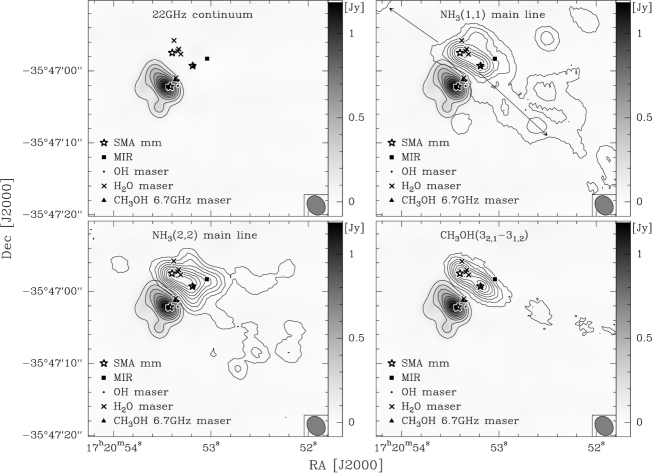
The NH3 and CH3OH emission from NGC6334 I shows two emission peaks a few arc-seconds offset from the UCHii region (Fig. 1). The low-level molecular emission terminates at the edge of the UCHii region, thus we have an example of an observed edge-on orientation between an UCHii region next to a hot core. The two molecular line peaks are coincident with two of the three mm continuum peaks observed by Hunter et al. (in prep.) with the SMA. Interestingly, the molecular line peaks are of the same intensity whereas the north-eastern mm-peak has about 2.5 times the continuum flux than the south-western mm-peak. Another difference between the two peak positions is that the north-eastern peak is associated with H2O maser emission (Moran & Rodríguez, 1980; Forster & Caswell, 1989) whereas the south-western peak exhibits Class II CH3OH maser emission (Ellingsen et al., 1996). More CH3OH, H2O and OH maser emission is found at the interface between the molecular core and the UCHii region. Furthermore, we detect extended NH3(1,1) emission south-west of the two peak positions. This extended emission is significantly weaker in the NH3(2,2) line and is barely detected in CH3OH. It is in the same direction as the molecular outflow observed in CO by Bachiller & Cernicharo (1990) and more recently in SiO by Hunter et al. (in prep.).
The spatial distribution of the NH3 gas we have observed varies considerably from the previously reported VLA map by Jackson et al. (1988). With a spatial resolution of , they detected more extended emission and their peak intensity position is south of ours. Tapering our data to the same lower spatial resolution, we recover most of their extended structure, but our peak positions remains coincident with the two peaks shown in Figure 1. Due to the large number of antennas at the VLA (27 versus 6 at the ATCA), their uv-coverage should be good and allow a reasonable recovery of the large-scale structure, but the offset of their peak position remains a puzzle. However, our data are less sensitive to large-scale emission and therefore trace the small-scale cores far better. Additionally, the exact coincidence of our NH3 and CH3OH peak positions with the mm peaks reported by Hunter et al. (in prep.) give additional confidence to the small-scale gas core distribution presented in Figure 1. Furthermore, considering the multiple sources we find in NGC6334 I and the now known outflow in the region (Bachiller & Cernicharo, 1990), the disk-interpretation of the NH3 data by Jackson et al. (1988) does not hold anymore, and it is more likely that their observed large-scale emission is somehow associated with the outflow as well.
3.2 NGC6334 I(N)
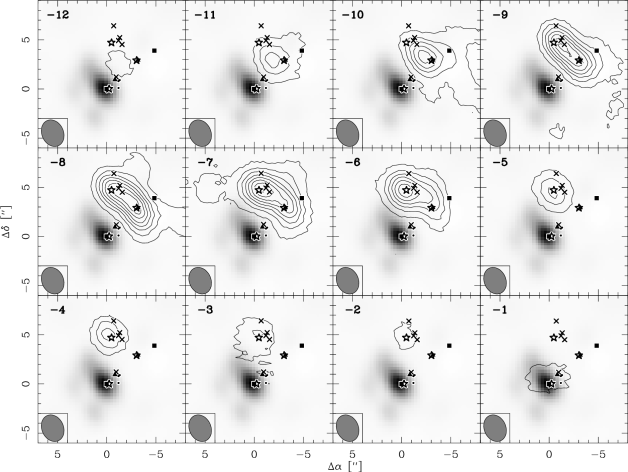
We do not detect any compact thermal NH3 or CH3OH emission toward NGC6334 I(N) (Fig. 2). However, the extended NH3 emission has about the same peak intensities as NGC6334 I but is distributed over a large area () without a distinct peak position. The mm peak detected by Hunter et al. (in prep.) is located approximately at the center of the large-scale NH3 core. The NH3(1,1) and (2,2) emission has a similar spatial distribution as the NH3(3,3) emission previously reported by Kraemer & Jackson (1999).
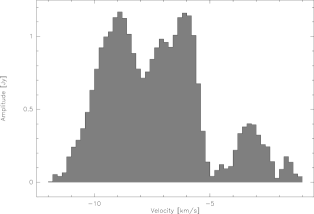
While we do not detect any thermal CH3OH emission, we find Class I CH3OH maser emission from the CH3OH()E and CH3OH()E lines (nothing from the CH3OH()E line). Both lines show a maser component at km s-1, but the CH3OH()E line exhibits another maser component at km s-1 (Fig. 3). The spatial position of the km s-1 components are approximately north-east of the mm-peak in the direction of the collimated SiO outflow, whereas the km s-1 component is located about south of the mm-peak (the exact positions are given in Table 2). The observed peak brightness temperature of the km s-1 line is K (Fig. 3). The km s-1 component is less clearly associated with one of the two outflow axes, but both components are spatially close to previously detected Class I CH3OH 44 GHz maser positions (Kogan & Slysh, 1998). We note that there are significantly fewer, just two, 25 GHz maser components detected than 44 GHz components. The 23 maser spots observed in the latter line are spread over an area of , which is somewhat larger, but comparable to the separation of the 25 GHz components. The positional offsets between the 44 GHz and the 25 GHz maser positions may be due to the loss of absolute positional information during self-calibration of the 44 GHz data by Kogan & Slysh (1998). Performing Gaussian fits to the CH3OH data in the image plane, we get slightly extended features compared to the beam size. This indicates unresolved spatial blending of different maser components within each channel width of 0.2 km s-1.
4 Analysis
4.1 Temperature estimates from the NH3 observations
4.1.1 The NGC6334 I peak region
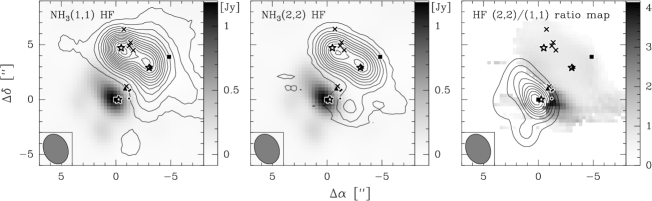
NH3(1,1) and (2,2) lines are widely used as thermometers in molecular clouds (e.g., Walmsley & Ungerechts 1983; Danby et al. 1988). Figure 4 shows NH3(1,1) and (2,2) spectra toward the two NH3 peak positions overlayed with fits to the hyperfine structure. The hyperfine structure line fits were performed in CLASS (part of the GILDAS software package) assuming a Gaussian velocity distribution, equal excitation temperatures and the theoretical intensity ratio and spacing between main and satellite hyperfine lines. The fitted parameters are the excitation temperature, the opacity of the main hyperfine component, the line-width and the . Obviously, the flat-topped fits do not reproduce the observed spectra well which is likely due to an extremely high optical depth and varying excitation conditions over the width of the lines. Missing flux due to missing short spacings does not play a significant role since we sample large-scale emission in NGC6334 I(N) (Fig. 2) and the uv-coverage of both observations is nearly the same. These fits do not allow us to derive accurate temperatures. Therefore, we tried to work only with the satellite hyperfine components of the spectra, and Figure 5 presents the integrated emission maps of the outer satellite hyperfine components at the most negative velocities (the blend of the NH3(1,1) & lines at GHz and the NH3(2,2) line at GHz). In the following, we refer to these lines as the (outermost) satellite hyperfine (hf) components. An intriguing difference between the integrated NH3(1,1) and (2,2) satellite hyperfine structure line maps is that the (1,1) satellite hf-line shows a similar peak intensity distribution as the (1,1) main hf-line whereas the (2,2) satellite hf-line shows an additional intensity peak a few arc-seconds south directly at the western edge of the UCHii region peak. A (2,2)/(1,1) hf-ratio-map between the two integrated hf-maps stresses this difference as well (Figure 5, right panel). The peak NH3(2,2)/(1,1) hf-ratios at this position are in contrast to ratios of toward the two main peak positions.
The energy levels of the NH3(1,1) and (2,2) lines are 23 and 64 K above ground, and this line-pair is mainly sensitive to temperatures below 50 K. As shown by Danby et al. (1988), rotational temperatures derived from NH3(1,1) and (2,2) line observations are not sensitive to kinetic temperature changes above about 50 K. Therefore, NH3(2,2)/(1,1) hf-ratios are of no use for temperature estimates. This is the case for both mm-peak positions as well as the additional (2,2) hf-peak close to the UCHii region (Fig. 5). However, we observe NH3(1,1) peak brightness temperatures K toward the two mm peak positions, and these brightness temperatures can be considered as lower limits for the kinetic temperatures at these positions. As the (2,2)/(1,1) hf-ratio toward the additional (2,2) hf-peak is significantly higher (), the temperatures there should be higher as well. While it is likely that massive protostellar objects at the center of the two mm-peaks are causing the high temperatures there, the hot spot close to the UCHii region is probably being caused by heating of the UCHii region itself.
The energy levels above ground for the three CH3OH lines are between 28 and 44 K, thus these lines cannot be used for more accurate temperature determinations as well.
4.1.2 The NGC6334 I outflow region
The situation is different in the outflow region, and we can extract reasonable NH3(1,1) and (2,2) spectra toward the NH3(1,1) outflow-associated peak at offsets (). Fitting the whole hyperfine spectra at this position, we can derive a rotational temperature of K (for details on the temperature calculation from NH3 observations, see, e.g., Ungerechts et al. 1986). At these low temperatures, rotational temperatures correspond well to kinetic temperatures (Danby et al., 1988).
4.1.3 The northern source NGC6334 I(N)
Since we have no well defined NH3 peak position in NGC6334 I(N), we extracted spectra toward the mm peak position determined by Hunter et al. (in prep.), which is offset by from our phase reference center. The brightness temperatures are comparable to the brightness temperatures in the southern source NGC6334 I but the opacities are lower as observed in the lower hyperfine line strengths (especially in the (2,2) lines, Figure 6). Therefore, we can fit these lines reasonably well and again derive rotational temperatures as done previously for the outflow position. The derived NH3 rotational temperature is K corresponding to kinetic temperatures K (Danby et al., 1988). Thus, again we can derive only lower limits for the temperatures toward NGC6334 I(N). This estimate based on the high-spatial resolution interferometric observations is significantly higher than previous estimates of 30 K from single-dish NH3 observations with a beam size of (Kuiper et al., 1995), because the latter observations averaged over the whole region.
4.2 Kinematic structures of the molecular gas in NGC6334 I
The striking edge-on orientation between the UCHii region and the molecular peaks in NGC6334 I allows a closer analysis of possible kinematic signatures the UCHii region might impose on the molecular cores (in addition to the heating effect we have described in §4.1.1). Figure 7 shows two position-velocity (pv) cuts performed for the NH3(2,2): (a) in east-west direction from the UCHii region through the NH3(2,2) hyperfine emission hot spot, and (b) from the UCHii region in north-western direction through the main mm and NH3 peak position. While there is considerable structure in the east-west pv-diagram (a), it however does not reveal any clear signature that the UCHii could have imposed on the molecular gas. The other pv-diagram (b) shows no strong velocity gradients from the UCHii region in the direction of the NH3 peak position as well.
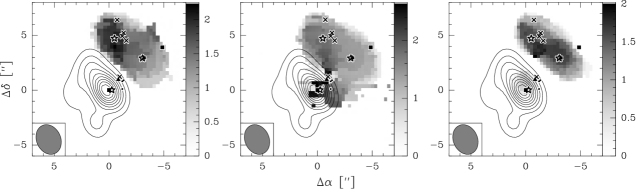
Figure 8 presents the moment 2 maps (velocity dispersion maps) of the two NH3(1,1) & (2,2) outermost satellite hyperfine lines and one of the CH3OH lines. While the velocity dispersion of the (1,1) hf-line peaks toward the north-eastern NH3 peak, the (2,2) velocity dispersion peaks further south toward the UCHii region and the NH3(2,2) hyperfine hot spot. In contrast, the moment 2 map of CH3OH shows two peaks both associated with the two molecular peak positions.
At estimated temperatures of K the critical densities of the CH3OH lines are of the order cm-3, whereas the critical densities of the NH3 lines are lower (of order cm-3). The velocity dispersion of the higher density tracer CH3OH is dominated by internal motion due to the embedded protostars. To some degree this is also the case for NH3, and especially the (1,1) moment 2 maps peaks toward the strongest mm continuum peak. However, there is no obvious (1,1) velocity dispersion peak toward the secondary mm peak position. The NH3(2,2) velocity dispersion is clearly dominated by the NH3(2,2) hyperfine hot spot close to the UCHii region. Since NH3 has lower critical densities than CH3OH, its line emission shows comparably less contribution from the densest cores, and it is thus more likely to exhibit temperature and kinematic signatures imposed by the adjacent UCHii region.
4.3 Molecular absorption toward the UCHii region
In addition to the molecular line emission, there are prominent CH3OH line absorption features observed in all three lines toward the UCHii region in NGC6334 I (Fig. 9). Examining the NH3 data, we find no absorption in the satellite hyperfine lines but weak NH3 absorption features in the two main lines. Position-velocity cuts of one of the CH3OH and the two NH3(1,1) and (2,2) main lines through the UCHii region at Dec.=0 reveal that the absorption features are blue-shifted with regard to the (weak) emission features toward the UCHii region. This signature is more pronounced in the CH3OH and NH3(1,1) line whereas it is not obviously discernible in the NH3(2,2) line. Nevertheless, these data indicate expanding molecular gas around the UCHii region.
5 Discussion
The differences between the two massive star-forming regions NGC6334 I & I(N) in their molecular NH3 and CH3OH emission are rather astonishing: compact thermal emission is observed in both species toward the UCHii region/hot core NGC6334 I whereas extended NH3 and masing CH3OH emission is found toward NGC6334 I(N). It is not entirely obvious what is causing these differences because both sources harbor compact mm continuum sources as well as jet-like SiO outflows (Hunter et al. in prep.). Since the southern source NGC6334 I has a UCHii region, it is likely that evolutionary processes are at least partly responsible for the different molecular signatures. However, with the data obtained during the present investigation we still cannot accurately determine temperature and density in both regions, and one expects that the molecular emission is sensitive to these parameters. Therefore, it is an important next step to get thorough estimates of the characteristic temperatures and densities of both regions to get a deeper understanding of the physical processes causing the observational differences.
5.1 Four stages of massive star formation within 1 pc
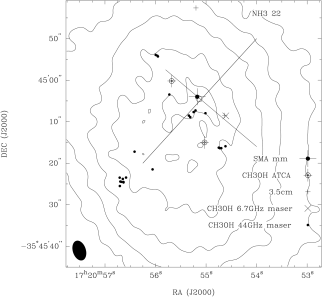
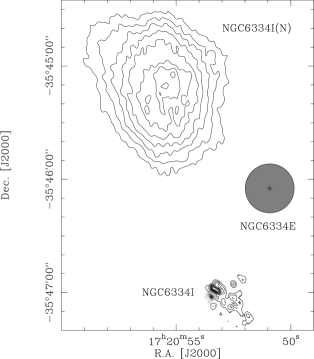
Figure 11 presents a large-scale overview of the north-eastern end of the NGC6334 region comprising NGC6334 I, NGC6334E and NGC6334 I(N). It is interesting that within 1 pc distance we find four different evolutionary stages of massive star formation: the shell-like Hii region NGC6334E, the champagne-flow-like UCHii region NGC6334 I and its adjacent outflow driving mm cores, and further north the enigmatic source NGC6334 I(N). NGC6334E lies just outside each of our primary beams, thus we have no new data about this source.
From an evolutionary point of view, the shell-like Hii region NGC6334E appears to be the most evolved and thus oldest source within the region (e.g., Rodriguez et al. 1982; Tapia et al. 1996; Carral et al. 2002). The UCHii region NGC6334 I is significantly smaller than NGC6334E and thus apparently in an earlier evolutionary stage (e.g., Persi & Ferrari-Toniolo 1982; de Pree et al. 1995). Based on the cold dust temperatures, the detection of only a few very red infrared sources and weak cm emission (Gezari, 1982; Tapia et al., 1996; Sandell, 2000; Carral et al., 2002), NGC6334 I(N) was always considered to be the youngest region within the large-scale NGC6334 complex. However, comparing the mm continuum/NH3 sources in NGC6334 I with those in NGC6334 I(N), it is not entirely obvious which of these two regions is evolutionary younger. Both complexes have compact mm dust continuum sources and drive collimated outflows. In contrast to these similarities, the differences in the compact versus extended NH3 emission and thermal versus maser CH3OH emission at 24.9 GHz are striking. Furthermore, the differences in the estimated dust temperatures are large with 100 K for NGC6334 I and only 30 K for NGC6334 I(N) (Sandell, 2000). Contrary to this, even constraining only lower limits for the gas temperatures based on our NH3 observations, we derive kinetic gas temperatures K for both regions. Even considering the different beam sizes of the SCUBA observations of the dust emission (between and depending on the frequency) and our NH3 gas observations, the dust and gas temperatures in NGC6334 I appear to be consistent with each other, whereas this is not the case for NGC6334 I(N). There, the gas and dust temperatures appear to have decoupled. Additionally, Sandell (2000) estimated the bolometric luminosities of both sources to differ by about two orders of magnitude with L⊙ and L⊙ for NGC6334 I & I(N), respectively. This difference could either imply that NGC6334 I(N) may not form a cluster as massive as NGC6334 I, or NGC6334 I(N) may be less evolved and younger than NGC6334 I and thus may still build up its final larger luminosity. With the observations so far, we cannot clearly judge which of these two regions is in an earlier evolutionary stage. With the UCHii region and the infrared cluster present, the whole region NGC6334 I is older than the region NGC6334 I(N), but it is less clear whether the same conclusion holds for the mm/NH3 cores within NGC6334 I. However, it is worth mentioning that the non-detection of compact NH3 emission toward the mm sources in NGC6334 I(N) is a rarely observed phenomenon and may indicate a short-lived period during the evolution of massive star-forming regions.
5.2 Turbulence versus organized motion
Figure 12 shows a spectrum of the outermost satellite hyperfine component of the NH3(1,1) line in the uv-domain on the shortest baseline of 31 m. Several velocity components are present: one centered at km s-1, one at km s-1, one at km s-1, and one at km s-1. Analyzing the spatial distribution of the different velocity components (Figure 13) we find that only the km s-1 component is clearly associated with the south-western NH3 emission peak, whereas all other features are associated with the north-eastern peak (which is also the peak of stronger mm continuum emission).
Contrary to the complex profile in the uv-domain (Figure 12), the hyperfine components of the spectra taken individually toward each peak position resemble single-peaked Gaussians (Figures 4 & 6). We conducted Gaussian line-fits to the outermost satellite hyperfine components of the NH3(1,1) line toward the two NH3 peak position in NGC6334 I and the mm peak position in NGC6334 I(N), and the derived line-widths vary between 4.1 and 5.1 km s-1 (see Table 3).
What is causing these broad line-widths, turbulent motion due to, e.g., molecular outflows, or organized motion due to, e.g., infall, envelope rotation, disks, or multiple components? Sridharan et al. (2002) have shown that the NH3 linewidth observed with single-dish telescopes toward High-Mass Protostellar Objects (HMPOs) is significantly lower than toward typical UCHii regions and hot cores ( km s-1 versus km s-1). Since we find gas temperatures of the order 100 K, NGC6334 I & I(N) are considered to be part of the hot core group. Therefore, most likely the large line-widths are an evolutionary signature of the hot core stage and no remnant from the original molecular core. The thermal linewidth at 100 K is only 0.31 km s-1 and thus non-thermal motion has to account for nearly all the observed linewidth. To estimate the corresponding energy within the core we calculated with the core mass derived from the mm continuum emission (Hunter et al. in prep.) and the non-thermal linewidth component. The derived energy values corresponding to internal motion are of the order erg (see Table 3).
Interestingly, the typical energy supply of massive molecular outflows is of the same order (e.g., Beuther et al. 2002). The spatial scales for the molecular outflows are usually of the order 1 parsec whereas the NH3 line-widths observed toward NGC6334 I are confined to a few thousand AU, thus the estimated energies are not directly comparable. However, the uncertainties in deriving outflow energies are usually high, up to an order of magnitude (e.g., Cabrit & Bertout 1990), and it might be possible that comparable amounts of energy could be supplied from the outflow on spatial scales as small as the NH3 cores. Therefore, turbulence caused by molecular outflows may contribute to the observed linewidth in NGC6334 I. Contrary to this, Zhang et al. (1998, 2002) find broad NH3 line-widths of the order 5 km s-1 toward two young massive star-forming regions, whereas the NH3 emission in the surrounding cores has a narrower linewidth of the order 2 km s-1. These observations are interpreted as indirect evidence for rotating disks within these massive star-forming regions. Since we are unable to derive any systematic velocity gradient within the separate cores of NGC6334 I, we cannot attribute our observations to a disk scenario. However, it is likely that the observed line-widths are caused at least to some degree by organized motion within the inner few thousand AU caused by either infall, envelope rotation, disks or multiple components, or an interplay of various of these components. Only higher angular resolution observations can disentangle all these contributions.
5.3 Shocks in NGC6334 I(N)
In contrast to NGC6334 I, the situation appears to be different in NGC6334 I(N) because the NH3 emission is not confined to the mm peak position, and we observe broad line-widths over a large spatial area. Since there are at least two molecular outflows in the region, the broad linewidth could well be caused by shock interactions of the outflow with the surrounding molecular core.
Additional evidence for outflow-shock interactions is the detection and the spatial spread of the Class I 25 and 44 GHz CH3OH maser emission which is believed to be caused by the interactions of outflows from massive star-forming regions with the surrounding cloud cores (e.g., Menten 1991; Sobolev 1993). Class I CH3OH maser observations at 95 GHz in DR21 revealed that they are located at the interface of the molecular outflow and the surrounding ambient gas (Plambeck & Menten, 1990). Similar results were found for Class I CH3OH maser emission near 25 GHz in the Orion-KL region, where Johnston et al. (1992) suggest that the Class I maser emission is formed behind shock fronts between the outflows and the dense cloud gas.
In the case of NGC6334 I(N), the north-eastern 25 GHz maser feature (the km s-1 component) is obviously spatially associated with the jet-like SiO(5–4) outflow (Hunter et al. in prep., e.g., Fig. 2), and thus fits well into the shock-excitement picture. The southern 25 GHz maser (the km s-1 component) is less clearly associated with one of the two outflow axes. However, the north-west south-eastern outflow of Megeath & Tieftrunk (1999) is significantly less collimated than the newly detected SiO jet of Hunter et al. (in prep.), and therefore it is plausible that the Class I maser features near the southern km s-1 maser peak (i.e., 25 and 44 GHz masers) are associated with the interface of the broader outflow cone and the ambient cloud. Comparing the overall spatial distribution of the 25 and 44 GHz Class I CH3OH maser emission with the present outflow morphologies (see Fig. 2) all maser features appear to be associated with the outflows and are likely caused by the shock-interactions of the outflows and the ambient gas.
The Class I CH3OH masers in NGC6334 I(N) thus show the same behavior as masers of this kind in many other regions: First, individual narrow-line maser components are spread over areas of several tenths of a parsec, offset from any possible exciting source. Additional evidence places them in the interaction zones of outflows and dense ambient gas. Second, apart from perhaps Orion-KL, masers in the 44 GHz transition are always stronger than those in any of the 25 GHz lines, and frequently the strongest of all Class I CH3OH masers. This can be understood from the (collisional) pumping mechanism of Class I methanol masers, which produces efficient masing in the 25 GHz lines over just the range of physical parameters one may expect in the scenario described above (Leurini, Menten, & Schilke 2005, in prep.). This means that possible 25 GHz emission from many of the spots from where 44 GHz emission arises may be too weak to be detectable.
6 Summary
The NH3(1,1) & (2,2) and CH3OH observations of the two massive twin cores NGC6334 I & I(N) reveal significantly different emission signatures between both regions. While NGC6334 I shows strong, compact thermal emission in the observed NH3 and CH3OH lines adjacent to the UCHii region and coincident with mm continuum peaks observed by Hunter et al. (in prep.), there is no compact thermal line emission toward NGC6334 I(N). Here, we find that the NH3 emission is distributed over a broad area of size approximately . No thermal CH3OH emission is found toward NGC6334 I(N) but we do detect two Class I CH3OH maser peaks with peak brightness temperatures of K. The two maser peaks may be spatially associated with 44 GHz Class I CH3OH maser emission and are likely produced in the interfaces between the molecular outflows and the ambient gas.
NH3 peak brightness temperatures K toward the mm-peak positions in NGC6334 I & I(N) indicate kinetic temperatures of the same order. However, the NH3(1,1) & (2,2) lines are only suitable as a good thermometer below 50 K and thus we cannot derive more than a lower limit for the temperatures in these regions. Directly at the western edge of the UCHii region we find a hot spot where the line ratios between the NH3(2,2) and (1,1) outermost satellite hyperfine components are surprisingly high around 4, indicating even higher temperatures. Since this position is not associated with any mm continuum peak, the heating is likely caused by the UCHii region. NH3 emission is also detected toward the outflow in NGC6334 I, and we can estimate a rotational temperature of approximately K there.
Toward the UCHii region in NGC6334 I we observe CH3OH and NH3 absorption. The absorption features are blue-shifted with regard to the emission features close-by. This signature is consistent with expanding molecular gas around the UCHii region. We do not find additional strong kinematic effects imposed from the UCHii region on the adjacent molecular cores.
References
- Bachiller & Cernicharo (1990) Bachiller, R. & Cernicharo, J. 1990, A&A, 239, 276
- Beuther et al. (2002) Beuther, H., Schilke, P., Sridharan, T. K., et al. 2002, A&A, 383, 892
- Brooks & Whiteoak (2001) Brooks, K. J. & Whiteoak, J. B. 2001, MNRAS, 320, 465
- Cabrit & Bertout (1990) Cabrit, S. & Bertout, C. 1990, ApJ, 348, 530
- Carral et al. (1997) Carral, P., Kurtz, S. E., Rodriguez, L. F., de Pree, C., & Hofner, P. 1997, ApJ, 486, L103
- Carral et al. (2002) Carral, P., Kurtz, S. E., Rodríguez, L. F., et al. 2002, AJ, 123, 2574
- Danby et al. (1988) Danby, G., Flower, D. R., Valiron, P., Schilke, P., & Walmsley, C. M. 1988, MNRAS, 235, 229
- Davis & Eisloeffel (1995) Davis, C. J. & Eisloeffel, J. 1995, A&A, 300, 851
- De Buizer et al. (2002) De Buizer, J. M., Radomski, J. T., Piña, R. K., & Telesco, C. M. 2002, ApJ, 580, 305
- de Pree et al. (1995) de Pree, C. G., Rodriguez, L. F., Dickel, H. R., & Goss, W. M. 1995, ApJ, 447, 220
- Ellingsen et al. (1996) Ellingsen, S. P., von Bibra, M. L., McCulloch, P. M., et al. 1996, MNRAS, 280, 378
- Forster & Caswell (1989) Forster, J. R. & Caswell, J. L. 1989, A&A, 213, 339
- Gaume & Mutel (1987) Gaume, R. A. & Mutel, R. L. 1987, ApJS, 65, 193
- Gezari (1982) Gezari, D. Y. 1982, ApJ, 259, L29
- Jackson et al. (1988) Jackson, J. M., Ho, P. T. P., & Haschick, A. D. 1988, ApJ, 333, L73
- Johnston et al. (1992) Johnston, K. J., Gaume, R., Stolovy, S., et al. 1992, ApJ, 385, 232
- Kogan & Slysh (1998) Kogan, L. & Slysh, V. 1998, ApJ, 497, 800
- Kraemer et al. (1999) Kraemer, K. E., Deutsch, L. K., Jackson, J. M., et al. 1999, ApJ, 516, 817
- Kraemer & Jackson (1995) Kraemer, K. E. & Jackson, J. M. 1995, ApJ, 439, L9
- Kraemer & Jackson (1999) —. 1999, ApJS, 124, 439
- Kuiper et al. (1995) Kuiper, T. B. H., Peters, W. L., Forster, J. R., Gardner, F. F., & Whiteoak, J. B. 1995, ApJ, 446, 692
- Loughran et al. (1986) Loughran, L., McBreen, B., Fazio, G. G., et al. 1986, ApJ, 303, 629
- McBreen et al. (1979) McBreen, B., Fazio, G. G., Stier, M., & Wright, E. L. 1979, ApJ, 232, L183
- McCutcheon et al. (2000) McCutcheon, W. H., Sandell, G., Matthews, H. E., et al. 2000, MNRAS, 316, 152
- Megeath & Tieftrunk (1999) Megeath, S. T. & Tieftrunk, A. R. 1999, ApJ, 526, L113
- Menten (1991) Menten, K. 1991, in Astronomical Society of the Pacific Conference Series, Vol. 16, 119
- Moran & Rodríguez (1980) Moran, J. M. & Rodríguez, L. F. 1980, ApJ, 236, L159
- Neckel (1978) Neckel, T. 1978, A&A, 69, 51
- Persi & Ferrari-Toniolo (1982) Persi, P. & Ferrari-Toniolo, M. 1982, A&A, 112, 292
- Persi et al. (1996) Persi, P., Roth, M., Tapia, M., et al. 1996, A&A, 307, 591
- Plambeck & Menten (1990) Plambeck, R. L. & Menten, K. M. 1990, ApJ, 364, 555
- Rodriguez et al. (1982) Rodriguez, L. F., Canto, J., & Moran, J. M. 1982, ApJ, 255, 103
- Sandell (2000) Sandell, G. 2000, A&A, 358, 242
- Sobolev (1993) Sobolev, A. M. 1993, Astronomy Letters, 19, 293
- Sollins & Megeath (2004) Sollins, P. K. & Megeath, S. T. 2004, AJ, 128, 2374
- Sridharan et al. (2002) Sridharan, T. K., Beuther, H., Schilke, P., Menten, K. M., & Wyrowski, F. 2002, ApJ, 566, 931
- Straw & Hyland (1989) Straw, S. M. & Hyland, A. R. 1989, ApJ, 340, 318
- Tapia et al. (1996) Tapia, M., Persi, P., & Roth, M. 1996, A&A, 316, 102
- Thorwirth et al. (2003) Thorwirth, S., Winnewisser, G., Megeath, S. T., & Tieftrunk, A. R. 2003, in ASP Conf. Ser. 287: Galactic Star Formation Across the Stellar Mass Spectrum, 257–260
- Ungerechts et al. (1986) Ungerechts, H. and Winnewisser, G. and Walmsley, C. M. 1986, A&A, 157, 207
- Walmsley & Ungerechts (1983) Walmsley, C. M. & Ungerechts, H. 1983, A&A, 122, 164
- Zhang et al. (1998) Zhang, Q., Hunter, T. R., & Sridharan, T. K. 1998, ApJ, 505, L151
- Zhang et al. (2002) Zhang, Q., Hunter, T. R., Sridharan, T. K., & Ho, P. T. P. 2002, ApJ, 566, 982


| Source | R.A. | Dec. |
|---|---|---|
| [J2000] | [J2000] | |
| NGC6334 I | 17:20:53.44 | -35:47:02.2 |
| NGC6334 I(N) | 17:20:54.63 | -35:45:08.9 |
| Velocity | R.A. | Dec. |
|---|---|---|
| [km s-1] | [J2000] | [J2000] |
| 17:20:55.68 | -35:45:00.2 | |
| 17:20:55.03 | -35:45:15.0 |
Note. — The estimated absolute positional accuracy is .