A possible bright blue SN in the afterglow of GRB 020305††thanks: Based on observations made with the Nordic Optical Telescope, operated on the island of La Palma jointly by Denmark, Finland, Iceland, Norway, and Sweden.
We report on ground-based and HST(+STIS) imaging of the afterglow and host galaxy of the Gamma-Ray Burst (GRB) of March 5 2002. The GRB occurred in a galaxy, which apparently is part of an interacting system. The lightcurve of the optical afterglow shows a rebrightening, or at least a plateau, 12–16 days after the gamma-ray event. multi-band imaging of the afterglow 12 days after the GRB reveals a blue spectral energy distribution (SED). The SED is consistent with a power-law with a spectral index of , but there is tentative evidence for deviations away from a power-law. Unfortunately, a spectroscopic redshift has not been secured for GRB 020305. From the SED we impose a redshift upper limit of , hence excluding the pseudo redshift of reported for this burst. We discuss the possibilities for explaining the lightcurve, SED and host galaxy properties for GRB 020305. The most natural interpretation of the lightcurve and the SED is an associated supernova (SN). Our data can not precisely determine the redshift of the GRB. The most favoured explanation is a low redshift () SN, but a higher redshift () SN can not be excluded. We also discuss less likely scenarios not based on SNe, like a burst occurring in a galaxy with an extinction curve similar to that of the Milky Way.
Key Words.:
gamma rays: bursts – techniques: photometric1 Introduction
For long duration GRBs the relation with supernovae (SNe) became firmly established with the discovery of the type Ic supernova SN 2003dh associated with GRB 030329 (Stanek et al. Stan03 (2003); Hjorth et al. Hjor03 (2003)). This result lends strong support to the collapsar model (Woosley Woos93 (1993)), but a SN is also an ingredient in other models (e.g. Dado et al. Dado03 (2003); Fryer & Heger Frye04 (2004)). However, the associated SNe follow a broad distribution of optical luminosities (Zeh et al. Zeh04 (2004)). Furthermore the connection of GRBs with SNe of other types than Ic can not be excluded, motivated by the two possible associations of GRBs and II type SNe (SN 1997cy, Germany et al. Germ00 (2000); SN 1999E, Rigon et al. Rigo03 (2003)). Therefore, the afterglow lightcurves and SEDs around the SN peak are far from being described by an universal SN template. In this study we present ground and space-based optical observations of GRB 020305 carried out from 11.5 to 321.2 days after the burst.
GRB 020305 was localised by the HETE-II satellite on March 5.4968 UT (Ricker et al. Rick02 (2002)). The high-energy emission as seen by the Interplanetary network (IPN) consisted in two broad pulses, with a total GRB duration of 280s (Hurley et al. Hurl02 (2002)), placing it in the long-soft burst category. Price et al. (Pric02 (2002)) reported the presence of a transient optical source in the HETE-II/IPN error box in images taken 20 hours after the GRB. Further imaging confirmed the fading behaviour of the candidate (Lee et al. Lee02 (2002); Ohyama et al. Ohya02 (2002)).
2 Observations and data reduction
2.1 NOT observations
We observed the field of GRB 020305 from the ground with the 2.56-m Nordic Optical Telescope (NOT) on 2002 March 16.95–22.18 UT, i.e. 11.45–16.68 days after the GRB. The instrument used was the Andalucía Faint Object Spectrograph (ALFOSC) equipped with a pixel Loral CCD having a pixel scale of . The data were reduced using standard methods. The -band calibration was carried out observing the Landolt field PG1047+003 (Landolt Land92 (1992)) with the 3.58-m New Technology Telescope (NTT) on 2003 February 28.
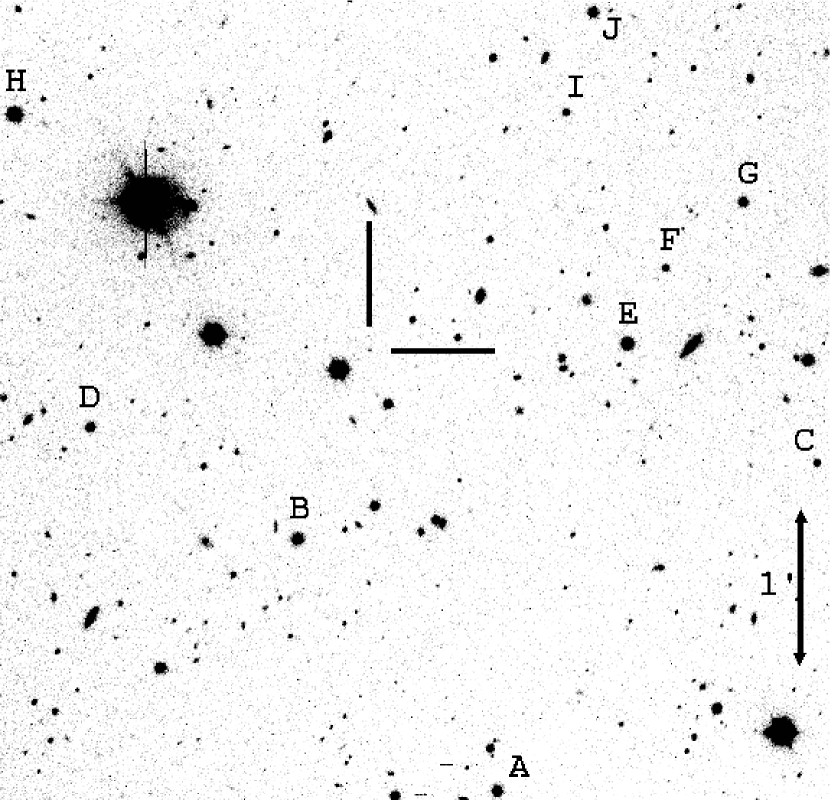
Fig. 1 shows an image of the optical afterglow (OA) and the positions of the secondary standard stars listed in Table LABEL:tablestandares. The mean celestial coordinates obtained from 6 NOT images are; R.A.(J2000)= , Dec(J2000)= . The astrometry is based on USNO A2.0 stars per image. The errors do not include the systematic uncertainty of the USNO A2.0 catalogue (; Assafin et al. Assa01 (2001)).
| ID | R.A.(J2000) | Dec(J2000) | |||||
|---|---|---|---|---|---|---|---|
| A | |||||||
| B | |||||||
| C | |||||||
| D | |||||||
| E | |||||||
| F | |||||||
| G | |||||||
| H | |||||||
| I | |||||||
| J |
| Date | Filter | Exp.Time | Mag. | Seeing |
| 2002 UT | (s) | |||
| NOT(+ALFOSC) | ||||
| Mar - | ||||
| Mar - | ||||
| Mar - | ||||
| Mar - | ||||
| Mar - | ||||
| Mar - | ||||
| Mar - | ||||
| Mar - | ||||
| HST(+STIS) | ||||
| Apr - | CL | - | ||
| Apr - | LP | - | ||
| Jun - | CL | - | ||
| Jun - | LP | - | ||
| Dec - | LP | - | ||
| Jan - | CL | - | ||
| Composed by 9 exposures of different durations. | ||||
| Composed by 6 exposures of different durations. | ||||
| 2003. | ||||
2.2 HST observations
From space the OA was observed using the Space Telescope Imaging Spectrograph (STIS) on the Hubble Space Telescope (HST). The HST observations were carried out clustered around three mean epochs; , and days after the GRB. In each of the three epochs two broad filters were used; the long-pass (LP) and the 50CCD clear (CL) filter. The journal of observations is displayed in Table LABEL:obs-journal.
The CCD gain was set to 1 /ADU and the read-out noise was 4.46 . The STIS images were preprocessed through the standard STIS pipeline and combined using the DITHER (v1.2) software (Fruchter & Hook Fruc02 (2002)) as implemented in IRAF (v2.11.3)/STSDAS (v2.1.1). The ‘pixfrac’ parameter was set to 0.7 and the output scale to pixel-1 (’scale’ parameter 0.5).
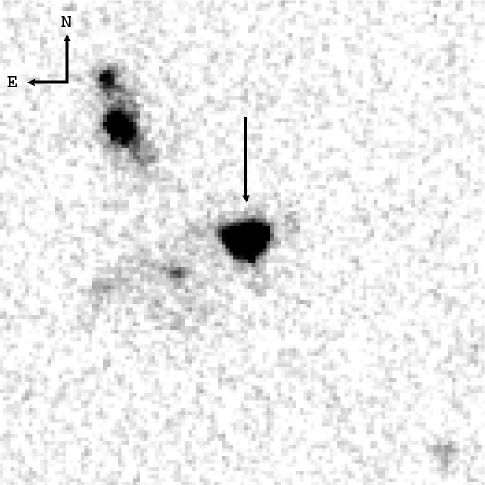
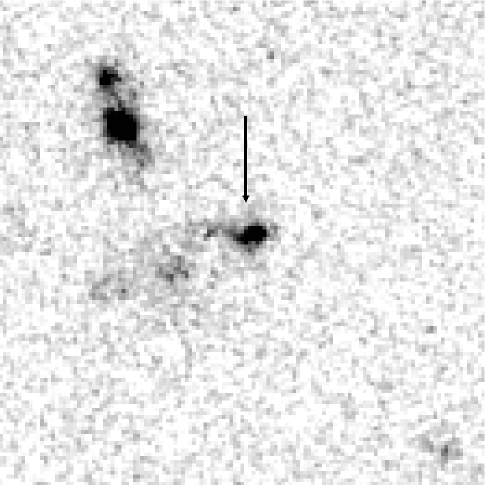
For both STIS filters the third epoch images were subtracted from the first and second epoch frames, allowing us to perform photometry of the OA with no contamination from the host galaxy. Aperture photometry was carried out with a small aperture radius of 4 drizzled pixels (), which gave the optimal signal-to-noise ratio. Then an aperture correction was applied for both filters based on the growth curve of the star 111STIS handbook http://www.stsci.edu/hst/stis- /documents/handbooks/, which has a similar colour to the OA. The use of other apertures yielded consistent aperture corrected magnitudes, implying that the assumed growth curve is suitable for the OA. Fig. 2 shows the OA fading as imaged by HST.
3 Results
3.1 The afterglow SED days after the burst
The optical multicolour imaging carried out during the first NOT observing night (March 16.950–17.226 UT, see Table LABEL:obs-journal) allowed us to construct the optical SED of the afterglow. Furthermore, including the -band detection of March 14.39 UT reported by Burud et al. (Buru02 (2002)) the SED was extended to the near-infrared (NIR). We have re-reduced and analysed the original -band data taken by Burud et al. (Buru02 (2002)). In order to enhance the signal-to-noise ratio we convolved the final image with the Point Spread Function (PSF) constructed using field stars. We obtained a value of consistent with the value of Burud et al. (Buru02 (2002); ).
The extended underlying flux distribution imposed a seeing-dependent host galaxy subtraction. Thus, for the images acquired in seeing conditions above , the flux of the host plus the companion galaxy (see Fig. 2) was subtracted. We note that the seeing values of the observations by Burud et al. (Buru02 (2002)), Ohyama et al. (Ohya02 (2002)) and Lee et al. (Lee02 (2002)) were; , and , respectively (Priv. Comm.). The determination of the -band magnitudes for the host and the companion galaxy was based on the -band magnitudes and the power-law spectral indexes reported in Sect. 3.4.
The mentioned optical/NIR data where extrapolated in time to a common epoch of March 17.0 UT, assuming a power-law lightcurve (). Two different values of the decay index () were used for the and for the optical bands. Given that the -band measurement was carried out before the rebrightening, the value was obtained assuming a power-law stretch connecting the -band point by Ohyama et al. (Ohya02 (2002)) with our -band magnitude of March 16.993–17.039 UT, yielding . For the rest of bands () the adopted value of was obtained based on our -band measurements of March 16.993–17.039 UT and March 18.960–19.040 UT, implying . Thus, the -band flux extrapolation was performed assuming a slow fading, whereas the -band fluxes were shifted in time adopting a rising lightcurve. In any case, considering that the data points were taken close from March 17.0 UT, the final SED is basically insensitive to the assumed value.
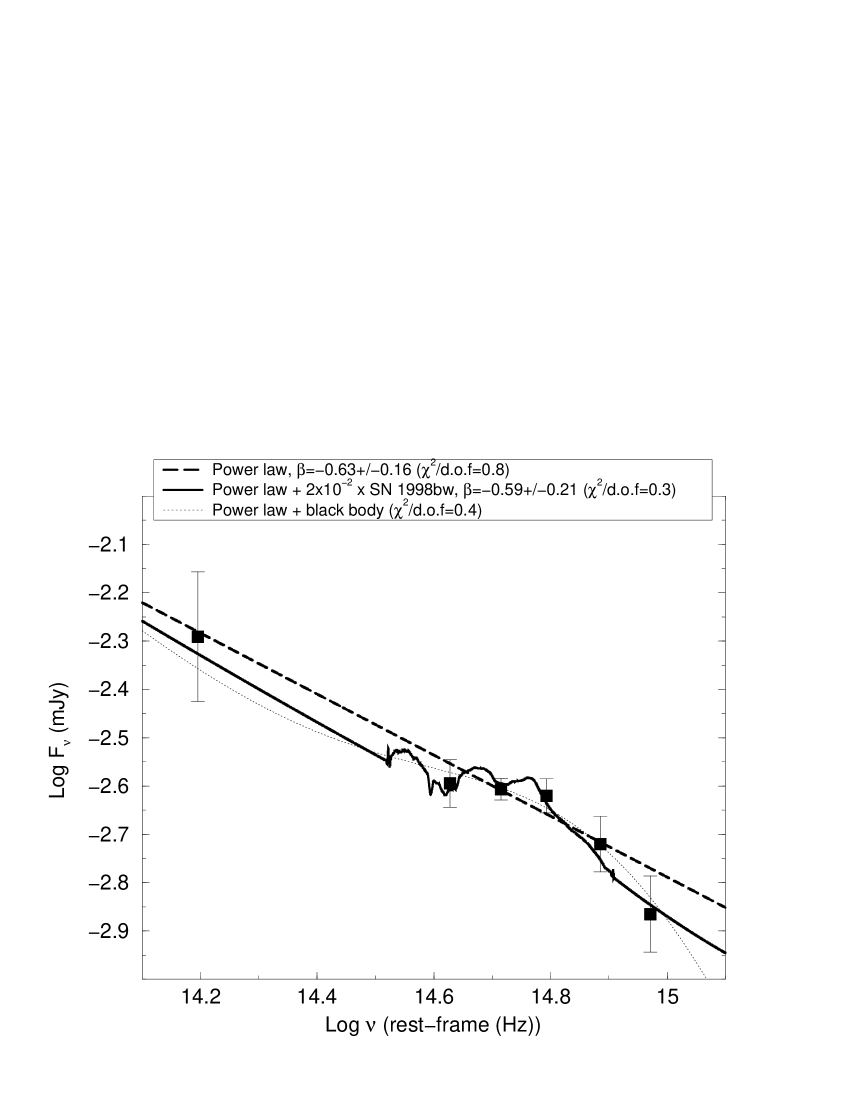
The magnitudes have been transformed to flux densities following the conversion factors given by Fukugita et al. (Fuku95 (1995)) and Allen (Alle00 (2000)) for the optical and NIR bands respectively. The fluxes were subsequently corrected for foreground Galactic extinction, which amounts to according to Schlegel et al. (Sche98 (1998)). The derived SED can be seen in Figs. 3 and 4. The SED is formally consistent with a power-law () but there is tentative evidence for deviations away from a power-law, most notably an -band decrement.
The mere NOT -band detection imposes an upper limit to the redshift. Applying a Lyman forest blanketing model to the pure power-law SED fit (Madau Mada95 (1995)), and convolving it with the ALFOSC -band and CCD sensitivity curves, we derived an upper limit of . This is inconsistent with the reported pseudo redshift based on the high energy properties of the GRB (, Atteia Atte03 (2003)).
3.2 The -band lightcurve
The combination of the NOT and HST observations (see Sect. 3.3) presented here and data points from other authors (Lee et al. Lee02 (2002); Ohyama et al. Ohya02 (2002)) allowed to us to construct the -band lightcurve of the OA. The -band magnitudes reported by Ohyama et al. (Ohya02 (2002)) have been shifted to our photometric zero point (Kosugi Kosu03 (2003)). The data point by Price et al. (Pric02 (2002)) has not been included due to lack of information on the photometric system (their detection is based on unfiltered images) and the unreported error-bar.
The resulting OA lightcurve (see Fig. 5) can not be described using only a power-law (; ). The poor fit is due to the fast decay between the first two HST epochs and especially because of the lightcurve bump present 12 – 16 days after the GRB.
3.3 The late time decay
The first two HST epochs imply a fast decay. A power-law fit leads to decay slopes of and . Extrapolating this decay to the third epoch, afterglow magnitudes of and (AB system) are predicted. This is consistent with the fact that no obvious point source emission is seen at the position of the afterglow in the third epoch images. For the third epoch images the peak flux of the mean azimuthal host galaxy profiles at the afterglow position are equivalent to and . These magnitudes can be considered as conservative upper limits of the OA contribution in the third HST epoch and have been included in Table LABEL:obs-journal.
The broad STIS CL and LP filters only allow a rough determination of the OA colour. In order to estimate the colours of the two first HST observations, the CL and LP magnitudes have been rescaled to April 13.5 UT and June 16.5 UT using the above calculated decay indexes (, ). In any case, the first four HST visits are well clustered around the two mentioned epochs, so the magnitude shifts are mag. The colours are and , on April 13.5 UT and June 16.5 UT, respectively (uncorrected for Galactic extinction). This is consistent () with an achromatic decay between 39 and 103 days after the GRB.
The HST magnitudes on April 13.5 UT and June 16.5 UT can be transformed to the Vega system using the LP and CL filter throughputs implemented in the SYNPHOT package of IRAF yielding (April 13.5 UT) and (June 16.5 UT).
3.4 The host galaxy
The HST observations revealed an extended galaxy () coincident with the OA position (see Fig. 2). The integrated CL and LP magnitudes (measured in the third epoch observations) of the host are and , corresponding to a Vega -band magnitude of . The photometry was performed with SExtractor using the automatic aperture magnitude (MAG_AUTO), which is suitable to measure the total flux of extended objects (Bertin & Arnouts Bert96 (1996)). The STIS host magnitudes correspond to a spectral index (dereddened for Galactic extinction).
The HST imaging also revealed another extended source located northeastwards from the host (see Fig. 2). The magnitudes of this galaxy are and , corresponding to in the Vega system. The inferred spectral index, , is similar to that of the host galaxy.
4 Discussion
A natural interpretation of the lightcurve and the SED would be the existence of a SN component present weeks after the GRB. Given the limited number of measurements in the lightcurve/SED, and the unknown redshift, the space of SN-like lightcurve/SED solutions (determined by , the SN amplitude, the stretching factor, and the temporal offset between the SN and GRB) is highly degenerate. Hence, we will only attempt to demonstrate existence and not uniqueness of possible SN fits to our data. For simplicity we decided to fix the stretching factor to 1 and to assume that the GRB event was simultaneous to the SN. Moreover, the blue colour of the OA suggests that the host galaxy extinction can not be high, so we considered no host galaxy extinction ().
4.1 Possible SN interpretations
4.1.1 The SED
The SED around 17.0 March UT shows a blue optical afterglow (, , , , corrected for Galactic extinction), in comparison to the mean colours measured for other optical afterglows (, , ; imon et al. Simo01 (2001)).
In order to fit our optical/NIR SED, we considered two spectroscopic templates; SN 1998bw (moderately blue, Patat et al. Pata01 (2001)) and SN 1998S (very blue, Fassia et al. Fass01 (2001)). The fitted expression is given by; , where is the SN template at the GRB redshift and an amplitude. As shown in Fig. 3, a dimmed SN 1998bw template at improves the quality of the fit with respect to the pure power-law ( vs. ), yielding a spectral index . However, at the SN 1998bw amplitude has to be dimmed by a factor of to reach the observed optical flux level, implying a -band absolute peak magnitude of: . This would imply a very subluminous type Ic SN (e.g., Richardson et al. Rich02 (2002)). The moderately blue SN 1998bw template is unable to reproduce the observed blue SED beyond . We note that the SN 1998bw spectrum was extended in the Å rest-frame UV domain adopting a power-law spectrum as previously assumed by other authors (Bloom et al. Bloo99 (1999); Lazzati et al. Lazz01 (2001)).
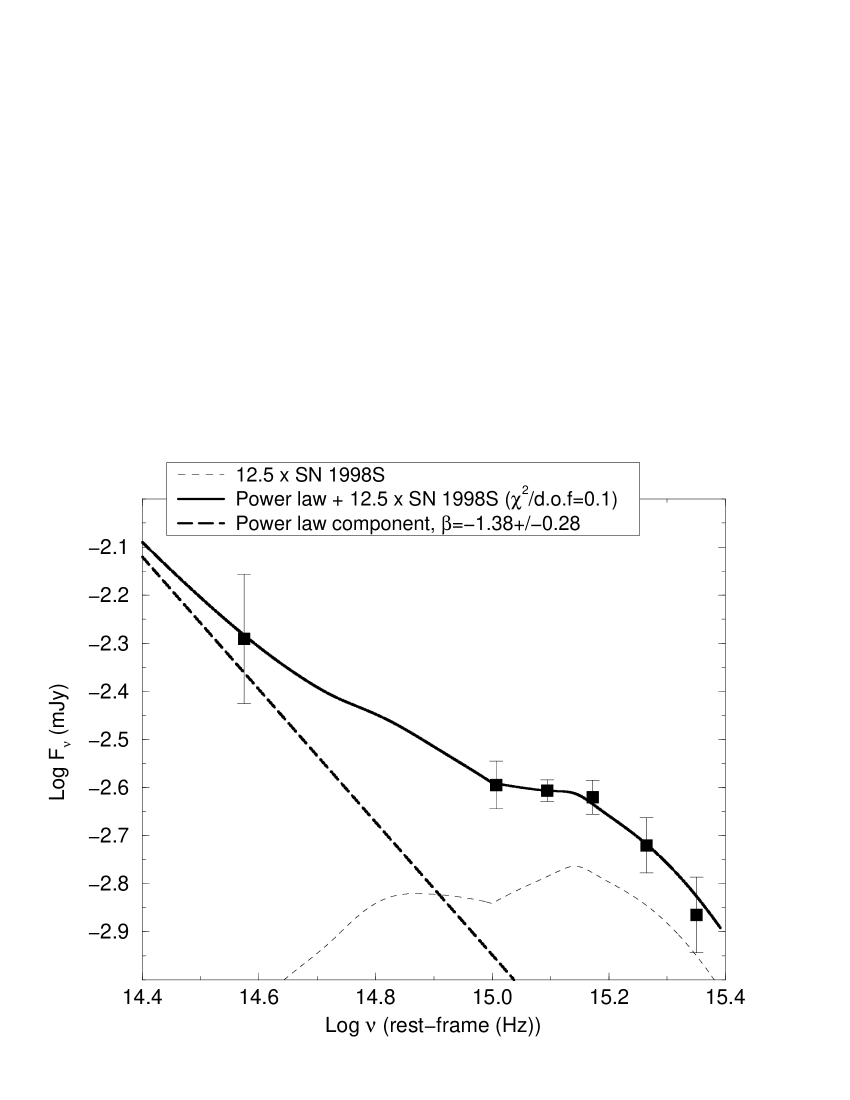
The UV rest-frame flux of SN 1998S has been obtained combining HST(+STIS) observational spectra (Lentz et al. Lent01 (2001)) and black body extensions to the optical spectra (Fassia et al. Fass01 (2001)). The black body temperatures have been obtained interpolating in time the SN 1998S photospheric temperatures (Anupama et al. Anup02 (2001); Fassia et al. Fass00 (2000)).
With the bluer SN 1998S template it is possible to fit the SED at larger redshifts. The best fit based on SN 1998S is reached at , where the fit quality is considerably improved in comparison to the pure power-law fit ( vs. , see Fig. 4). In this case the derived spectral index is . The amplitude of the best fit is times SN 1998S, which implies (see Fig. 4). To our knowledge only the exceptionally bright Ic-type SN 1999as has reached such high luminosity (; Hatano et al. Hata01 (2001)).
Therefore, both a low redshift and a high redshift SN scenario are able to fit the blue and bumpy optical/NIR SED around March 17.0 UT. Note that we do not exclude SN solutions based on SNe at intermediate redshifts (i.e., ).
Two additional complementary arguments support a substantial SN flux contribution around 11.5 days after the burst: i) The colours of the afterglow roughly agree with the ones measured for several blue SNe close to their lightcurve peaks: SN 1993J (Richmond et al. Rich94 (1994)), SN 1998S (Fassia et al. Fass01 (2001)), ii) at low redshift the addition of a black body term to the power-law spectrum improves the fit ( vs. , see Fig. 3), yielding rest-frame temperatures of K, compatible with the high photospheric temperatures measured in SNe. This scenario resembles the SED of the low redshift GRB 011121 at days (being the epoch of the gamma-ray event), which was reproducible with a black body template having a temperature of K (Greiner et al. Grei03 (2003)).
4.1.2 The lightcurve
We have based our lightcurve study on three type Ic templates (SN 1998bw: Galama et al. Gala98 (1998), McKenzie & Schaefer McKe99 (1999); SN 1994I: Lee et al. Lee95 (1995), Richmond et al. Rich96 (1996), Tsvetkov & Pavlyuk Tsve95 (1995); SN 2002ap: Foley et al. Fole03 (2003), Yoshii et al. Yosh03 (2003), Gal-Yam et al. GalY02 (2002), Mattila & Meikle Mati02 (2002), Hasubick Hasu02 (2002)) and one type II SN (SN 1998S: Fassia et al. Fass00 (2000), Li et al. Li02 (2002), Liu et al. Liu00 (2000), Schaefer & Roscherr Scha98 (1998)).
In Fig. 5 we have overplotted the lightcurves of these SNe on our -band data points. The SN 1998bw and SN 1998S lightcurves have been dimmed by a similar factor to the one needed to fit the SEDs (Figs. 3 and 4, respectively). At low redshift SN 1998bw and SN 2002ap fit the peak reasonably well, but the fast decay SN 1994I provides the best match being the only one able to explain the first HST data point. We note that SN 1994I-like lightcurves also provide good fits for the lightcurves of GRB 021211 (Della Valle et al. Dell03 (2003)) and XRF 030723 (Fynbo et al. Fynb04 (2004)).
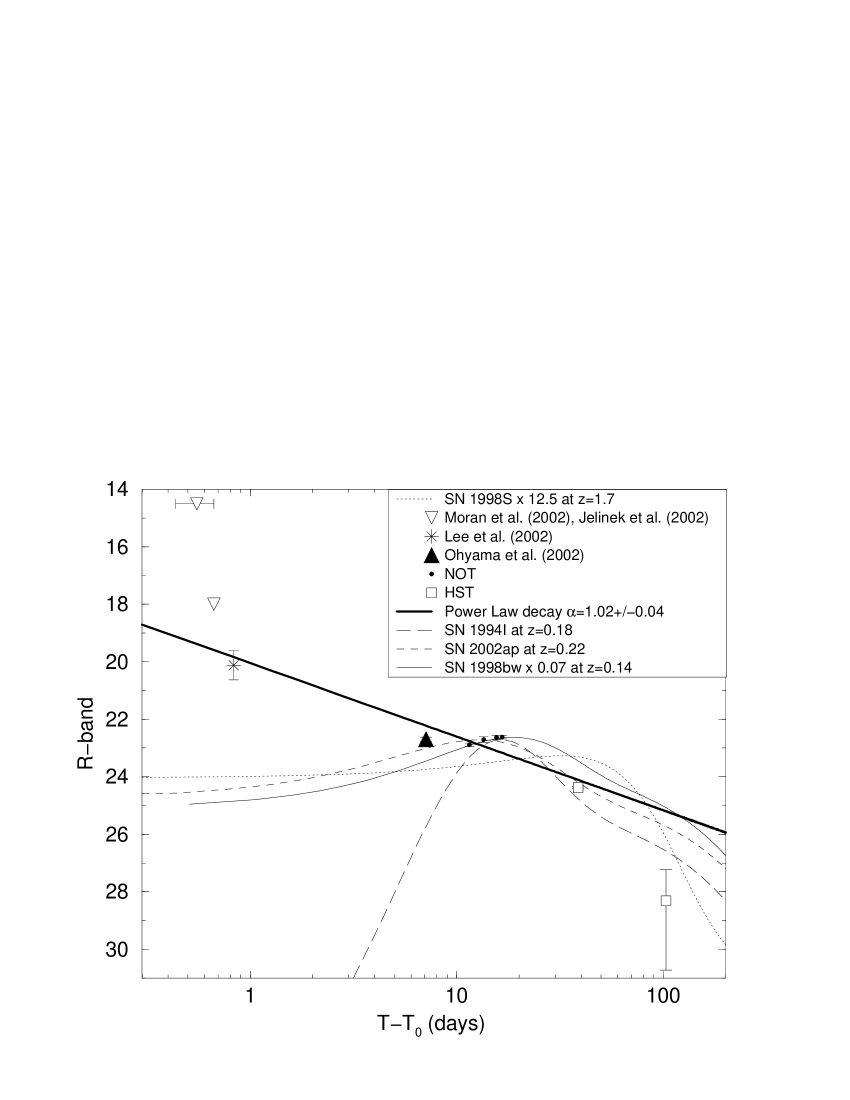
The SN 1998S lightcurve redshifted to peaks too late ( days) and is therefore highly inconsistent with the -band data points. Lower redshifts provide better fits for all templates, but the late time fast decay (given by the two HST points) is difficult to fit at any redshift. Even with a SN 1994I template at low redshift the second HST data point is not well fitted. However, a break in the afterglow lightcurve would yield a lower total (SN + afterglow) flux at the second HST epoch, hence leading to a better fit. From the lightcurve peak epoch we conclude that a high redshift SN scenario seems unlikely.
4.2 A SN-less interpretation
An alternative interpretation of the -band SED decrement is based on the redshifted 2175 Å broad absorption bump. In this framework the SED shape is not the result of a SN, but rather the result of features in the extinction law. The 2175 Å bump is prominent in the Milky Way (MW), moderate in the Large Magellanic Could (LMC) and almost undetectable in the Small Magellanic Cloud (SMC). In order to test this possibility, the flux densities corresponding to our data points were fitted with an expression in the form; , where is the extinction in magnitudes at rest-frame frequency . We have considered the three extinction laws given by Pei (Pei92 (1992)), i.e., for the MW, LMC and SMC. has been parametrised in terms of , so the fit determines and simultaneously. Given that the OA distance is unknown, the redshift has been ranged from to .
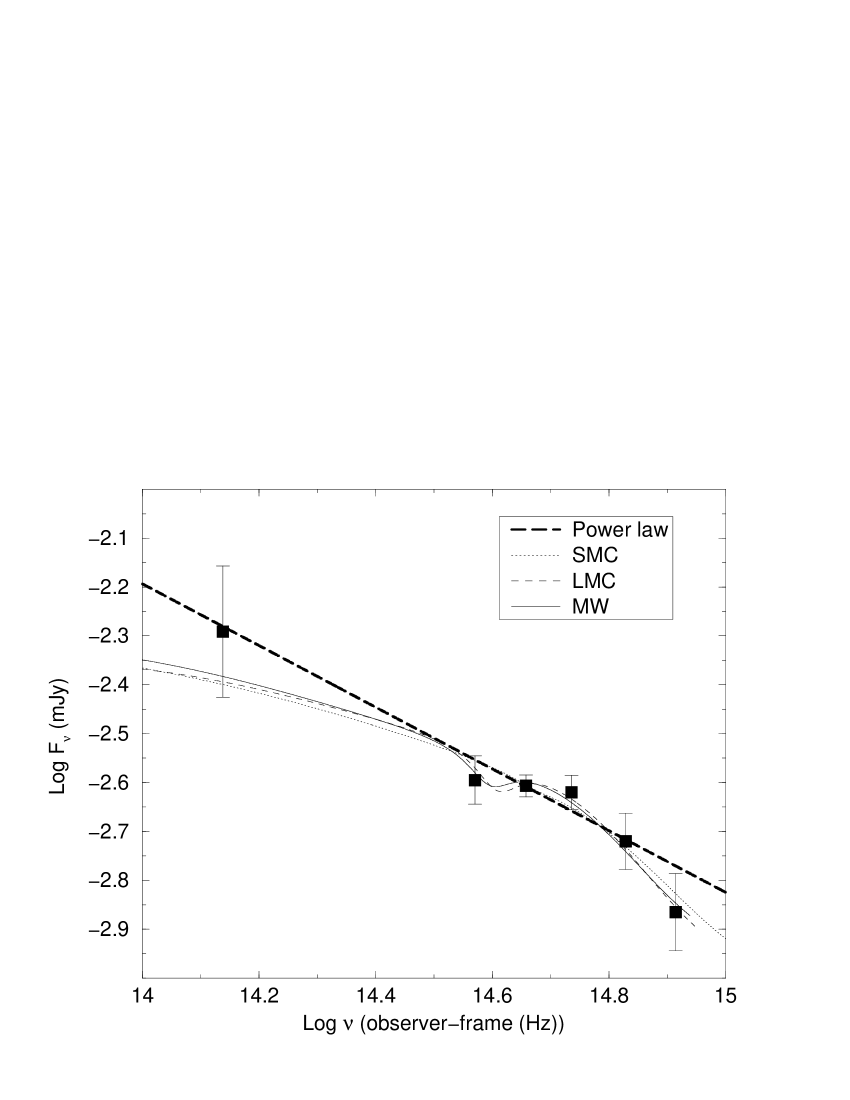
Table LABEL:NoSNSED1 shows that the best fit solution () is reached with a MW extinction law at , consistent with a power-law spectrum with and an extinction (see Fig. 6). The MW is the only extinction law providing a spectral index fully consistent (within error bars) with , and therefore agrees with the values measured in OAs to date. For the MW any redshift in the range provides values of .
However, this interpretation “per se” can not account for the simultaneous rebrightening of the lightcurve 12–16 days after the burst, being necessary an additional mechanism to explain it. One possible solution would be to describe the lightcurve bump in the context of the two-component jet model, invoked to interpret the rebrightenings measured in GRB 030329 (Berger et al. Berg03 (2003)) and XRF 030723 (Huang et al. Huan04 (2004)).
This scenario is opposite to the OA SEDs measured to date, where for all cases the metal-rich MW extinction law gives poor fits (Jensen et al. Jens01 (2001); Fynbo et al. Fynb01 (2001); Holland et al. Holl03 (2003); Jakobsson et al. Jako04 (2004)). Thus, we consider this interpretation less likely than the SN interpretation, however it can not be excluded.
| Ext. Law | ||||
|---|---|---|---|---|
| SMC | ||||
| LMC | ||||
| MW |
5 Conclusions
In this paper optical ground-based and HST imaging have been reported for the GRB 020305 afterglow. The HST imaging revealed an extended host galaxy with , which might be part of an interacting system.
The lightcurve of the afterglow, constructed with our data and with data of other authors, shows a rebrightening days after the GRB. On the other hand, the -band SED constructed around the time of the expected SN peak shows a blue and bumpy SED which might deviate from the power-law fit with . The afterglow -band detection imposes an upper limit to the GRB redshift of , inconsistent with previous redshift estimates (Atteia Atte03 (2003)).
We have considered several interpretations that may account simultaneously for the lightcurve rebrightening and the bumpy blue spectral energy distribution. The most natural scenario is based on a SN associated to the GRB.
Our -band SED can not precisely constrain the redshift of the GRB. Both a low () and a high redshift () SN solutions can match the SED reasonably well. The high redshift scenario has the (only) advantage of being able to explain easily the low host galaxy luminosity, which seems unlikely for . However, the high redshift scenario requires an extraordinarily bright SN (). Contrary to this, the absolute peak magnitude derived in the low redshift SN solution is more realistic, especially given that the fraction of SNe that are subluminous () appears to be higher than (Richardson et al. Rich02 (2002)). Furthermore, the high redshift SN scenario is not able to fit the -band lightcurve, and especially around the rebrightening. In conclusion, we consider the low redshift SN scenario the most likely interpretation of the data.
If the GRB 020305 SED/lightcurve bumps have a SN origin, then our data would support the diversity of the SNe related to GRBs, since the extensively used SN 1998bw template does not necessarily yield the best fits.
In an alternative SN-less interpretation the bumpy SED is the result of structure present in the extinction curve. A fit with a MW-like extinction law leads to an estimated redshift of . This interpretation can not naturally describe the simultaneous lightcurve rebrightening, requiring an extra explanation for the lightcurve bump (given for instance by the two-component jet model), and hence we consider it less likely than the SN interpretations.
The determination of the host galaxy redshift, either via a deep spectrum or based on a photometric redshift would drastically reduce the many free parameters of the present study.
Acknowledgements.
Some of the data presented here have been taken using ALFOSC, which is owned by the Instituto de Astrofísica de Andalucía (IAA) and operated at the Nordic Optical Telescope under agreement between IAA and the Niels Bohr Institute. We are grateful to the staff at the Nordic Optical Telescope for excellent support. This work is supported by the Danish Natural Science Research Council (SNF). We acknowledge D.L. Tucker, B.C. Lee, and G. Kosugi for valuable information on the seeing conditions and the calibration stars used by Ohyama et al. (Ohya02 (2002)). Support for Proposal GO 9074 was provided by NASA through a grant from the Space Telescope Science Institute, which is operated by the Association of Universities for Research in Astronomy, incorporated under NASA contract NAS5-26555. This research is partially supported by the Spanish Ministry of Science and Education through programmes ESP2002-04124-C03-01 and AYA2004-01515 (including FEDER funds). We thank our anonymous referee for useful and constructive comments.References
- (1) Allen, C.W. 2000, Allen’s Astrophysical Quantities, 4th edition, ed. A. N. Cox
- (2) Anupama, G.C., Sivarani, T., & Pandey, G. 2001, A&A 367, 506
- (3) Assafin, M., Andrei, A.H., Vieira Martins, R., et al. 2001, ApJ, 552, 380
- (4) Atteia, J.-L. 2003, A&A, 407, L1
- (5) Berger, E., Kulkarni, S.R., Pooley, G., et al. 2003, Nature, 426, 154
- (6) Bertin, E., & Arnouts, S. 1996, A&AS, 117, 393
- (7) Bloom, J.S., Kulkarni, S.R., Djorgovski, S.G., et al. 1999, Nature, 401, 453
- (8) Burud, I., Rhoads, J., Fruchter, A., & Griep, A. 2002, GCN Circ., 1283
- (9) Dado, S., Dar, A., & De Rújula, A. 2003, ApJL, 594, L89
- (10) Della Valle, M., Malesani, D., Benetti, S., et al. 2003, A&A, 406, L33
- (11) Fassia, A., Meikle, W.P.S., Vacca, W.D., et al. 2000, MNRAS, 318, 1093
- (12) Fassia, A., Meikle, W.P.S., Chugai, N., et al. 2001, MNRAS, 325, 907
- (13) Foley, R.J., Papenkova, M.S., Swift, B.J., et al. 2003, PASP, 115, 1220
- (14) Fruchter, A.S., & Hook, R.N. 2002, PASP, 114, 144
- (15) Fryer, C.L., & Heger, A. 2004, submitted to ApJ [arXiv:astro-ph/0412024]
- (16) Fukugita, M., Shimasaku, K., & Ichikawa, T. 1995, PASP, 107, 945
- (17) Fynbo, J.P.U, Gorosabel, J., Dall, T.H., et al. 2001, A&A, 373, 796
- (18) Fynbo, J.P.U, Sollerman, J., Hjorth, J., et al. 2004, ApJ, 609, 962
- (19) Galama, T.J., Vreeswijk, P.M., van Paradijs, J., et al. 1998, Nature, 395, 670
- (20) Gal-Yam, A., Ofek, E.O., & Shemmer, O. 2002, MNRAS, 332, L73
- (21) Germany, L.M., Reiss, D.J., Sadler, E.M., Schmidt, B.P., & Stubbs, C.W. 2000, ApJ, 533, 320
- (22) Greiner, J., Klose, S., Salvato, M., et al. 2003, ApJ, 599, 1223
- (23) Hasubick, W. 2002, IAU Circ., 7820
- (24) Hatano, K., Branch, D., Nomoto, K., et al. 2001, 198th AAS Meeting, #39.02; Bulletin of the American Astronomical Society, Vol. 33, p.838
- (25) Hjorth, J., Sollerman, J., Møller, P., et al. 2003, Nature, 423, 847
- (26) Holland, S.T., Weidinger, M., Fynbo, J.P.U., et al. 2003, AJ, 125, 2291
- (27) Huang, Y.F., Wu, X.F., Dai, Z.G., Ma, H.T., & Lu, T. 2004, ApJ 605, 300
- (28) Hurley, K., Cline, T., Ricker, G., et al. 2002, GCN Circ., 1263
- (29) Jakobsson, P., Hjorth, J., Fynbo, J.P.U., et al. 2004, A&A, 427, 785
- (30) Jelinek, M., Kubanek, P., Nekola, M., et al. 2002, GCN Circ., 1265
- (31) Jensen, B.L., Fynbo, J.P.U., Gorosabel, J., et al. 2001, A&A, 370, 909
- (32) Kosugi, G. 2003, priv. comm.
- (33) Landolt, A.U. 1992, AJ, 104, 340
- (34) Lazzati, D., Covino, S., Ghisellini, et al. 2001, A&A, 378, 996
- (35) Lee, M.G., Kim, E., Kim, S.C., et al. 1995, JKAS, 28, L31
- (36) Lee, B.C., Lamb, D.Q., Tucker, D.L., et al. 2002, GCN Circ., 1275
- (37) Lentz, E.J., Baron, E., Lundqvist, P., et al. 2001, ApJ 547, 406
- (38) Li, W., Filippenko, A.V., van Dyk, S.D., et al. 2002, PASP, 114, 403
- (39) Liu, Q.-Z., Hu, J.-Y., Hang, H.-R., et al. 2000, A&AS, 144, 219
- (40) Madau, P. 1995, ApJ, 441, 18
- (41) Mattila, S., & Meikle, P. 2002, IAU Circ., 7820
- (42) McKenzie, E.H., & Schaefer, B.E. 1999, PASP, 111, 964
- (43) Moran, J., Nysewander, M., Shella, K., et al. 2002, GCN Circ., 1264
- (44) Ohyama, Y., Yoshida, M., Kawabata, K.S., et al. 2002, GCN Circ., 1271
- (45) Patat, F., Cappellaro, E., Danziger, J., et al. 2001, ApJ, 555, 900
- (46) Pei, Y.C. 1992, ApJ, 395, 130
- (47) Price, P.A., Fox, D.W., et al. 2002, GCN Circ., 1267
- (48) Richardson, D., Branch, D., Casebeer, D., et al. 2002, AJ, 123, 745
- (49) Ricker, G., Atteia, J.-L., Kawai, N., et al. 2002, GCN Circ., 1262
- (50) Rigon, L., Turatto, M., Benetti, S., et al. 2003, MNRAS, 340, 191
- (51) Richmond, M.W., Treffers, R.R., Filippenko, A.V., et al. 1994, AJ, 107, 1022
- (52) Richmond, M.W., van Dyk, S.D., Ho, W., et al. 1996, AJ, 111, 327
- (53) Schaefer, B.E., & Roscherr, B. 1998, IAU Circ., 7058
- (54) Schlegel, D.J., Finkbeiner, D.P., & Davis, M. 1998, ApJ, 500, 525
- (55) Stanek, K.Z., Matheson, T., Garnavich, P.M., et al. 2003, ApJ, 591, L17
- (56) imon, V., Hudec, R., Pizzichini, G., & Masetti, N. 2001, A&A, 377, 450
- (57) Tsvetkov, D.Yu., & Pavlyuk, N.N. 1995, AstL, 21, 606
- (58) Woosley, S.E. 1993, ApJ, 405, 273
- (59) Yoshii, Y., Tomita, H., Kobayashi, Y., et al. 2003, ApJ, 592, 467
- (60) Zeh, A., Klose, S., & Hartmann, D.H. 2004, ApJ, 609, 952