A low-absorption disk zone at low Galactic latitude in Centaurus
We investigate the properties of two stellar concentrations in a low-absorption disk zone in Centaurus, located respectively at , , and , . The present analysis is based mostly on 2MASS photometry, as well as optical photometry. Based on colour-magnitude diagrams and stellar radial density profiles, we show that these concentrations are not open star clusters. Instead, they appear to be field stars seen through a differentially-reddened window. We estimate that the bulk of the stars in both stellar concentrations is located at kpc from the Sun, a distance consistent with that of the Sgr-Car arm in that direction. This low-absorption window allows one to probe into distant parts of the disk besides the Sgr-Car arm, probably the tangent part of the Sct-Cru arm, and/or the far side of the Sgr-Car arm in that direction. The main sequence associated to the Sgr-Car arm is reddened by , so that this window through the disk is comparable in reddening to Baade’s window to the bulge. We also investigate the nature of the open cluster candidate Ru 166. The presently available data do not allow us to conclude whether Ru 166 is an actual open cluster or field stars seen through a small-scale low-absorption window.
Key Words.:
Galaxy: structure: stellar content: general1 Introduction
Low-absorption zones are fundamental for optically probing distant parts of the Galaxy in order to understand its structure, abundance and kinematics. Baade’s (Baade1946 (1946)) window has played a major role in the studies of the Galactic bulge (e.g. Terndrup Tern1988 (1988) and McWilliam & Rich MWR1994 (1994)). In addition to Baade’s window two other low-absorption bulge windows, Sgr I and Sgr II, have been described in Baade (Baade1963 (1963)) and Lloyd Evans (LLE1976 (1976)). More recently, Dutra, Santiago & Bica (DSB2002 (2002)) identified a more centrally located window in the bulge whose position makes it a potential source of information complementary to Baade’s window.
Along the Milky Way, it would be valuable to isolate low-absorption windows at low galactic latitudes to sample more distant parts of the disk, e.g. for optical abundance studies of hot stars (Daflon et al. DCS2001 (2001), DCS2003 (2003), and Mathys et al. Mathys2002 (2002)).
The present target direction () has been studied in Galactic structure surveys (Georgelin & Georgelin GG1976 (1976); Russeil Rus2003 (2003)). This direction crosses the Sgr-Car arm at 1.6 kpc from the Sun, and tangentially intercepts the Sct-Cru arm at 6.6 kpc, and finally crosses the far side of the Sgr-Car arm at 12 kpc. To the south of the studied region, there occurs the extended diffuse H ii region Cederblad 122, also know as m Centauri nebula (Georgelin & Georgelin GG1970 (1976)). Note that the star m Centauri (HD 116243) is a close-by G 6 II star, at a distance to the Sun of 79 pc according to SIMBAD, thus unrelated to the nebula. The presence of an emission nebula, revealing star formation, projected close to the direction we are studying is important, since our target region might be an overall star-forming region in the Sgr-Car spiral arm (or an association). The emission nebula has a kinematic distance of 1.75 kpc, thus compatible with the Sgr-Car arm. The central coordinates of this nebula are and and J2000.0 and .
We analyze in the present study a high stellar surface density region encompassing , which detaches in Sky Survey plates and can be seen in wide-angle Milky Way photographs in Centaurus. The central coordinates of this region are J2000.0 and , which correspond to and . Low absorption in the region had already been reported (FitzGerald Fitz68 (1968)), where it was found that the excess is largely or less to kpc. The main goal of the present paper is to unveil the nature of this region, whether it is a star cluster or association resulting from an enhanced star-formation event and/or a low-absorption zone (window). This kind of analysis has become possible with the advent of the Two Micron All Sky Survey (2MASS, Skrutskie et al. 2mass (1997)) photometry, whose uniformity and spatial coverage allow one to probe large areas in the sky using the near-infrared.
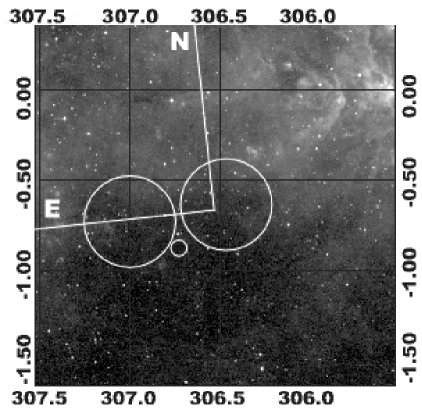
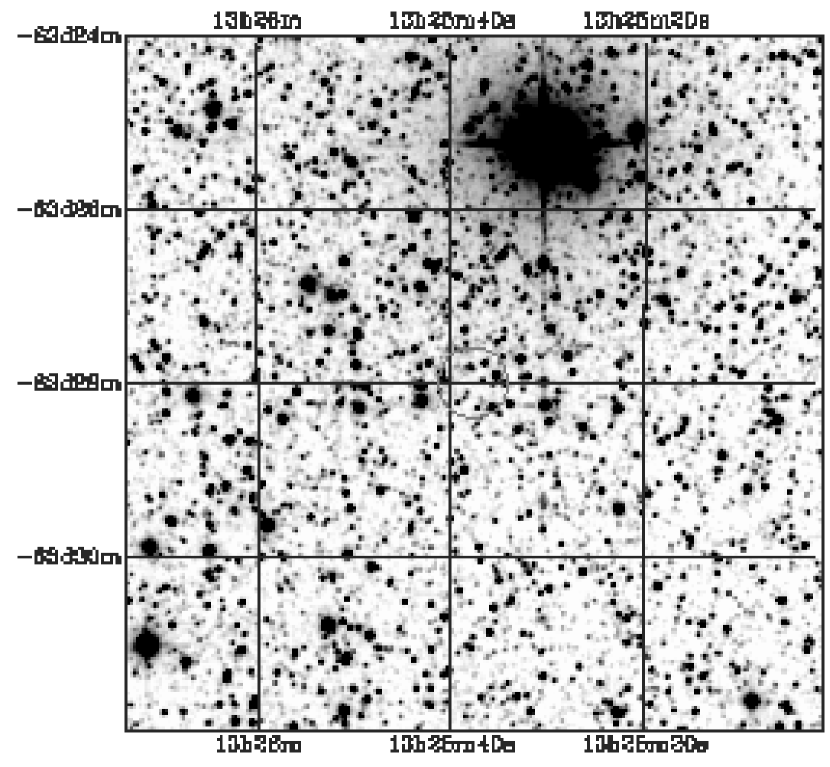
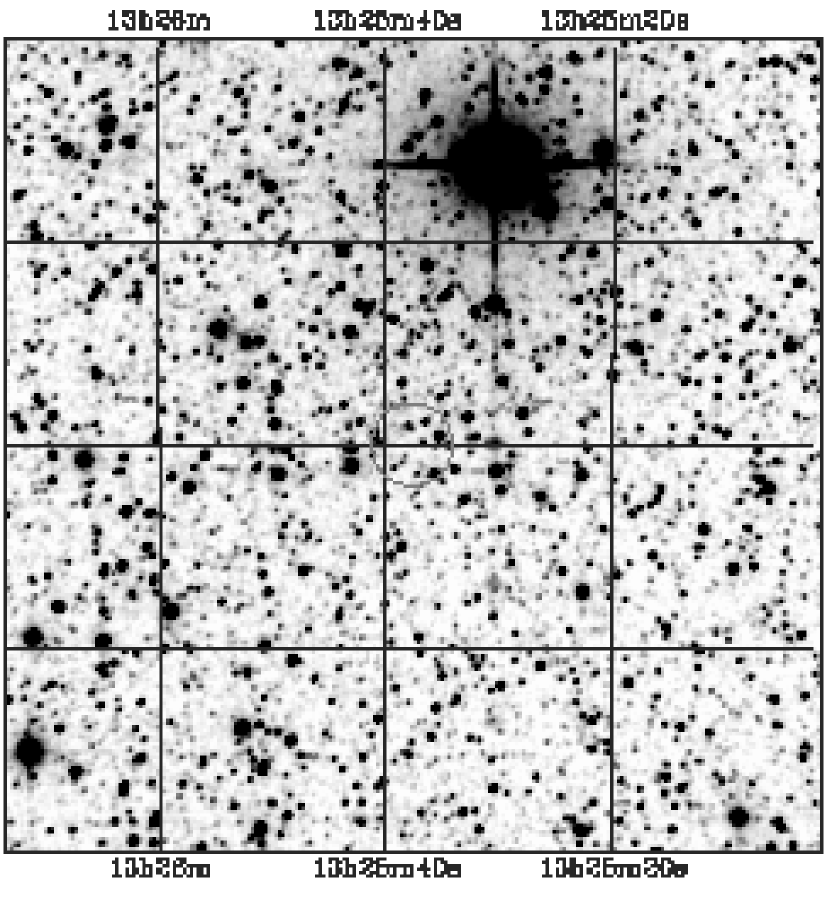
In the target area there are two conspicuous stellar concentrations located at J2000.0 (, ) and (, ). Optically they resemble rich star clusters, in particular due to the contrast in stellar surface density between the central concentrations and surroundings (Fig. 1). We study in detail these two regions by means of colour-magnitude diagrams (CMDs) and radial density of stars. Considering the positions and optical appearance, they might be identified as NGC 5120 and NGC 5155, originally described as rich star clusters in the New General Catalogue (Dreyer 1888). Note that the original coordinates (precessed to J2000.0) are shifted by and towards SE, respectively for NGC 5120 and NGC 5155; however, their angular diameters of basically encompass the shifts. We also point out that NGC 5120 has been identified as the open cluster candidate Ruprecht 166 (hereafter Ru 166) or as ESO 96-SC 11 (Lauberts Lau1982 (1982)). In the latter study, NGC 5155 has been identified as the small concentration of stars ESO 96-SC 13.
An alternative designation for features resembling field windows was introduced by Dutra et al. (2002) which includes the galactic longitude and latitude in the name. Accordingly, hereafter the first feature described above will be designated as and the second as . For practical reasons we refer to them as windows, in the sense of a case similar to that of Baade’s window. Indeed, and are surrounded by dark nebulae such as H 304.7-0.3 to the West, H 306.2-0.3, Fest-1 239, H 306.9-0.1 to the North, Fest-1 245 and H 307.2-1.0 to the East, and Fest-2 168 to the South (Dutra & Bica DB2002 (2002) and references therein).
We employ in the present study near-infrared photometry from 2MASS as well as optical data from the Guide Star Catalogue to explore the nature of and . In Section 2 we present the data extraction from optical and infrared databases, discuss the near-infrared CMDs, the radial density profiles and estimate parameters for the features and . In Sect. 3 we investigate the nature of the open cluster candidate Ru 166, which is located midway and slightly south of the features and (Fig. 1). Concluding remarks are given in Sect. 4.
2 The nature of the W 306.5-0.6 and W 307.0-0.7 features
We investigate the nature of and by means of optical and near-infrared images, radial density profiles and CMDs.
2.1 Optical data
In the optical we are interested in the detection of as many stars as possible within the sampled regions. We employed the Guide Star Catalogue (GSC111http://www-gsss.stsci.edu/gsc/GSChome.htm, version 2.2) to extract the positions of all stars contained within an area with in radius centered midway between and . As a result, we obtained the positions and magnitudes of 334 424 stars, including all the available bands in the Guide Star Catalogue.
We show in Fig. 1 (top panel) a GSC II map with dimensions of the region containing the features and . At first glance, these structures resemble actual star clusters, in particular by the contrast in the stellar surface density between both features and surrounding regions. Note that there appears to be a non-uniformity in the GSC sampling of stars, since the lower third of the GSC image () is systematically less dense.

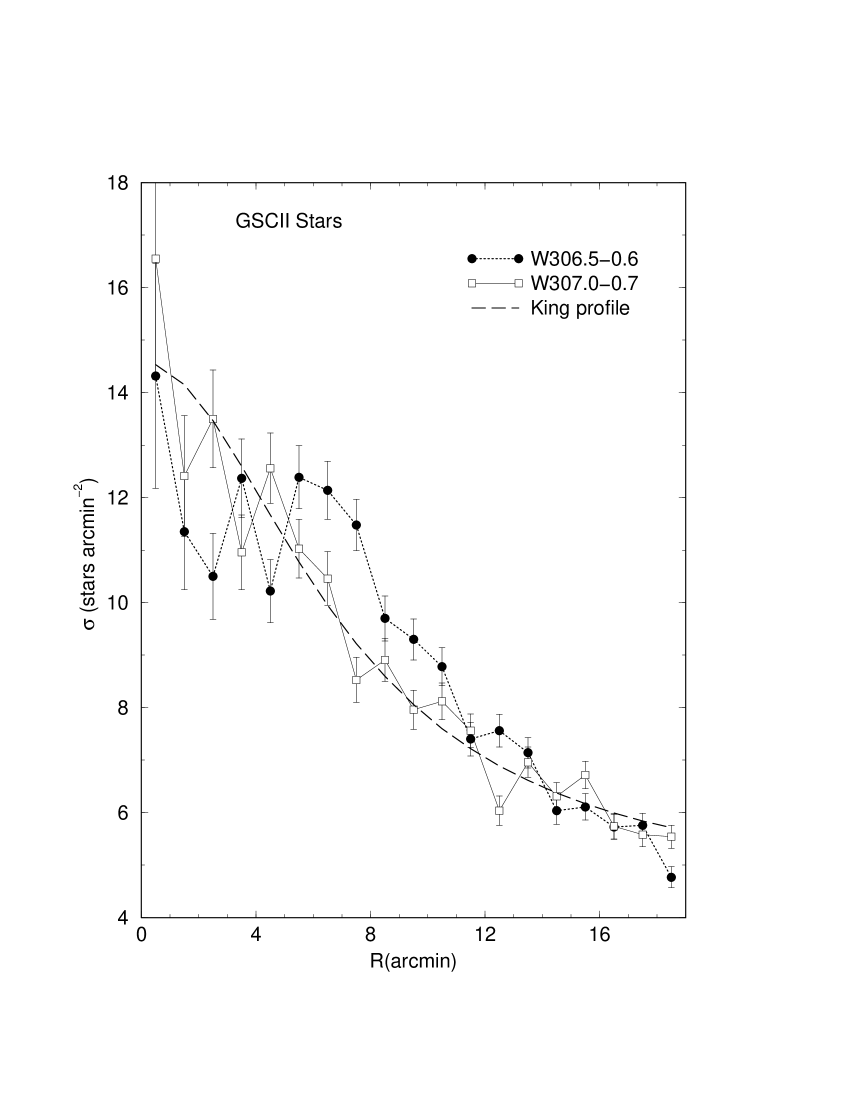
To investigate how the stars are distributed throughout the features and we construct the optical stellar distribution profiles, i.e., the radial density of stars per square arcmin, measured in radial annuli around the center of each feature. The resulting radial density profiles are shown in Fig. 2. Surprisingly, the profile of can be reasonably fitted by a King (King1962 (1962)) profile, , possibly mimicking an actual star cluster (Sect. 2.2). However, the same does not apply to .
2.2 Near-infrared photometry
Near-infrared J and H photometry have been extracted from the 2MASS All-Sky Data Release222http://www.ipac.caltech.edu/2mass/releases/allsky/. The 2MASS photometry has proven to be an excellent tool to be applied in analyses of the physical structure and luminosity/mass functions of star clusters by means of the radial distribution of stars and CMDs (see, e.g. Bonatto, Bica, & Santos Jr. BBJ2004 (2004), Bonatto, & Bica BB2003 (2003) and Bica, Bonatto, & Dutra BiBoDu2004 (2004)). Star clusters and galactic structure have also been addressed with 2MASS data (e.g. Bica, Bonatto, & Dutra BiBoDu2003 (2003)).
In the bottom panel of Fig. 1 we plot the positions of stars with magnitude taken fom 2MASS, which are located in the target area. Contrary to what is observed in the optical image (top panel of Fig. 1), in the near-infrared the features and do not present a contrast in terms of stellar surface density with respect to the surroundings. However, a slight decrease in the surface density can be seen for declinations .
For both and we made circular extractions of the stars contained within an area of 20′ in radius, centered on the corresponding coordinates given in Sect. 1. Stars in comparison fields have been extracted in areas of the same radius as that used for the features, to the North and South of both features, with center to center distances of 60′. Extractions have been performed using the 2MASS tool at the Infrared Science Archive (IRSA333http://irsa.ipac.caltech.edu/cgi-bin/Gator/nph-dd).
The resulting 2MASS CMDs are shown in Fig. 3 for the (left panels) and (right panels). The middle panels deal with the feature extraction, while the CMDs of the North and South offset fields are shown in the top and bottom panels, respectively. The North field of both features is clearly more reddened than the features themselves, while the South fields are similarly reddened than the features. This fact can be accounted for by the North fields being projected closer to the galactic plane than the South fields. We also checked CMDs involving and found that those involving J and H were better defined. Two nearly vertical extended star sequences (a blue and a red one) appear in the feature CMDs. This suggests the presence of relatively young stars, and not an older disk stellar population. Both star sequences may result from the upper main sequences of a dominant disk stellar population. The difference in colour between the two sequences certainly reflects different extinction related to spiral arms at different distances. The blue sequence is located at and the red one is at for both features. There is no compelling evidence for these star sequences to arise from star clusters, since the CMDs of the feature regions and comparison fields are similarly populated. The resulting feature CMDs may originate from background stars seen through a low-absorption zone. However, the presence of an association or an enhanced star-forming region related to the spiral arm cannot be ruled out at this point. The blue and red sequences in the CMDs of and are wide, indicating differential reddening. In the north fields the sequences are even wider, suggesting more differential reddening.

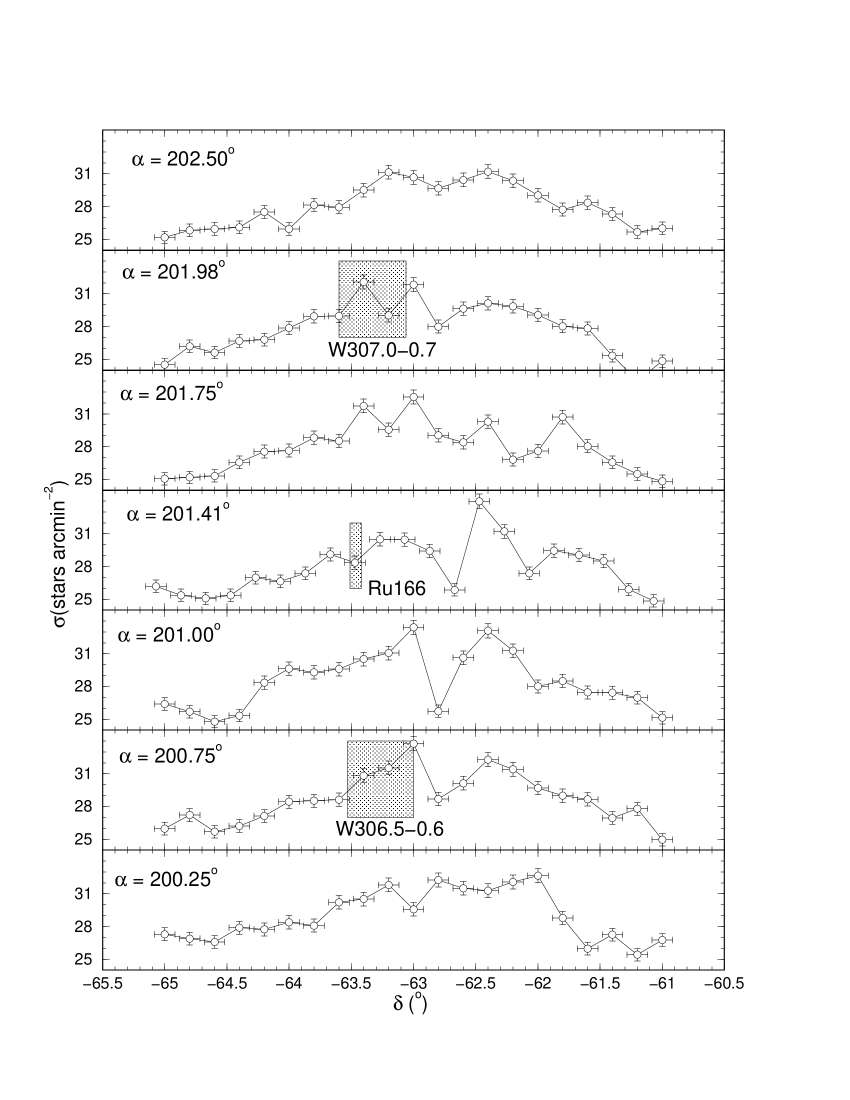
Another evidence in favour of both and being in a low-absorption window can be seen in Fig. 4, in which we show the stellar surface density distribution (in terms of ) across the target area. The surface density distribution has been built by calculating the number-density of stars in circular areas of 5′ in radius. The circles are regularly spaced in declination with a center to center separation of 12′. The right ascensions cover nearly all of the target region and, in particular, encompass the areas of both and (as well as the open cluster candidate Ru 166). Both features are located in regions where the density of stars is higher than the surroundings. Indeed, the stellar surface density distributions fall off for declination and , which is consistent with the presence of a large-scale window in the area. This is the region which detaches on Sky Survey plates (Sect. 1) and can be designated as .
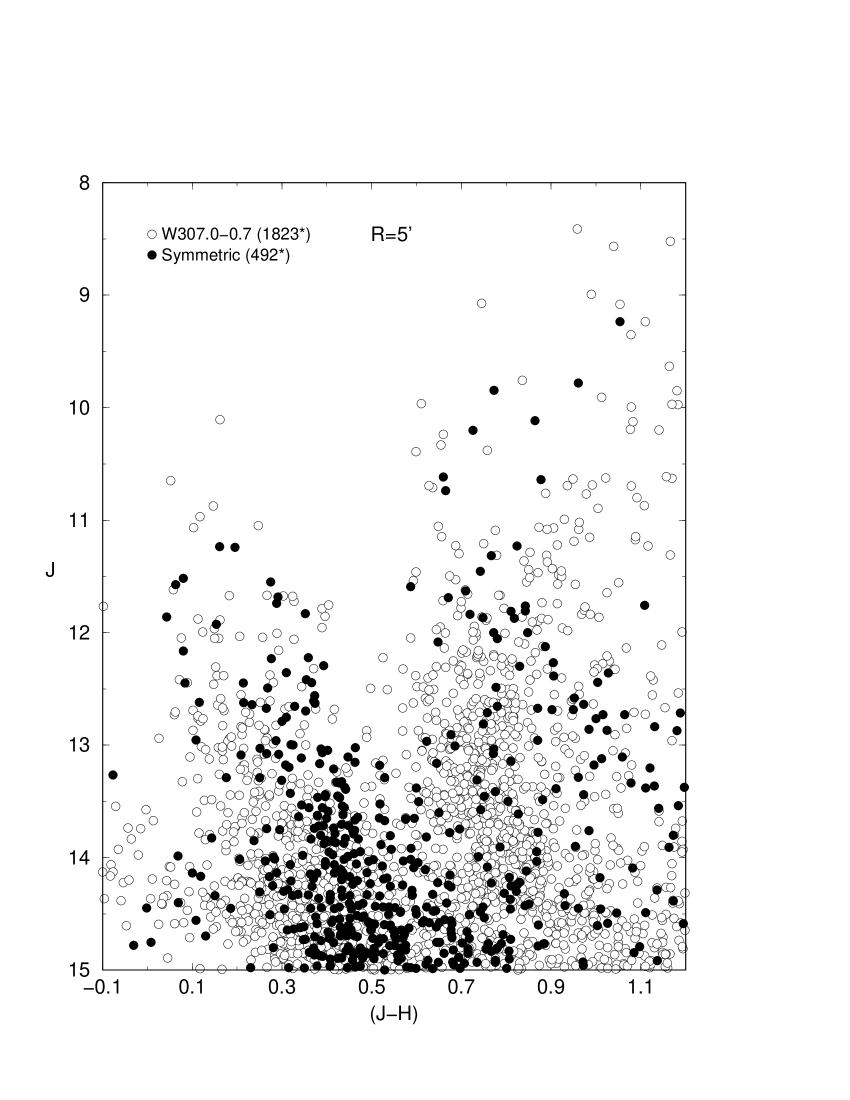
To further test the reddening gradient scenario we extracted photometry for stars in a symmetric field, to the north of the Galactic plane (), with respect to the feature . The coordinates of this symmetric field are J2000.0 and , which correspond to and . The resulting CMD is shown in Fig. 5, superimposed on the CMD of . For clarity purposes we restricted the CMDs to the central 5′ in both fields. There is a severe depletion of stars in the symmetric field (492 stars) with respect to (1823 stars), in the magnitude range . The blue sequence is present in the symmetric field, but more reddened than the corresponding one in . Finally, the number of stars in the red sequence of the symmetric field is much reduced with respect to that in . The average reddening parameters for the symmetric field are given in Table 1 (see Sect. 2.6 for details on reddening calculations). With respect to , the blue star sequence in the CMD of the symmetric field is mag more reddened, again consistent with the large-scale window (W 306.1-0.9) scenario (Sect. 1).
2.3 Near-infrared radial profiles
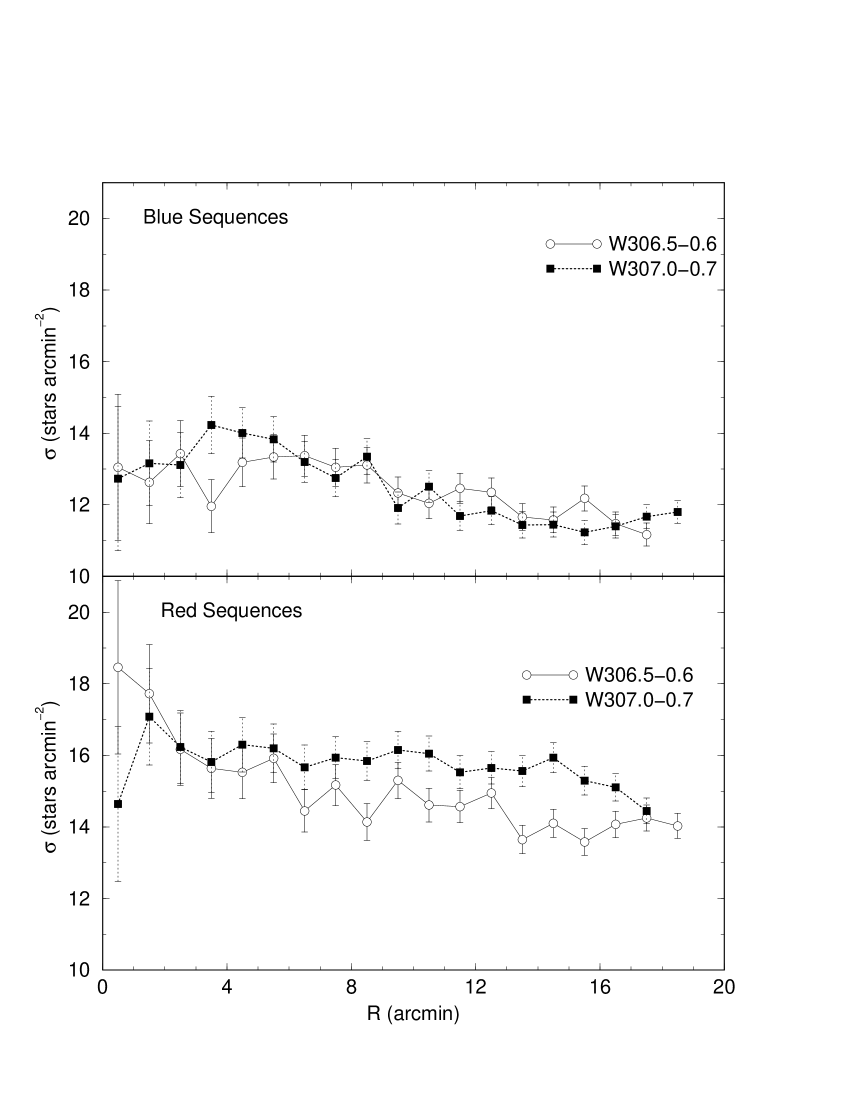
We show in Fig. 6 the near-infrared radial distribution of stars for and , which include all stars in the J, H or extractions. The distributions correspond to the radial number density of stars measured in annuli of radius . The top panel in Fig. 6 shows the radial distributions for the stars in the blue sequences () seen in the feature CMDs (Fig. 3), while in the bottom panel are those of the red sequences (). Within errors, the density profiles are similar in both blue and red CMD sequences and much shallower than those in the optical (Fig. 2), not resembling the profile expected from an actual star cluster (see, e.g. M 67, Bonatto & Bica BB2003 (2003), and NGC 188, Bonatto, Bica, & Santos Jr. BBJ2004 (2004)). Since we are dealing with near-infrared data, dust attenuation is less pronounced than in the optical and, consequently, the number of faint stars detected increases. Recall that peak densities of the optical profiles in Fig. 2 are slightly different from those in the near-infrared (Fig. 6). This arises essentially from the decomposition in two colour sequences in the near-infrared (probably different spiral arms), together with slightly different faint magnitude cutoffs. Stars outside the near-IR colour filters are discarded. Thus, and correspond in the optical and near-IR to nearly the same stars at the limit, A 0-F 8 for a distance of pc and . As a consequence of the increased background, the radial density profiles should have a lower contrast. Thus, the radial density profile similarity between the blue and red sequences in both and features does not support a cluster nature for any of the two stellar concentrations. We conclude that all sequences correspond to differentially reddened field stars.
2.4 Dust emission maps
We show in Fig. 7 an (band A) map of the region containing the features and obtained from the Midcourse Space Experiment (MSX444http://irsa.ipac.caltech.edu/applications/MSX/MSX/ ). In this image, a dust emission gradient, increasing to the north, is clearly seen. Notice that this gradient is also present in the near-infrared image (Fig. 1, bottom-panel). Probably this corresponds to a dust layer close to the Galactic plane at large distances. Inspection of adjacent fields indicate the presence of a low-emission cavity in which both and are projected. In the figure their locus is close to the high-contrast interface. This differential dust distribution is probably responsible for the behaviour of the radial stellar distribution of which, in the optical, mimics a King profile expected in a star cluster (Fig. 2). This particular dust distribution, i.e. thin in the center and increasing in density with radius, requires further attention both observationally and theoretically. The MSX image suggests the presence of a low dust-emission cavity in the area, thus providing low-reddening for optical studies of stars in this direction. The cavity has a diameter of , and can allow low-reddening observations to closer to the galactic plane than in neighbouring directions at comparable galactic latitudes.
We also inspected Infrared Astronomical Satellite (IRAS555http://irsa.ipac.caltech.edu/applications/IRAS/ISSA/) images encompassing the target area. Despite a lower spatial resolution with respect to MSX, the dust emission gradient described above is also present, particularly in the and bands.
2.5 Reddening and distance
The discussions presented in the previous sections support the presence of a low-absorption disk zone in Centaurus, in which the apparent stellar concentrations and stand out against the more reddened surroundings. At this point, it may be interesting to estimate parameters for the stars in both features, the distance to the Sun in particular. We caution that we are sampling a disk direction crossing spiral arms, and thus a mix of disk populations is expected, with varying age, metallicity and distance. Nevertheless, the nearly vertical, extended CMD blue sequences (Fig. 3) suggest a dominance in age by stars in a spiral arm and its leftover population behind, i.e. the stars formed during the passage of the arm through the disk (Schweizer Schw76 (1976), see also Vera-Villamizar et al. Vera2001 (2001)) and references therein. Thus, for the sake of estimating parameters, we assume in what follows an age of Myr for the stars in the blue sequences.
Under the assumption of a relatively young mixture of stellar populations in the features, we can tentatively estimate parameters, such as distance and reddening, since the line of sight interception of a spiral arm displays a distance contrast which is not expected to be large. We use as reference the 100 Myr solar metallicity Padova isochrone from Girardi et al. (Girardi2002 (2002)) computed with the 2MASS J, H and filters666Available at http://pleiadi.pd.astro.it. The 2MASS transmission filters produced isochrones very similar to the Johnson ones, with differences of at most 0.01 in (Bonatto, Bica & Girardi BBG2004 (2004)). The solar metallicity isochrones have been selected to be consistent with the typical disk metallicity. For reddening and absorption transformations we use , and the relations and , according to Dutra, Santiago & Bica (DSB2002 (2002)), and references therein.
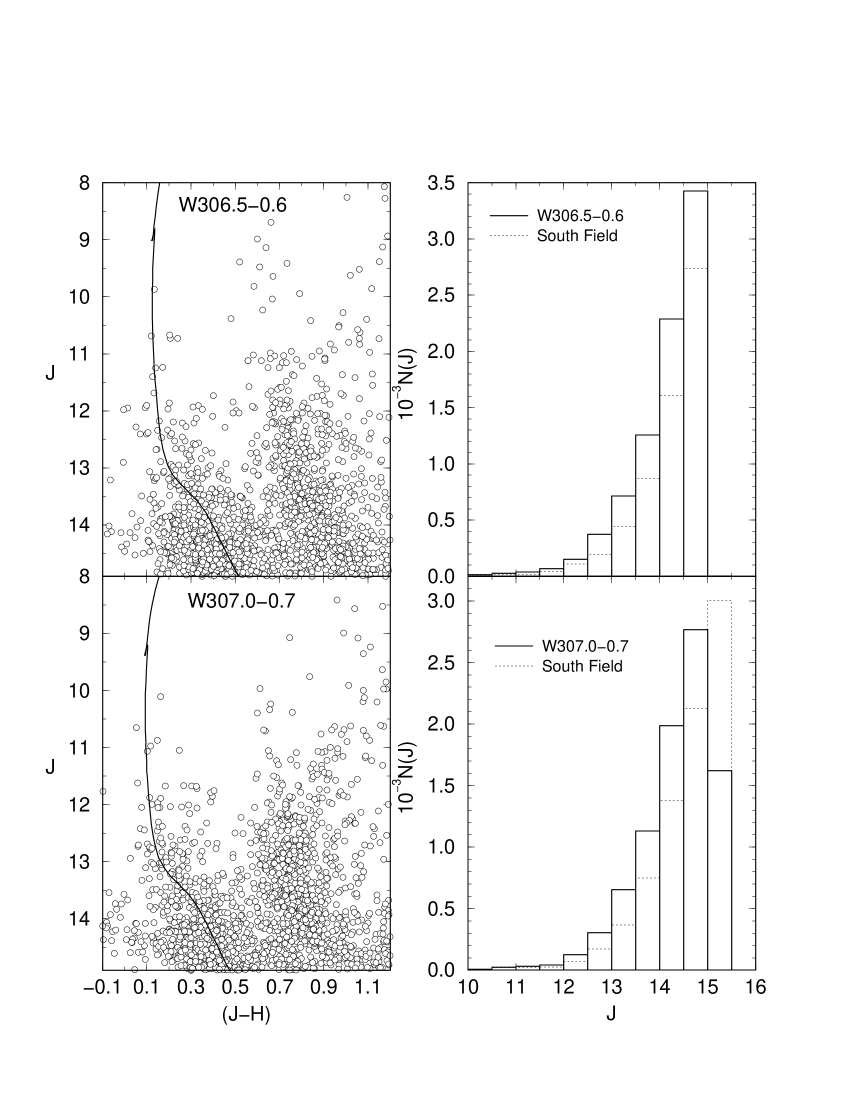
The resulting tentative fits are shown in Fig. 8 for and . For , the best-fit has been obtained with , , and a distance to the Sun kpc. The best-fit for corresponds to , , and kpc. The distance derived for both features is consistent with the distance to the Sgr-Car arm in this direction (Sect. 1). We provide in the right panels of Fig. 8 histograms for the number of stars per apparent magnitude bin, for the stars in the blue sequences. For both and features there are excesses in the blue sequences for faint stars, with respect to the comparison fields (Fig. 8, right panels). Finally, since a spatial confinement is expected to occur for the bulk of the spiral-arm stars – which is reflected in the CMD morphology of the blue sequences – we can tentatively derive a mass function for the stars in both features. We use the stars in the South fields as representative of the stellar-background contribution to the features, since these stars are similarly reddened as the features themselves (Fig. 3). For the mass-luminosity relation we use the 100 Myr Padova isochrone and the distances to the Sun derived above. We found for and for . These slopes are much steeper than a typical Salpeter mass function (), supporting the idea that the features and are not open clusters, but field stars. Alternatively we also determined the mass-function slopes for the features without subtracting a background field. The resulting values turned out to be slightly larger than those derived above. This result further supports the scenario of and being composed of field stellar populations instead of star clusters.
2.6 Fiducial lines in the CMDs

Since we are dealing with field stars, more than one wide MS sequence in colour are expected to occur on CMDs, owing to differential reddening and occurrence of several spiral features in the line of sight. In order to derive the main properties of stars, it is advisable to first determine the average sequences (fiducial lines) for the observed stellar distributions on the CMDs. The fiducial lines for and and respective north and south fields, are shown in Fig. 9, where we plot the average lines for both blue and red CMD sequences. The fiducial lines have been obtained by successively averaging the colours of sets of 100 stars along the magnitude axis. Finally, we fit a 2nd order polynomial to the resulting curves. As expected from the north-south reddening gradient, the fiducial lines in the north fields are significantly more reddened than those of the features, since the north fields are located more internally in the high dust-emission zone. Conversely, the south fields present fiducial lines very similar to those of the features, since these fields are also related to the cavity. The average reddening parameters of the and features, as well as those of the north and south fields are summarized in Table 1. Reddening parameters for the symmetric field are also indicated (Sect. 2.3).
| Blue sequence | Red sequence | |||
| Feature | ||||
| North Field | ||||
| South Field | ||||
| North Field | ||||
| South Field | ||||
| Sym. Field | ||||
-
The values in this Table are based on the fiducial lines shown in Fig. 9. We use the relation .
With the relation (Sect. 2.5), the infrared reddening for and , convert respectively to , and 0.42. These values are comparable to that of the Baade’s window, (Terndrup Tern1988 (1988)). Near the edge of Baade’s window, the reddening increases to , in the direction of the globular cluster NGC 6528 (Ortolani, Bica, & Barbuy OBB1992 (1992)).
3 The open cluster candidate Ru 166
Ru 166 is a small stellar concentration located within the boundaries of the low-absorption window (Sect. 2.2). Thus, it is important to investigate whether it is a small-scale window or dust hole, or a star cluster. In view of this we will explore this object by means of tools usually applied to actual star clusters for the near-infrared range (e.g. Bonatto & Bica BB2003 (2003)), and see whether Ru 166 satisfies conditions to be an open cluster.
Ru 166 is listed in catalogues of open clusters and open cluster candidates, e.g. Alter, Ruprecht, & Vanisek (Alter1970 (1970)), Lauberts (Lau1982 (1982)), Lyngå (Lynga1987 (1987)) and Dias et al. (Dias2002 (2002)). However, based on optical CCD photometry of individual stars in a region , Piatti & Clariá (PC2001 (2001)) indicated that Ru 166 is not an open cluster. Instead, they suggest that the CMD morphology of Ru 166 may arise from a combination of disk stars affected by varying amounts of interstellar reddening.
Considering the stellar distribution in the optical images (Fig. 10), the central position of Ru 166 would be located at J2000.0 and . However, the radial distribution of stars (built for the stars with 2MASS photometry) centered on these coordinates does not produce a profile with the maximum value occurring for . Having this in mind, we have searched for new coordinates which maximize the central distribution of stars. We do this by scanning in spatial detail the stellar density distribution in right ascension and declination. This clearly corresponds to a near-infrared peak in the stellar density distribution. The new central coordinates are J2000.0 and , which correspond to and . Indeed, the shifts of 3″ to the west in right ascension and 34″ to the south in declination, do produce a radial profile with the maximum at , as can be seen in Fig. 12 (top-left panel). Differences in dust attenuation between the optical and near-infrared may account for this small shift in the central position of Ru 166.
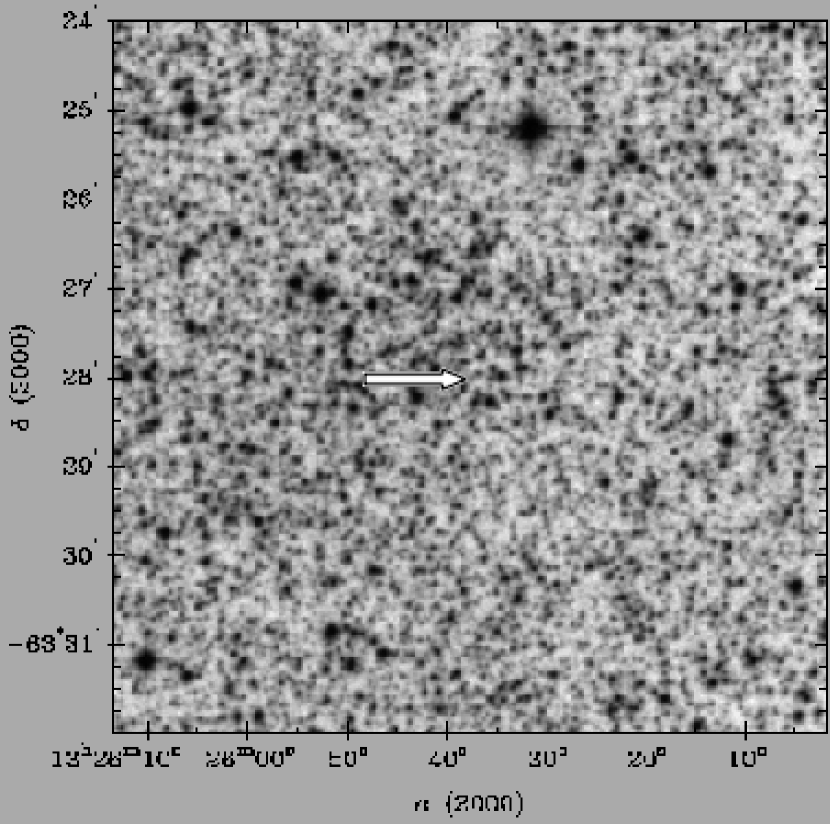
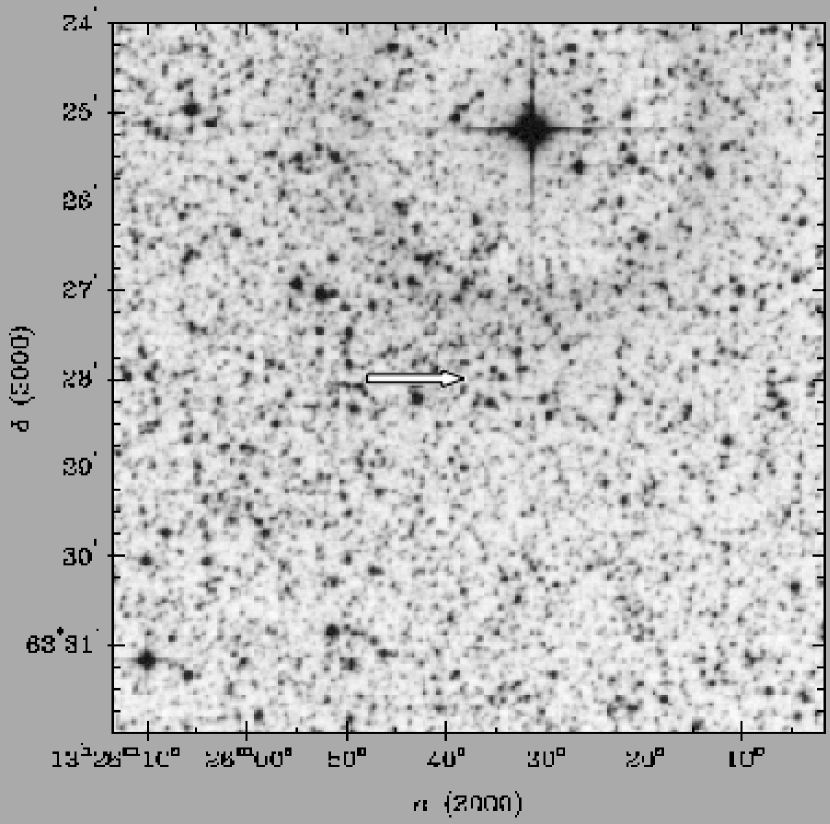
Ru 166, although generally located in a low-absorption zone, is found in a slight dip with respect to the distribution of the number-density of stars (Fig. 4). However, the sampling used to build that number-density distribution of stars corresponds to 12′, while the spatial scale of Ru 166 is about 2′. Thus, the distribution shown in Fig. 4 is not sensitive to small-scale fluctuations in the number-density of stars. Consequently, we must explore Ru 166 in more spatial detail than in the map of Fig. 4. In Fig. 10 we provide and XDSS images of an region centered on Ru 166, extracted from the Canadian Astronomy Data Centre (CADC777http://cadcwww.dao.nrc.ca/). As expected, there is a slight excess of stars in the center of both images. However, when the same region is considered in the near-infrared, the stellar surface density becomes more uniform, as can be seen in the 2MASS H (left panel of Fig. 11) and (right panel) images. One explanation for this effect may be that, since the near-infrared is less affected by dust attenuation than the optical, the stellar surface density of the background increases uniformly throughout a given region. Thus, a small cluster with a low stellar surface density, particularly in the outer regions, may get overwhelmed in the background. This effect would be particularly critical for small clusters projected against populous backgrounds such as the disk or bulge.
To investigate the nature of this stellar concentration, we extracted 2MASS data in a region with 10 ′ in radius centered on the above coordinates. Note that our analysis employs a larger area than that sampled by Piatti & Clariá (PC2001 (2001)). The CMD for the stars in the central 2.5 ′ is shown in the bottom-left panel of Fig. 12, while in the bottom-right panel we show the CMD of the comparison field (same area), which is taken from an external annulus. At first sight both CMDs are similar. Although the stars are sparsely distributed throughout the CMD, we still can tentatively apply fits with isochrones to estimate parameters for Ru 166. The best-fit has been obtained with the 200 Myr, solar-metallicity Padova isochrone, and , which correspond to and a distance to the Sun kpc, thus slightly beyond the Sgr-Car arm in this direction.
We also built a CMD with the same area as above with extracted around the optical center discussed above for Ru 166. The resulting CMD was essentially the same as that built around the near-infrared center (Fig. 12, bottom-left panel).
With respect to the radial distribution of stars (top-left panel in Fig. 12), Ru 166 presents a central concentration of stars, reaching up to ′. The dips in the radial profile at and are suggestive of dust. With a distance to the Sun of kpc, the linear diameter of Ru 166 would be pc, which would put this object in the small-cluster tail, with respect to the open cluster size distribution (Binney & Merrifield Binney1998 (1998)). Recall that, in order to maximize membership in the case of a star cluster, the above analysis was restricted to the stars inside a colour-magnitude filter (dashed line in the bottom-panel of Fig. 12). For a discussion on the use of colour-magnitude filters in the analysis of star clusters, see e.g. Bonatto, Bica, & Santos Jr. (BBJ2004 (2004)). The central concentration of stars presents a relatively high density-contrast with respect to the stellar density in the surrounding regions. However, due to the small-scale structure of the radial distribution of stars, a King model could not be fitted to the profile of Ru 166. Besides dust, the small-scale structure of Ru 166 may be accounted for the high density of stars in the area where it is located, (Fig. 4), which probably would drown any extended structure of a cluster. Indeed, the density of stars for around the center of Ru 166 still remains rather high, , after applying the colour-magnitude filter (top-left panel in Fig. 12). We remark that the filtering process increases the contrast so that Ru 166 has a stellar density of a factor of as compared to that of the background (top-left panel in Fig. 12). This might suggest the presence of an open cluster. As a comparison, the contrast between cluster and background for the CMD unfiltered star sample for M 67 reaches a factor of (Bonatto & Bica BB2003 (2003)).
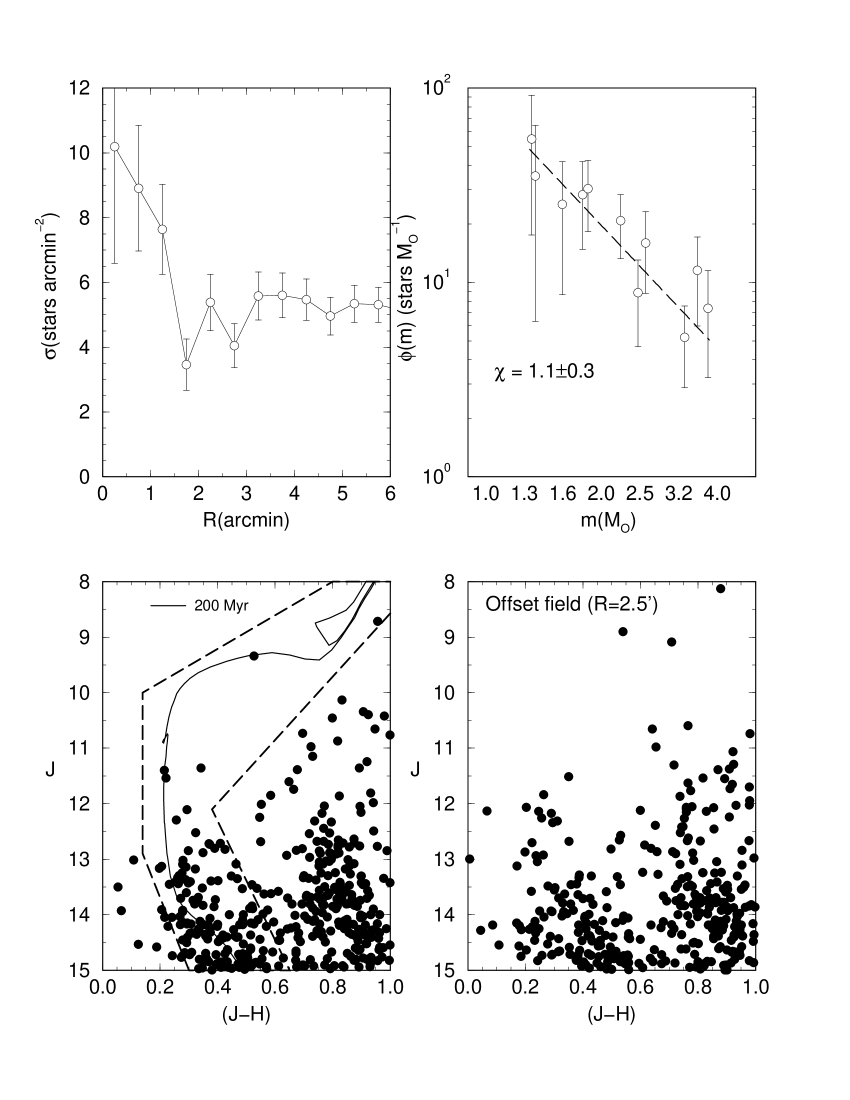
Finally, in the case of a cluster, we can adopt the 200 Myr isochrone fit as representative of the stars in Ru 166 to calculate the overall mass function () in this stellar concentration. To represent the offset field we use stars in the annulus between 5′ and 10′. The colour-magnitude filter (bottom-panel of Fig. 12) has been applied to the stars both in Ru 166 and offset field. The result is shown in the top-right panel of Fig. 12. A fit with the function resulted in a slope which, within uncertainties, is similar to a standard Salpeter () mass function. The observed MS mass (in the range ) results in , with a number of observed MS stars of . An estimate of the total mass locked up in stars in Ru 166 can be made by taking into account all stars down to the low-mass limit, . We do this by assuming the universal IMF of Kroupa (Kroupa2001 (2001)), in which for . For masses in the range we use the presently derived value of . The total (extrapolated) mass results , and the corresponding average mass density in Ru 166 becomes .
The data and analysis presented in the paragraphs above do not allow us to draw a conclusive diagnosis on the nature of Ru 166. On the one hand, the presence of a stellar concentration as shown in Figs. 10 and 12 (top-left panel), and the mass function Fig. 12 (top-right panel) are suggestive of an open cluster. On the other hand, the similarity between the CMDs of Ru 166 and offset field (bottom panels in Fig. 12) as well as the low contrast in the stellar surface density in the near-infrared (Fig. 11) suggest that Ru 166 may result from a fluctuation in the number-density of field stars probably associated with a small scale low-absorption region. We conclude that further data, particularly proper motion, are needed to definitively pin down the nature of Ru 166.
4 Concluding remarks
This paper dealt with the nature of two conspicuous stellar concentrations in Centaurus, at , , and at , , projected against the disk. By means of 2MASS infrared photometry, we have found a reddening gradient perpendicular to the galactic plane, characterizing an overall low-latitude, low-absorption zone towards the disk. Although we are certainly dealing with stellar populations with spatial depth and age mixtures, Padova isochrone fits to the bulk of the CMDs indicate that stars in both structures are dominantly located at kpc from the Sun, a distance consistent with that of the Sgr-Car arm. The presence of this low-absorption window provides a means to probe the Sgr-Car arm itself, and more distant parts of the disk, probably the tangent part of the Sct-Cru arm, and/or the far side of the Sgr-Car arm. The existence of low-absorption zones is important for deep optical studies of the Galaxy. We also investigated the nature of the open cluster candidate Ru 166. In some aspects (e.g. the stellar concentration in the optical and the mass function) Ru 166 resembles an open cluster. However, the similarity between the CMDs of Ru 166 and offset field, as well as the null-contrast in near-infrared images suggest that Ru 166 may result from a fluctuation in the number-density of field stars probably associated with a small scale low-absorption region. Thus, more data, proper motion in particular, are needed to decide upon this issue.
Throughout this work we applied several methods to test whether we were dealing with windows and dust holes or stars clusters and associations. They included CMD morphology, radial distribution of stars and number count of stars as a function of magnitude, both for the optical and near-infrared. The features and do not appear to qualify as star clusters, since they do not pass all of the above tests.
Finally, the present study showed significant variations in the stellar surface density in different spatial scales in optical images. However, in the near-infrared the stellar surface density contrast () is nearly absent. One possibility is non-uniform dust attenuation, which could be produced by a small dust hole or a window. Another possibility is intrinsic stellar distribution variations, which would become more uniform in a near-infrared image owing to the increased background density associated to less dust attenuation. Stellar concentrations, in this case, would be actual star clusters, associations or star-forming regions. A poorly populated star cluster will stand out against a sparse field. However, when projected against the disk, it will present a lower contrast . In order to disentangle the effects above it would require detailed modelling of Galactic structures in the near-infrared, including spiral arms. We intend to work in this direction in a future paper.
Acknowledgements.
We thank the referee Dr. Cameron Reed for interesting comments which improved the paper. This publication makes use of data products from the Two Micron All Sky Survey, which is a joint project of the University of Massachusetts and the Infrared Processing and Analysis Center/California Institute of Technology, funded by the National Aeronautics and Space Administration and the National Science Foundation. We employed catalogues from CDS/Simbad (Strasbourg) and Digitized Sky Survey images from the Space Telescope Science Institute (U.S. Government grant NAG W-2166) obtained using the extraction tool from CADC (Canada). We acknowledge support from the Brazilian Institution CNPq. The Guide Star Catalogue-II is a joint project of the Space Telescope Science Institute and the Osservatorio Astronomico di Torino. Space Telescope Science Institute is operated by the Association of Universities for Research in Astronomy for the National Aeronautics and Space Administration under contract NAS5-26555. The participation of the Osservatorio Astronomico di Torino is supported by the Italian Council for Research in Astronomy. Additional support is provided by European Southern Observatory, Space Telescope European Coordinating Facility, the International GEMINI project and the European Space Agency Astrophysics Division.References
- (1) Alter, G., Ruprecht, J., & Vanisek, J. 1970, in Catalogue of Star Clusters and Associations, ed. G. Alter, B. Balázs, & J. Ruprecht (Akademiai Kiado, Budapest)
- (2) Baade, W. 1946, PASP, 58, 249
- (3) Baade, W. 1963, in Evolution of stars and galaxies, Harvard Univ. Press, Cambridge, Mass., 277
- (4) Bica, E., Bonatto, C., & Dutra, C.M. 2003, A&A, 405, 901
- (5) Bica, E., Bonatto, C., & Dutra, C.M. 2004, A&A, in press
- (6) Binney, J., & Merrifield, M. 1998, in Galactic Astronomy, Princeton, NJ: Princeton University Press. (Princeton series in astrophysics)
- (7) Bonatto, C., & Bica, E. 2003, A&A, 405, 525
- (8) Bonatto, C., Bica, E., & Santos Jr, J.F.C. 2004, A&A, submitted
- (9) Bonatto, C., Bica, E., & Girardi, L. 2004, A&A, 415, 571
- (10) Dias, W.S., Alessi, B.S., Moitinho, A. & Lépine, J.R.D. 2002, A&A, 389, 871
- (11) Daflon, S., Cunha, K., Smith, V.V. & Butler, K. 2003, A&A, 399, 525
- (12) Daflon, S., Cunha, K., Butler, K. & Smith, V.V. 2001, ApJ, 563, 325
- (13) Dreyer, J.L.E. 1888, MmRAS, 49, 1
- (14) Dutra, C.M., Santiago, B.X. & Bica, E. 2002, A&A, 381 219
- (15) Dutra, C.M., & Bica, E. 2002, A&A, 383, 631
- (16) Fitzgerald, M.P. 1968, AJ, 73, 983
- (17) Georgelin, Y.P., & Georgelin, Y.M. 1970, A&AS, 3, 1
- (18) Georgelin, Y.M., & Georgelin, Y.P. 1976, A&A, 49, 57
- (19) Girardi, L., Bertelli, G., Bressan, A., et al. 2002, A&A, 391, 195
- (20) King, I. 1962, AJ, 67, 471
- (21) Kroupa, P. 2001, MNRAS, 322, 231
- (22) Lauberts, A. 1982, in ESO/Uppsala survey of the ESO(B) atlas, Garching: European Southern Observatory (ESO)
- (23) Lloyd Evans, T. 1976, MNRAS, 174, 169
- (24) Lyngå, G. 1987, in Catalogue of Open Cluster Data, Strasbourg: Centre de Données Stellaires
- (25) Mathys, G., Andrievsky, S.M., Barbuy, B., Cunha, K. & Korotin, S.A. 2002, A&A, 387, 890
- (26) McWilliam, A. & Rich, R.M. 1994, ApJS, 91, 749
- (27) Ortolani, S., Bica, E., & Barbuy, B. 1992, A&AS, 92, 441
- (28) Piatti, A.E., & Clariá, J.J. 2001, A&A, 379, 453
- (29) Russeil, D. 2003, A&A, 397, 133
- (30) Schweizer, F. 1976, ApJS, 31, 313
- (31) Skrutskie, M., Schneider, S.E., Stiening, R., et al. 1997, in The Impact of Large Scale Near-IR Sky Surveys, ed. Garzon et al., Kluwer (Netherlands), 210, 187
- (32) Terndrup, D.M. 1988, AJ, 96, 884
- (33) Vera-Villamizar, N., Dottori, H., Puerari, I. & de Carvalho, R. 2001, ApJ, 547, 187