Vigorous star formation in a bulge-dominated ERO at
Abstract
We present near-IR spectroscopy of three Extremely Red Objects (EROs) using the OHS/CISCO spectrograph at Subaru telescope. One target exhibits a strong emission line which we identify as H at . Using new and existing ground-based optical and near-IR imaging, and archival HST imaging, we argue that this target is essentially an elliptical galaxy, with an old stellar population of around , but having a dust-enshrouded star-forming component with a SFR of some 50–100. There is no evidence that the galaxy contains an AGN. Analysis of a further two targets, which do not exhibit any features in our near-IR spectra, suggests that one is a quiescent galaxy in the redshift range , but that the other cannot be conclusively categorised as either star-forming or quiescent.
Even though our first target has many of the properties of an old elliptical, the ongoing star formation means that it cannot have formed all of its stellar population at high redshift. While we cannot infer any robust values for the star formation rate in ellipticals at from this one object, we argue that the presence of an object with such a high SFR in such a small sample suggests that a non-negligible fraction of the elliptical galaxy population may have formed a component of their stellar population at redshifts 1–2. We suggest that this is evidence for ongoing star formation in the history of elliptical galaxies.
keywords:
cosmology: observations — galaxies: evolution — galaxies: starburst — infrared: galaxies1 Introduction
It has long been known that the properties of present-day ellipticals and spiral bulges are well described by models in which the individual bulge formed in a monolithic collapse at an early cosmic epoch, and such models were favoured on grounds of simplicity (Eggen, Lynden-Bell & Sandage 1962). However, in the presently-favoured Cold Dark Matter (CDM) models of the Universe (e.g., Spergel at al. 2003), the formation of galaxies is most strongly influenced by the large galactic haloes of dark matter, and theory now favours the hierarchical picture in which massive galaxies are formed by the merger of smaller components. There has been substantial success in reproducing observational results within this framework (e.g., Fukugita, Hogan & Peebles 1996).
When the first Extremely Red Objects (EROs; e.g. Hu & Ridgway 1994, Graham & Dey 1996, Smail et al. 2002) were discovered, considerable interest was aroused as it was thought that they were passively-evolving galaxies which had formed monolithically at a very early time. The situation was complicated when the first ERO to be studied in detail, commonly known as HR10, proved to be an irregular galaxy, slightly dust-reddened, undergoing an extreme starburst with a star formation rate (Cimatti et al. 1998). The picture of the ERO population which has since developed is that these red galaxies can be separated into two categories (Mannucci et al. 2002; Pozzetti et al. 2003). The first consists of objects similar to HR10, which are shown by high-resolution imaging to have disturbed morphologies. These galaxies are clearly undergoing extreme star formation, sometimes contain an AGN, and appear in many respects to be similar to the population of submm-selected galaxies which are observed predominantly to be at slightly higher redshifts, with a median (Chapman et al. 2003). A similar number of EROs, however, appear to have the morphology and colours of passively-evolving monolithically-formed ellipticals (although a very small fraction of these, as evidenced by surveys for radiogalaxies, also contain an AGN; see e.g. Willott at al. 2003). This presents two problems: first, in resolving their star-formation history with CDM hierarchical structure formation, and second, in the suggestion that the numbers of faint red galaxies are inconsistent with models in which the majority of today’s ellipticals formed in a single burst of star formation at very high redshift (Zepf 1996).
To resolve this issue, it is necessary to measure accurately the rate of star formation in the whole ERO population, not just the extreme cases. This presents a major observational challenge, since the H emission line is redshifted into the 1–2 m region of bright night-sky airglow lines. An alternative diagnostic, the [O ii] 3727-Å line, is more heavily extinguished by the dust which is commonly associated with star formation, making it less reliable as a quantitative indicator. It too is affected by the rising airglow forest and can only be reliably measured in a few small redshift windows below . Optical studies have, of necessity, concentrated on the bluest (and hence optically brightest) EROs, which could be biased in favour of those objects with recent star formation ( e.g. Cimatti et al. 2002 a,b; Daddi et al. 2002). Studies of objects with optical–infrared colours more typical of the general ERO population are therefore necessary. These arguments prompted us to use the sensitive OH-suppression spectrograph at Subaru Telescope to obtain spectroscopic observations of EROs in the crucial 1–2 micron region. In this paper we describe our observations of a small sample of objects, concentrating on the discovery that one of these, despite appearing a quiescent elliptical in its morphology and near-IR colours, appears to have a considerable degree of ongoing star formation. Throughout this paper, we adopt , , and , and all magnitudes are AB magnitudes.
2 Observations and Analysis
2.1 Subaru OHS/CISCO spectroscopy
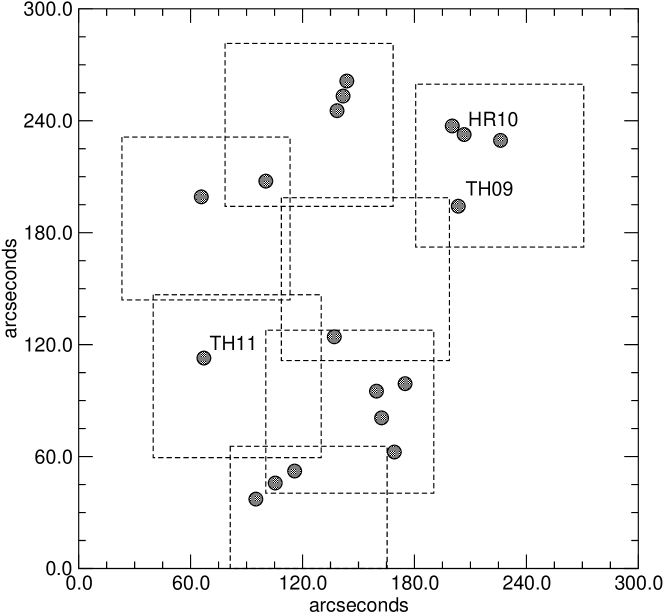
Our initial target list was drawn from the ERO sample of Haynes (1998, hereafter H98; see also Haynes et al. 2002 and Cotter et al. 2002), which was drawn from the -band imaging of Saunders et al. (1997) and -band imaging from H98. The sample was selected to have ; for completeness we include details of this sample in Table 1 and a diagram of their distribution on the sky in Figure 1. From this sample, we assembled a target list comprising the five objects with .
| ID | RA (J2000) | Dec (J2000) | (AB) | (AB) |
|---|---|---|---|---|
| TH01 | 16 45 10.24 | 46 26 59.67 | 4.811 | 20.62 |
| TH02 | 16 45 10.45 | 46 26 51.56 | 3.015 | 19.97 |
| TH03 | 16 45 10.77 | 46 26 43.72 | 3.176 | 20.55 |
| TH04 | 16 45 04.80 | 46 26 34.47 | 3.929 | 21.51 |
| TH05 | 16 45 04.18 | 46 26 29.74 | 3.048 | 22.02 |
| TH06 | 16 45 02.30 | 46 26 26.23 | 4.749 | 20.44∗ |
| TH07 | 16 45 14.53 | 46 25 56.24 | 3.105 | 20.72 |
| TH08 | 16 45 17.88 | 46 25 58.16 | 3.454 | 21.66+ |
| TH09 | 16 45 04.55 | 46 25 51.34 | 4.088 | 19.84 |
| TH10 | 16 45 11.12 | 46 24 42.46 | 3.338 | 21.15 |
| TH11 | 16 45 17.89 | 46 24 31.97 | 4.308 | 19.93 |
| TH12 | 16 45 07.49 | 46 24 16.91 | 5.118 | 21.53 |
| TH13 | 16 45 08.99 | 46 24 13.11 | 3.578 | 22.15 |
| TH14 | 16 45 08.75 | 46 23 58.77 | 3.344 | 19.12 |
| TH15 | 16 45 08.12 | 46 23 40.35 | 3.347 | 20.77 |
| TH16 | 16 45 13.30 | 46 23 30.87 | 4.363 | 21.02 |
| TH17 | 16 45 14.31 | 46 23 24.59 | 3.044 | 20.76 |
| TH18 | 16 45 15.33 | 46 23 16.06 | 3.139 | 20.69 |
Observations were made using the OH-airglow suppressor (OHS; Iwamuro et al. 2001) and the Cooled Infrared Spectrograph and Camera for OHS (CISCO; Motohara et al. 2002) at Subaru telescope on the night of UT 2001 June 11. OHS suppresses the night-sky background in the and bands by reflecting the dispersed beam from the target against a mirror that is finely ruled to mask the wavelengths of individual OH lines. The beam is then recombined and dispersed once more by a lower-resolution grating, so that the full spectrum may be projected onto the 10242-pixel HgCdTe HAWAII detector of CISCO.
Unfortunately, although the night was photometric, observing conditions were poor. High windspeed induced some telescope shake and the seeing was between 1.0 and 1.5 arcseconds. This necessitated the use of a 1.0-arcsecond slit, giving a spectral resolution . Nonetheless, we were able to obtain spectra of three galaxies. Our first two targets are the brightest objects at from our list; for brevity we refer to these as TH09 and TH11, as used by H98. We also obtained a spectrum of galaxy HR14 from Hu & Ridgway (1994), which fulfills our selection criterion of but is slightly outside the region observed by Saunders et al. (1997). Coordinates and full photometry from the literature are presented in Table 2 for all three targets.
For each target, individual 1000-s exposures (this length of exposure is necessary to obtain a sky-limited spectrum in the OH-suppressed regions) were offset by ten arcseconds in a standard ABBA pattern; TH09 and TH11 were observed for a total of 8000s each, and HR14 was observed for a total of 4000s. Shorter observations were also made of the nearby stars SAO 46230 and SAO 46869 to permit correction of the atmospheric absorption. The data were reduced using software written by CS which forms quads, flatfields the images, removes residual sky emission, and combines the positive and negative beams (see Simpson et al. 2004 for more details). Spectra were extracted in a 1.0-arcsecond aperture, corrected for atmospheric absorption, flux-calibrated from the acquisition images for each target, and are shown in Figure 2.
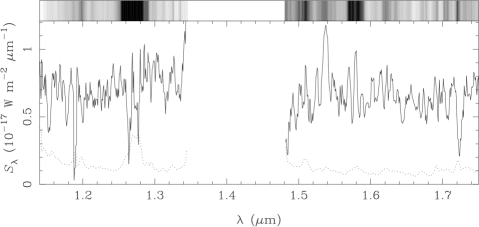
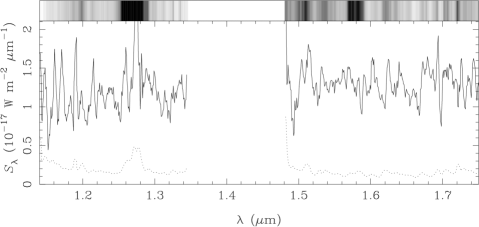
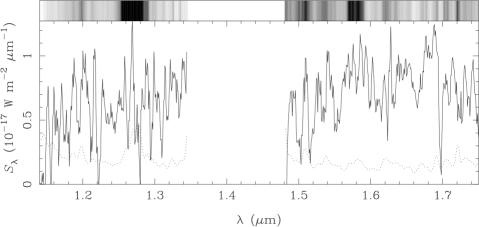
Only the spectrum of TH09 shows any significant feature: an emission line at 15373 Å is detected at high significance with a flux of W m-2 ( Å), which is away from any strong night-sky features. This line has a measured FWHM of 1350 km s-1 and is therefore unresolved spectrally. We identify this line with H 6563 Å at . We reject the only other plausible single-line identification, [O ii] 3727 Å at , since we see no evidence for a 4000-Å break or Balmer jump despite the high signal-to-noise in the continuum, and this would imply an absolute magnitude of for the galaxy. We also consider an alternative identification of [O iii] 5007 Å since our upper limit to the presence of any 4959 Å emission only rules this out at the level. However, there is once again no evidence for a 4000-Å break or Balmer jump. More detailed SED fitting (Section 3.1) is able to rule out these higher redshifts.
Having identified the line as H, we investigate the presence of [N ii] emission. In the first instance, we remove the best-fitting single Gaussian from the spectrum (since this line is unresolved, it should not be a simple blend of H+[N ii]) and determine an upper limit to the presence of an emission line at Å. We also try to fit three emission lines simultaneously using the specfit package (Kriss 1994). Both methods fail to provide any evidence for [N ii] emission, with an upper limit of [N ii]/H (95 per cent confidence).
2.2 UKIRT UFTI imaging
-band images of our three targets were taken with the UKIRT Fast Track Imager (UFTI) on the UK Infrared Telescope on the nights of UT 2005 February 17 and 18. Conditions were photometric and the seeing was measured to be about 1.0 arcseconds, comparable to that in which our spectroscopy was taken. Nine-point jitter patterns with an exposure time of 60 s per pointing were used, with total exposure times of 3240 s (TH09 and HR14, which lie within a single UFTI field of view) and 2700 s (TH11). The data were reduced using the ORAC-DR pipeline (Economou et al. 1999) and flux-calibrated from observations of FS 27 (Hawarden et al. 2001). Photometry was performed in apertures of diameter 3 arcseconds and is included in Table 2.
| RA (J2000) | Dec (J2000) | Name | ||||||||
|---|---|---|---|---|---|---|---|---|---|---|
| 16 45 04.5 | +46 25 51.34 | TH09 | ||||||||
| 16 45 17.9 | +46 24 31.97 | TH11 | ||||||||
| 16 44 57.0 | +46 26 02.0 | HR14 |
2.3 HST WFPC2 imaging
Archival Wide-Field/Planetary Camera 2 (WFPC2) observations are available for TH09 and HR14. TH09 was observed for a total of 3000s in F555W and 6000s in F814W, using a four-point sub-pixel dither pattern, as part of PID 7342 (PI: R. Saunders). These were processed using the drizzle package (Fruchter & Hook 2002) to recover some of the resolution of the undersampled WFPC2 PSF. HR14 was observed for a total of 5300s in F814W as part of PID 6598 (PI: A. Dey) and these data were processed using standard iraf procedures. Greyscale close-ups of the targets are presented in Figure 3.
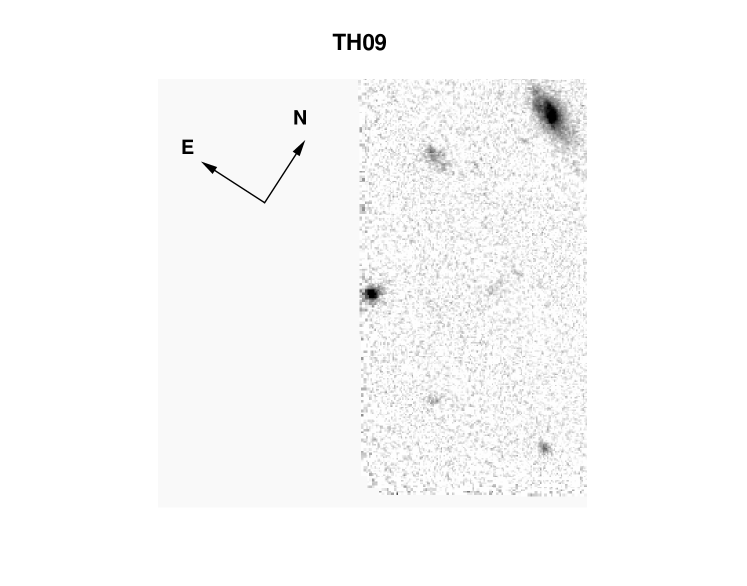
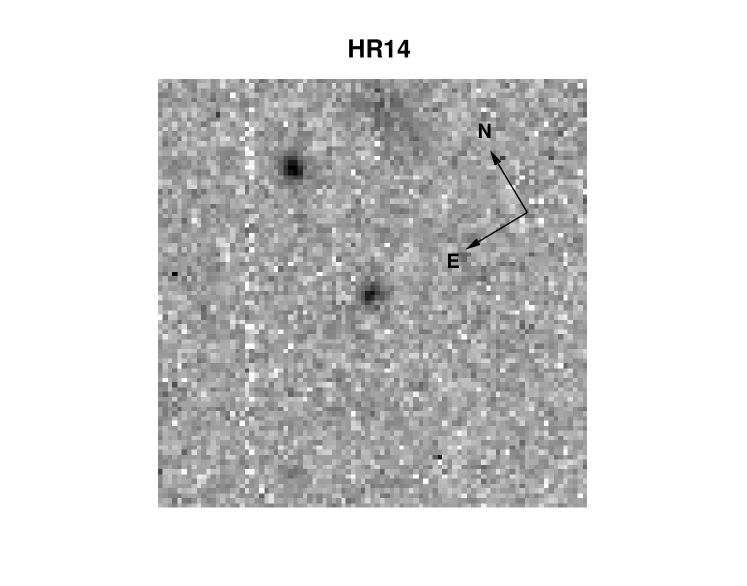
|
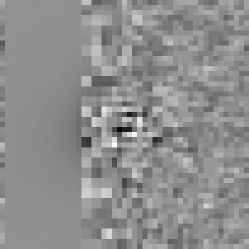
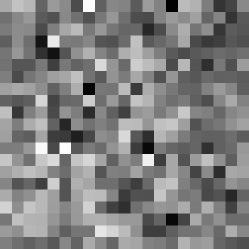
The GIM2D package (Simard 1998) was used to fit the two-dimensional surface brightness profiles of TH09 and HR14 in the WFPC2 images. We considered bulge-only fits, disc-only fits, and fits containing both bulge and disc components. Only the fit to TH09 displayed a clear morphological preference, with the bulge-to-total luminosity ratio of the best fit being (95 per cent confidence), and there being no significant preference for this fit over the pure bulge fit (reduced of 1.18 and 1.20, respectively, compared to 1.33 for a pure disc fit).
The shorter wavelength of the F555W image of TH09 might be expected to increase the contribution of any disc component, but the lower signal-to-noise ratio of this image precludes a preference being given to any particular model because the fits are poorly constrained (giving a reduced ). We note however that the preferred composite model has a strong bulge component (93 per cent of the total luminosity). The best fit for HR14 has a bulge contribution of 32 per cent, but the poor sampling and relatively low signal-to-noise ratio mean that all three fits have very similar values of . We show the results of our fits in Table 3 and Figure 4.


| Galaxy | Fit | B/T | ||||||
|---|---|---|---|---|---|---|---|---|
| (mag) | (mag arcsec-2) | (arcsec) | (mag arcsec-2) | (arcsec) | ||||
| Bulge-only | 1.0 | – | – | 1.20 | ||||
| TH09 | Disc-only | 0.0 | – | – | 1.33 | |||
| Bulge+disc | 1.18 | |||||||
| Bulge-only | 1.0 | - | – | 0.88 | ||||
| HR14 | Disc-only | 0.0 | – | – | 0.88 | |||
| Bulge+disc | 0.88 |
We thus conclude that TH09 is morphologically a bulge-dominated galaxy, and is likely a pure elliptical, but that we are unable on the basis of these images to make a robust morphological classification for HR14.
3 Discussion
3.1 Detailed properties of TH09
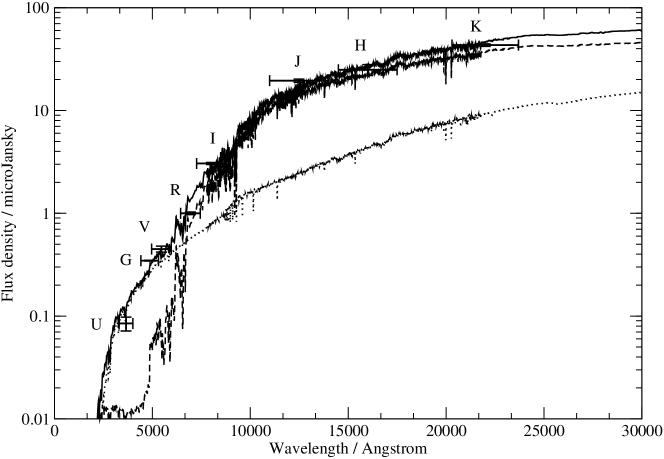
We first concentrate our discussion on TH09. As noted in the previous section, this galaxy is morphologically an elliptical. To investigate the properties of the stellar population in TH09 we first used the Hyperz photometric code (Bolzonello, Mirales & Pello, 2000), fixing the redshift at 1.34. This gave a poor fit for any of the model spectra in Hyperz; this also applied to the potential [Oii] and [Oiii] redshifts described in section 2.1. However, on examining the best-fit spectrum for in detail, it became apparent that the observed-frame near-IR was in fact a very good fit to an old population. The poorness of the overall fit was caused by the rest-frame UV being too bright for this population, by about a factor of ten at -band.
We next considered the possibility that TH09 hosts an AGN. The galaxy is not detected to a three-sigma limit of 18 Jy at 8 GHz (Cotter, unpublished data) and a deep PSPC image (Kneissl, Sunyaev & White 1997) gives a limit of erg s-1 cm-2 in the 0.5-2.0 keV band. Although there are no deep Chandra or XMM images available, which would allow us to rule out hard X-ray emission, these non-detections argue strongly against TH09 being an AGN host.
Our detection detection of H therefore implies that TH09 is starforming; this means that TH09 cannot be quiescent old elliptical galaxy with all its stars having formed at an early cosmic epoch. We chose then to model the SED of TH09 as a combination of an old stellar population plus a young starburst population. We used the solar metallicity Padua 1994 SSP from Bruzual & Charlot (2003; hereafter BC03), with a model age of 5.5 Gyr (the age of our fiducial universe at ) for the old population, as this gave the best fits to the red end of the SED (lower metallicity SSPs were not sufficiently red at this age). For the young stellar component we used a continuous starforming model from the same SSP with an age of 70 Myr (at which are the shape of the SED becomes close to its asymptote), using the rest-frame 2800 Åflux to obtain the SFR.
The next step was to estimate the SFR from the H luminosity in our OHS/CISCO spectrum. Since our spectral extraction aperture encompasses only a fraction of the total flux from the galaxy, we scale our H flux to account for slit losses. We measure a difference of one magnitude between the brightness of TH09 in our extraction aperture (as determined from the acquisition images) and its flux in Table 2, and therefore apply a correction factor of 2.5 to our measured emission line flux. This implicitly assumes that the H line emission has the same angular extent as the -band light, although we can determine a robust lower limit to the size of this correction of by determining how much light from a point source would fall into our spectroscopic aperture, and hence our correction will not be in error by more than 40 per cent. Using the relationship between H luminosity and star formation rate given by Kennicutt (1998), this implies a star formation rate of . However, adding a suitable constant star-forming component to our model spectrum produces too much emission in the rest-frame ultraviolet. At this point we note that, although there is a clear rest-frame UV excess in the spectrum of TH09, it does turn over in the far UV, so we also included a dust extinction, using the reddening law of Calzetti et al. (2000) which we applied only to the young stellar population.
We find that by taking an unreddened old stellar population, and adding a young population commensurate to a star formation rate of 50-100 , with dust extinctions of –4, we obtain reduced values of around 3 (in this region of the parameter space, the slope of the surface is quite shallow around the minimum). Moreover, this rate of star formation is then consistent with the observed H flux, assuming that it originates only in the star forming regions and suffers the same extinction.
The limit to the 8.4-GHz continuum flux density implies a three-sigma upper limit on the SFR of 150 . To calculate this SFR limit, we use the prescription of Haarsma et al. (2000),
Here gives the fraction of mass in forming stars that goes into stars of mass . A value of 5.5 was used for , appropriate for a Salpeter IMF with a mass range of 0.1 to 100 . Note that the high-frequency flux is dominated by the flat-spectrum thermal bremsstrahlung component, so the fact that our limit is at a rest-frame frequency of 19 GHz should not cause a large error in the inferred SFR.
We were then able to calculate the mass of old stars in TH09 via the old stellar component in our best-fit model, using the luminosity from 1 provided in the BC03 models. This gives a stellar mass for the old population of approximately . TH09 is clearly a massive galaxy, at the upper end of the masses observed in the FDF/GOODS-S survey (Drory et al. 2005) and also comparable to the hosts of radiogalaxies in this redshift range (Willott et al. 2003).
Despite the substantial mass of stars formed at an earlier epoch, we predict that the star formation activity in TH09 would produce an 850-micron flux of mJy (using, e.g., the conversion between submm flux and star formation rate of Ivison et al. 2002). This makes it comparable to, and indeed perhaps representative of, the objects which contribute to the faint end of the submm number counts (e.g. Hughes et al. 1998; Barger et al. 1998; Smail et al. 1999, ).
We also compare our observations with the “pixel-by-pixel” photometry of galaxies in the Hubble Deep Field, in which many ellipticals at redshifts slightly below show evidence of stellar populations of slightly different ages seemingly threaded through the spheroids (Menanteau et al. 2001; Abraham et al. 1999). We suggest that TH09 is an elliptical galaxy in the process of an event which will lead to such an appearance at a later epoch.
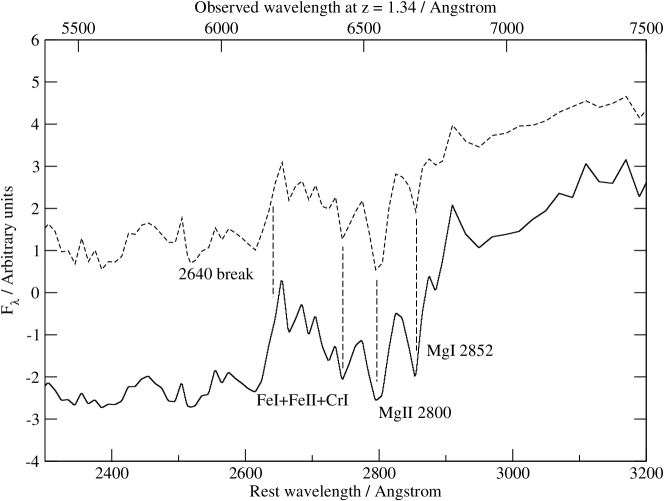
We note that in our model spectrum the region around Mg ii 2800 Å is similar to the ERO spectra observed by Cimatti et al. (2004) with FORS at the VLT (see Fig. 5). The spectroscopic sample of Cimatti et al. clearly demonstrates that there is a substantial population of EROs which, at , have already built up a large mass of old stars. However, in a scenario where the star-forming regions are obscured but the old population is not, the spectral features in the observed-frame optical do not yield immediate evidence of star formation. The implication here is that while elliptical EROs do have a well-established old stellar population, optical spectroscopy cannot rule out the possibility of ongoing star formation in these galaxies.
Finally, in terms of its environment, Fig. 1 shows that TH09 appears to be a member of a small group of four objects on the sky. However, since one of these is HR10 at a significantly higher redshift, we caution against concluding that TH09 is definitely in a rich environment.
3.2 TH11 and HR14
With no clear spectral features seen in TH11 and HR14, we used Hyperz to estimate the utility of our data for ruling out star formation via H non-detection. First, we checked to determine if, despite the dual-population of TH09, Hyperz could recover its spectroscopic redshift. We found most likely redshift , from a single-burst old population but with a poor fit. From inspection it of the best-fit model it appears that the Hyperz redshift is approximately correct because of the colours in the near-IR, especially around the rest-frame 4000-Å break.
For TH11, the best fit model was again an old, unreddened single-burst population, with a most likely redshift of and a 99 per cent confidence range . Our spectrum would be sensitive to H emission in the redshift range , which encompasses about 85 per cent of the Hyperz redshift probability. The lack of observable H emission in our spectrum (the upper limit is W m-2 over most of our spectrum) is therefore most likely to be due to a real absence of emission (rather than the line falling between the and bands) and implies an unobscured star formation rate of . We also that this object falls marginally in the “ellipticals” region of colour-colour space defined by Pozzetti & Mannucci (2000).
For HR14, the situation is somewhat more complex, with a bimodal likelihood distribution in redshift. HR14 is strikingly red, even for an ERO; from Haynes et al. (2002) and Hu & Ridgway (1994) we calculate 6.7 AB magnitudes. An unreddened single burst model provides a most likely redshift of , with a 99 per cent confidence range of ; this is in agreement with Hu & Ridgway’s estimate based on their photometry. However, nearly equally-likely fits are obtained with a redenned populations at a lower redshift: an old single-burst model with has most likely , 99 per cent confidence range ; and a young population with has most likely , 99 percent confidence range .
It is certainly more physically plausible that if HR14 were such a dusty object, it would likely also be strongly starforming. We would then expect to see H emission in our spectrum over most of the likely redshift range, but the signal-to-noise in our spectrum is about a factor of two worse than our other spectra. Considering also our poor constraint on the bulge-to-disc fit for HR14, we cannot conclusively decide if this is a starforming object or a more quiescent galaxy at a high redshift (we note that Pozzetti & Mannucci classify HR14 as an “elliptical”, although within the errors of the photometry it does not lie unambiguously in this region of their colour–colour diagram).
3.3 Implications for the rest of the ERO population
Our central observational conclusion is that in this small sample, one of our targets is unambigously starforming, despite its morphological appearance as a well-formed elliptical and the clear indication from its near-IR colours that the bulk of its stellar population is not dust-enshrouded. With our data we cannot determine whether TH09 is a undergoing a very short-lived episode of star formation, or whether is it undergoing a process wherein the old stellar population is being augmented by a longer episode of star formation, perhaps by a substantial increase in its cold gas reservoir via a merger.
However, we stress that the presence of an object such as TH09 in such a small observation sample is indicative that such objects must represent a non-negligible fraction of the ERO population. If this is indeed that case, it would provide support for a picture in which ellipticals frequently do not form in a single monolithic star-formation.
To determine precisely the rate of this continuing growth in the stellar mass of the elliptical galaxy population, it will be essential to determine spectroscopically which of the EROs are truly quiescent, which host an AGN, and which are undergoing star formation. Such observations are ideally suited to Subaru Telescope’s second generation instrument FMOS (Maihara et al. 2000; Kimura et al. 2003), a wide-field, fibre-fed, OH-suppression spectrograph which will be able to simultaneously take up to 400 spectra across a 30-arcminute field over the crucial 0.9–1.8 µm range.
4 Summary
We have presented new OHS/CISCO near-IR spectroscopy and an analysis of new and existing HST and ground-based imaging of a small sample of EROs. Our conclusions are as follows:
-
1.
We have detected H emission from one target, TH09, at .
-
2.
From an analysis of the broad-band colours of TH09, we conclude that it contains an old, unreddened stellar population and also a dusty young starforming component, with a star-formation rate of some 50–100.
-
3.
Analysis of archival HST imaging of this object demonstrate that it is bulge-dominated, essentially an elliptical galaxy.
-
4.
We detect no emission lines in our spectroscopy of two other targets, TH11 and HR14. Using a photometric redshift analysis of the broad-band colours of these two objects, we conclude that TH11 is unlikely to be undergoing any significant star formation, but we are unable to make any robust conclusions about the nature of HR14.
-
5.
Given the appearance of an object such as TH09 in such a small sample, we conclude that a non-negligible fraction of elliptical EROs must be undergoing continuing star formation. While it remains clear that these objects have a well-established old stellar population, we suggest that models in which ellipticals form in their entirety in a monolithic burst of star formation are oversimplified. We note that future sensitive wide-field near-IR spectrographs will allow measurement of the star formation rate in large numbers of such objects.
Acknowledgments
We warmly thank the referee for helpful comments on our first draft, and Katherine Inskip and Steve Rawlings for useful discussions.
This work is based in part on data collected at Subaru Telescope, which is operated by the National Astronomical Observatory of Japan; and in part on observations made with the NASA/ESA Hubble Space Telescope, obtained from the data archive at the Space Telescope Science institute. STScI is operated by the Association of Universities for research in Astronomy, Inc., under NASA contract NAS 5-26555. GC acknowledges support from PPARC grants KKZA/014 RG35306 and KKZA/01 RG32761. CS acknowledges a PPARC Advanced Fellowship. RCB acknowledges a PPARC Ph.D. research studentship.
It is a pleasure to express our gratitude and respect to the indigenous people of Hawai‘i, on whose sacred mountain Mauna Kea our infrared observations were made.
References
- Abraham et al. (1999) Abraham R. G., Ellis R. S., Fabian A. C., Tanvir N. R., Glazebrook K., 1999, MNRAS, 303, 641
- Barger et al. (1998) Barger A. J., Cowie L. L., Sanders D. B., Fulton E., Taniguchi Y., Sato Y., Kawara K., Okuda H., 1998, Nature, 394, 248
- Bolzonella et al. (2000) Bolzonella M., Miralles J.-M., Pelló R., 2000, A & A, 363, 476
- Bruzual & Charlot (2003) Bruzual G., Charlot S., 2003, MNRAS, 344, 1000(BC03)
- Calzetti et al. (2000) Calzetti D., Armus L., Bohlin R. C., Kinney A. L., Koornneef J., Storchi-Bergmann T., 2000, ApJ, 533, 682
- Chapman et al. (2003) Chapman S. C., Blain A. W., Ivison R. J., Smail I. R., 2003, Nature, 422, 695
- Cimatti et al. (1998) Cimatti A., Andreani P., Rottgering H., Tilanus R., 1998, Nature, 392, 895
- Cimatti et al. (2004) Cimatti A., Daddi E., Renzini A., Cassata P., Vanzella E., Pozzetti L., Cristiani S., Fontana A., Rodighiero G., Mignoli M., Zamorani G., 2004, Nature, 430, 184
- Cimatti et al. (2002) Cimatti A., Mignoli M., Daddi E., Pozzetti L., Fontana A., Saracco P., Poli F., Renzini A., Zamorani G., Broadhurst T., Cristiani S., D’Odorico S., Giallongo E., Gilmozzi R., Menci N., 2002, A & A, 392, 395
- Cimatti et al. (2002) Cimatti A., Pozzetti L., Mignoli M., Daddi E., Menci N., Poli F., Fontana A., Renzini A., Zamorani G., Broadhurst T., Cristiani S., D’Odorico S., Giallongo E., Gilmozzi R., 2002, A & A, 391, L1
- Cotter et al. (2002) Cotter G., Haynes T., Baker J. C., Jones M. E., Saunders R., 2002, MNRAS, 334, 283
- Daddi et al. (2002) Daddi E., Cimatti A., Broadhurst T., Renzini A., Zamorani G., Mignoli M., Saracco P., Fontana A., Pozzetti L., Poli F., Cristiani S., D’Odorico S., Giallongo E., Gilmozzi R., Menci N., 2002, A & A, 384, L1
- Drory et al. (2005) Drory N., Salvato M., Gabasch A., Bender R., Hopp U., Feulner G., Pannella M., 2005, ApJL, 619, L131
- Economou et al. (1999) Economou F., Bridger A., Wright G. S., Jenness T., Currie M. J., Adamson A., 1999, in Astronomical Society of the Pacific Conference Series ORAC-DR: Pipelining With Other People’s Code. p. 11
- Eggen et al. (1962) Eggen O. J., Lynden-Bell D., Sandage A. R., 1962, ApJ, 136, 748
- Fruchter & Hook (2002) Fruchter A. S., Hook R. N., 2002, PASP, 114, 144
- Fukugita et al. (1996) Fukugita M., Hogan C. J., Peebles P. J. E., 1996, Nature, 381, 489
- Graham & Dey (1996) Graham J. R., Dey A., 1996, ApJ, 471, 720
- Haarsma et al. (2000) Haarsma D. B., Partridge R. B., Windhorst R. A., Richards E. A., 2000, ApJ, 544, 641
- Hawarden et al. (2001) Hawarden T. G., Leggett S. K., Letawsky M. B., Ballantyne D. R., Casali M. M., 2001, MNRAS, 325, 563
- Haynes (1998) Haynes T., 1998, Ph.D. Thesis, University of Cambridge (H98)
- Haynes et al. (2002) Haynes T., Cotter G., Baker J. C., Eales S., Jones M. E., Rawlings S., Saunders R., 2002, MNRAS, 334, 262
- Hu & Ridgway (1994) Hu E. M., Ridgway S. E., 1994, AJ, 107, 1303
- Hughes et al. (1998) Hughes D. H., Serjeant S., Dunlop J., Rowan-Robinson M., Blain A., Mann R. G., Ivison R., Peacock J., Efstathiou A., Gear W., Oliver S., Lawrence A., Longair M., Goldschmidt P., Jenness T., 1998, Nature, 394, 241
- Ivison et al. (2002) Ivison R. J., Greve T. R., Smail I., Dunlop J. S., Roche N. D., Scott S. E., Page M. J., Stevens J. A., Almaini O., Blain A. W., Willott C. J., Fox M. J., Gilbank D. G., Serjeant S., Hughes D. H., 2002, MNRAS, 337, 1
- Kennicutt (1998) Kennicutt R. C., 1998, ApJ, 498, 541
- Kimura et al. (2003) Kimura M., Maihara T., Ohta K., Iwamuro F., Eto S., Lino M., Mochida D., Shima T., Karoji H., Noumaru J., Akiyama M., Brzeski J., Gillingham P. R., Moore A. M., Smith G., Dalton G. B., Tosh I. A., Murray G. J., Robertson D. J., Tamura N., 2003, in Instrument Design and Performance for Optical/Infrared Ground-based Telescopes. Edited by Iye, Masanori; Moorwood, Alan F. M. Proceedings of the SPIE, Volume 4841, pp. 974-984 (2003). Fibre-Multi-Object Spectrograph (FMOS) for Subaru Telescope. pp 974–984
- Kneissl et al. (1998) Kneissl R., Sunyaev R. A., White S. D. M., 1998, MNRAS, 297, L29
- Kriss (1994) Kriss G., 1994, in Astronomical Society of the Pacific Conference Series Fitting Models to UV and Optical Spectral Data. p. 437
- Maihara et al. (2000) Maihara T., Ohta K., Tamura N., Ohtani H., Akiyama M., Noumaru J., Kaifu N., Karoji H., Iye M., Dalton G. B., Parry I. R., Robertson D. J., Sharples R. M., Ren D., Allington-Smith J. R., Taylor K., Gillingham P. R., 2000, in Proc. SPIE Vol. 4008, p. 1111-1118, Optical and IR Telescope Instrumentation and Detectors, Masanori Iye; Alan F. Moorwood; Eds. Fiber multi-object spectrograph (FMOS) for the Subaru Telescope. pp 1111–1118
- Mannucci et al. (2002) Mannucci F., Pozzetti L., Thompson D., Oliva E., Baffa C., Comoretto G., Gennari S., Lisi F., 2002, MNRAS, 329, L57
- Menanteau et al. (2001) Menanteau F., Abraham R. G., Ellis R. S., 2001, MNRAS, 322, 1
- Motohara et al. (2002) Motohara K., Iwamuro F., Maihara T., Oya S., Tsukamoto H., Imanishi M., Terada H., Goto M., Iwai J., Tanabe H., Hata R., Taguchi T., Harashima T., 2002, PASJ, 54, 315
- Pozzetti et al. (2003) Pozzetti L., Cimatti A., Zamorani G., Daddi E., Menci N., Fontana A., Renzini A., Mignoli M., Poli F., Saracco P., Broadhurst T., Cristiani S., D’Odorico S., Giallongo E., Gilmozzi R., 2003, A & A, 402, 837
- Pozzetti & Mannucci (2000) Pozzetti L., Mannucci F., 2000, MNRAS, 317, L17
- Saunders et al. (1997) Saunders R., Baker J. C., Bremer M. N., Bunker A. J., Cotter G., Eales S., Grainge K., Haynes T., Jones M. E., Lacy M., Pooley G., Rawlings S., 1997, ApJL, 479, L5
- Simard (1998) Simard L., 1998, in Astronomical Society of the Pacific Conference Series GIM2D: an IRAF package for the Quantitative Morphology Analysis of Distant Galaxies. pp 108–+
- Smail et al. (1999) Smail I., Ivison R. J., Kneib J.-P., Cowie L. L., Blain A. W., Barger A. J., Owen F. N., Morrison G., 1999, MNRAS, 308, 1061
- Smail et al. (2002) Smail I., Owen F. N., Morrison G. E., Keel W. C., Ivison R. J., Ledlow M. J., 2002, ApJ, 581, 844
- Spergel et al. (2003) Spergel D. N., Verde L., Peiris H. V., Komatsu E., Nolta M. R., Bennett C. L., Halpern M., Hinshaw G., Jarosik N., Kogut A., Limon M., Meyer S. S., Page L., Tucker G. S., Weiland J. L., Wollack E., Wright E. L., 2003, ApJS, 148, 175
- Willott et al. (2003) Willott C. J., Rawlings S., Jarvis M. J., Blundell K. M., 2003, MNRAS, 339, 173
- Zepf (1997) Zepf S. E., 1997, Nature, 390, 377