11email: ljz@ns.bao.ac.cn 22institutetext: Armagh Observatory, College Hill, Armagh BT61 9DG, N. Ireland, UK
Multi-seeded multi-mode formation of embedded clusters in the RMC: Clusters formed in swept-up shells ††thanks: This publication makes use of 2MASS, the Two Micron All Sky Survey, a joint project of the University of Massachusetts and the Infrared Processing and Analysis Center, funded by the National Aeronautics and Space administration and the National Science Foundation
This is the first of a series of three papers on clustered star formation in the Rosette Molecular Complex. Here we investigate star formation in the interfacing layers between the expanding Rosette Nebula and its surrounding cloud, based on an analysis of the spatially complete and unbiased 2MASS data. Two medium-mass infrared clusters with ages of around 1 Myr are identified in the south and south-east arcs of the fragmented shell. The majority of the candidate cluster members in these radiation and pressure-confined regions are found to be almost uniformly distributed, roughly following the compression layers traced by the distribution of optical depth at 100 m, and may well develop into gravitationally unbound systems upon their emergence from the parental cloud. These expanding shells are believed to be playing important roles in impeding the emerging young open cluster NGC 2244 from intruding immediately and deeply into the ambient molecular cloud, where sequential formation of massive clusters is taking place.
Key Words.:
ISM: clouds – Infrared: stars – Stars: formation – Stars: pre-main sequence1 Introduction
Most stars, if not all, are believed to originate as members of either groups or clusters (1991ApJ...371..171L). The early clustering has been partly catalogued through searches at infrared wavelengths, which are able to locate the stars even when they are still deeply embedded in molecular clouds (2003AJ....126.1916P; 2003A&A...397..177B). Since the advent of the 2 Micron All Sky Survey (2MASS) large samples of infrared clusters have been discovered toward the Galactic plane (2003A&A...404..223B; 2003A&A...400..533D), projected over the Galactic center (2000A&A...359L...9D) as well as in well-known molecular clouds at high Galactic latitudes (2000AJ....120.3139C).
In order to trace the many possible evolutionary paths from molecular clouds to either field stars or bound systems, it is vital to select and investigate specific samples of embedded clusters. Such a study, undertaken here for the Rosette Molecular Complex, can provide insight into (1) the mechanisms responsible for the fragmentation of giant molecular clouds (GMCs), (2) the conditions essential for the development of clumpy cores into stellar clusters, (3) the dominant modes of star and cluster formation, (4) the dynamical relaxation of clusters and, ultimately, (5) the star formation history of the Galaxy.
The Rosette Molecular Cloud (RMC) is an ideal location for testing out scenarios for massive star formation on large spatial scales. At a distance of 1.4 kpc (2000A&A...358..553H), it is of mass 105 M⊙ and extends over 100 pc with a width of up to 50 pc, displaying a striking interaction with the spectacular Rosette Nebula towards one end (1980ApJ...241..676B). The latter HII region has a radius of 15 pc (38′). It is encompassed by a shell of HI of radius 20 pc (48′) which is expanding into the cloud at 4.5 km s-1 (1993ApJ...414..664K). The neutral shell is also associated with molecular clumps and strong 100m emission (1995ApJ...451..252W). The subject of this work is the embedded stars in this shell.
The gas is clumped on all measured scales down to 0.1 pc and 1 M⊙ (1995ApJ...451..252W; 1998A&A...335.1049S). The clump number-mass spectral index is (depending on how sub-clumps are treated) as fitted by the distribution dN/dM M-α. In space, the clumps are distributed around a ridge running parallel to, but two degrees below, the Galactic plane (1995ApJ...451..252W).
Many high mass stars, especially those immersed in the Rosette Nebula, interact with the cloud. Near-infrared observations have already revealed several prominent clusters on the scale of 1 parsec, as listed by 1997ApJ...477..176P. The cluster sizes and their absence on optical images indicate that they are young and embedded. 1997ApJ...477..176P suggested that triggered star formation is rife but not an exclusive mechanism, with spontaneous formation as an alternative. It should be noted that the rate for embedded clusters to emerge as bound clusters is statistically low in the Galaxy, based on the assumption of continuous star formation and if compared to known young open clusters (2003ARA&A..41...57L). Therefore, we should enquire whether the RMC clusters are in the process of dispersing. The RMC clusters, however, may be too young to display signs of dispersal given that the nebula, powered by the cluster NGC 2244 with a main-sequence turn-off age of 2 Myr (2002AJ....123..892P), possesses a dynamical age of just 0.2–0.6 Myr (1967ApJ...147..965M). In comparison, however, the dynamic age of the HI shell is 4 Myr. If we take a stellar velocity dispersion of 2 km s-1, then an unbound system would expand by 2 pc (5′) in 1 Myr. Hence, some dissolution may be expected on this scale.
The RMC was reported by 2004LSa to be pervaded by new-born clusters displaying a multi-seeded origin at various sites. Following perhaps the emergence of the young OB cluster NGC 2244, both triggered and non-triggered cluster formation are in evidence along the major axis of the complex. It is taking place in or probably adjacent to the swept-up layers of the HII region and deep in the cloud toward its south-east boundary, respectively. A detailed study of each spatially confined region has been carried out to substantiate the embedded nature of the clusters. Here, in the first of this series of papers, we focus on the cluster formation in the fragmented interaction layer of the HII region with the molecular cloud. Massive compact subclusters were identified in the densest rim of the RMC and are presented by a subsequent paper (Li & Smith 2004b, subm.). Regulated formation of clusters and loose aggregates of embedded young stars toward the south-east boundary of the RMC will be the subject of the third paper. This series, as a whole, aims at shedding light on the long-puzzling issues related to sequential cluster formation in galactic molecular clouds such as the RMC. The exceptional geometry of the Rosette Nebula and its environment make this region an ideal target for this study. Our new information is derived from archived 2MASS data. In contrast to visual inspection, our methodology permits us to identify and analyze the fine structures of clustered star formation in the RMC.
2 Data acquisition & sample selection
The 2MASS is the first near infrared project that made uniformly-calibrated observations of the entire sky in the J (1.24 m), H(1.66 m) and Ks(2.16 m) bands with a pixel size of 2.0″. Sources brighter that about 1 mJy in each band were detected with a signal to noise ratio greater than 10, which leads to a photometric completeness to 15.9, 15.0 and 14.3 mag, respectively, for each band in unconfused regions. For detailed information about the 2MASS survey and the 2MASS Point Source Catalogue, please refer to the 2MASS Explanatory Supplement.
Archived data in the 2MASS Point Source Catalogue (PSC) and IRAS Sky Survey Atlases (ISSA) were retrieved via IRSA (http://irsa.ipac.caltech.edu/). The following sample selection criteria were employed to guarantee the reliability of the 2MASS data in use and to allow a rigorous analysis. (1). Each source extracted from the 2MASS PSC must have a certain detection in the J, H & Ks bands. This constrains the ’rd-flg’ (data reduction flag) to only 1, 2 or 3 in each digit and the ’ph-qual’ (photometric quality) to only A, B, C or D for each band. (2). We require the Ks band signal to noise ratio, K-snr, to exceed 15. We find that this further constrains field stars in the control field to the main-sequence and post-main sequence loci on the (J-H) – (H-Ks) diagram, as will be illustrated in Sect. 4. However, it should be noted that the flux and resolution limited 2MASS survey, and our stringent source selection in combination will result in drawbacks. Firstly, the number of young massive stars that are deeply embedded can be underestimated; this is likely to occur in the densest regions with high extinction. Secondly, this work is limited to the study of comparatively high mass cloud members. With a 90 completeness limit of 0.8 M, even disk stars with masses above this limit can be missed.
3 Methodology
Due to its spatial proximity to the Galactic plane and its location at a distance of 1.4 kpc, a vast number of foreground and background field stars are expected in the infrared towards the RMC. Despite this heavy contamination, particularly by foreground stars, two compact stellar clusters are immediately apparent from the spatial distribution of all the sources extracted from the 2MASS catalogue. One cluster is located right at the centre of the Rosette Nebula and thus corresponds to the young open cluster NGC 2244. The other, situated at the densest rim of the RMC, has no optical counterpart and can well be a rich embedded cluster.
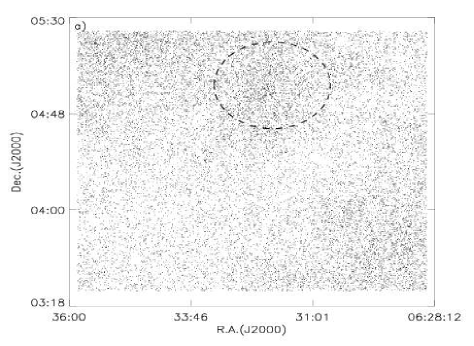
However, when the spatial distribution of the 2MASS sources is plotted as a function of the H–Ks colour, fine structure signifying large scale clustering is apparent all through the south-east part of the RMC (Fig. 1). The 2MASS sources plotted in Fig. 1a are restricted to H–Ks 0.2 mag, a mean colour typical of main-sequence dwarves. A widely uniform distribution which contains the vast majority of foreground stars in this field is displayed. The two dense regions in the north-east and south-west corners of the plot indicate field areas with very low extinction, where a combination of foreground and background sources is present. The low extinction regions are anticorrelated with regions of high CO density (1995ApJ...451..252W) or dust opacity associated with the RMC.
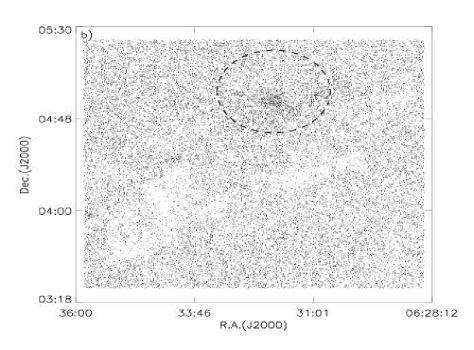
The distribution displayed in Fig. 1b with 0.2 H–Ks 0.5, on the other hand, is equivalent to a local extinction map of the RMC. Foreground stars are excluded and a majority of the background field stars are obscured by the condensed regions with high extinction. The higher the extinction, the lower the number density of the 2MASS sources. Note that members of the young open cluster, NGC 2244, are prominent in this particular plot because of the apparently low extinction along the line of sight to and through the blister HII region.
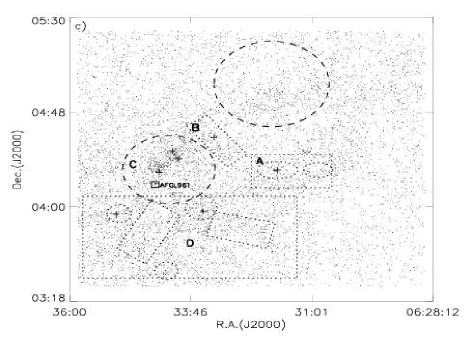
The distributions of stars with higher H–Ks colour indices are shown in Fig. 1c & 1d in which minimum H–Ks values of 0.5 and 1.0, respectively, are taken. There is clear evidence for multi-seeded clustering at various places across the complex. This indicates that the RMC is a unique region for the study of sequential cluster formation, especially when, for the first time, medium to low-mass stars are involved.

4 Clusters formed in the swept-up shell
A clear density enhancement of highly reddened stars in the fragmented interaction layer between the HII region and the surrounding molecular cloud is evident in Figs. 1c & 1d. Four or more compact far infrared emission regions form a circular structure around the expanding HII region (Fig. 1d), powered by the strong stellar winds from the dozens of OB stars of the young open cluster NGC 2244. However, significant clustering of sources with line of sight extinction is the most prominent in the south and south-east arcs of the broken shell structure. These two regions are known to be associated with prominent IRAS point sources (Cox et al. 1990) and recent star formation (Phelps & Lada 1997), indicating the existence of probably extensive young clusters. Nevertheless, minor clustering of sources and likely the association with active star formation seems to present also in the north-west fragments of the shell structure.
4.1 Spatial distribution
The well-defined Regions A & B are as outlined by dotted rectangles in Figs. 1c & d. A close-up view of the clusters in Regions A & B is presented in Fig. 2. Sources with H–Ks 0.5 mag are overplotted on the optical depth distribution of the compressed arcs. The optical depth at 100m is derived from the IRAS ISSA data (1996ChA&A..20..445L, and references therein).
For region B, evidence for a cluster core is marginal (lower panel). Instead, loose aggregates of reddened young stars can be seen surrounding the central area where the highest optical depth is indicated. The distribution seems to follow well the compressed layers of the shell structure as presented by contours of the optical depth. However, a largely uniform distribution of group/cluster members is observed within the swept-up arc resembling a tilted rectangle, which is believed to be confined by the radiation pressure and impact from the stellar wind of the young OB cluster NGC 2244.
A more or less similar stellar distribution is found in Region A, where two groups of reddened stars are identified, concentrated around two significant opacity cores, one on each side (upper panel of Fig. 2). The seemingly organized stellar distribution, following the contour lines of opacity, can also be a reflection of the extinction effects on background field stars. As opacity is indicative of the associated gas density, could the regulated distribution indicate an iso-density nature of the compressed layers of materials traced by the contours of optical depth in each of the fragmented arcs?


To check the significance of clustering in each target region, a two-point correlation function is applied and the results of the calculations are presented in Fig. 3. Within the selected areas, we calculate the number of pairs as a function of angular separation, r, as . This is normalised to the values expected from a randomly distributed sample spread over the same area of the sky, . We plot the function (e.g. see 2004SSGK)
| (1) |
clustering is implied where exceeds zero.
We uncover hierarchical clustering in Region A but predominantly for the sample of highly reddened sources. As displayed in Fig. 3, the higher the H–Ks colour constraint imposed on the sample, the clearer the correlation. The correlation function substantiates the clear concentration of sources in regions indicative of active star formation (1997ApJ...477..176P) which cannot result from a random distribution of background field stars. On a log-log plot (not shown) the power law index of (r) for Region A is -1.2, very steep in comparison to stellar clusters. This suggests that the embedded clusters are very young and that no flattening has been caused by the stellar velocity dispersion.
However, only minor signatures of clustering, on scales of order 0.1∘, are found in Region B (Fig. 3, lower panel) due to the loose distribution of the candidate cluster members. As noted in Sect. 1, given an age of 1 Myr, a cluster might expand by 5′ in 1 Myr. Therefore, even the absence of clustering is not evidence for non-clustered star formation assuming that all the reddened sources are embedded. Furthermore, the clustering of sources in Region B is apparent on large scales (Fig. 1c & 1d).


4.2 Colour-Colour Diagram
Colour-colour diagrams help in revealing the nature of reddened stars and in determining individual extinction. We have constructed colour-colour diagrams for two control fields (each with a radius of 20′), one located to the south-west and the other to the north-east of the Rosette Nebula, where visual extinction is very low as confirmed through the Digital Sky Survey images of the entire region. The results for the south-west field are presented in Fig. 4a for a comparison to those for the embedded clusters. We thus exclude any possibility of the existence of foreground extinction. It is clear that all 2MASS sources in the control fields, selected using the criteria introduced in Sect. 2, are concentrated to the main-sequence and giant-branch loci which, as a whole, have a mean H–Ks colour of about 0.2 mag. This indicates that there is negligible extinction toward the control field and presumably also towards the RMC.
Colour-colour diagrams for Regions A & B are illustrated in Figs. 4b & c. Currently, no further effort was made to distinguish the two subclusters embedded in Region A. At first glance, the distributions of foreground dwarves and candidate cluster members are apparently separate in both diagrams. However, concentrated to the left edge of the reddening band, there seems to be a spread of background giants affected by differential reddening effects in each region.
A close investigation of the (J-H) – (H-Ks) diagrams indicates a visual extinction between 0.2 and 15.0 mag in Region A, and a weighted mean extinction of 7.0 0.5 mag. The line of sight extinction of Region B lies between 0.5 and 19.5 mag but shows a weighted mean of only 2.5 0.5 mag. Assuming that both regions have the same average gas density, the small mean extinction of Region B might indicate that its distribution along the line of sight is shallow. This is consistent with its swept-up origin.


Around one seventh of the reddened sources toward Region A and a fifth of those in Region B are located to the right of the reddening band, indicative of intrinsic excessive emission in the near infrared. Both regions have one extreme source located to the right of the reddening band of classical T Tauri stars. These sources are good candidates of intermediate-mass young stars associated with circumstellar disks or envelopes, as will be further illustrated in the following subsection.
However, note that the location of some embedded sources in the reddening band does not necessarily mean they are aged (2001ApJ...553L.153H). Some can be young cluster members with little or no excessive emission i.e. weak-line T Tauri stars and their massive analogues, which can be hard to detect in the near infrared. This is likely to occur in high density embedded clusters, where the interactions between stars and internally driven turbulence are strong. The lack of excessive emission of the young stars is otherwise attributed to external UV dissipation and ionization of the associated disks by their massive neighbours, as indeed occurs in Regions A & B because of their spatial proximity to the young OB stars of NGC 2244 (1998A&A...335.1049S).
4.3 Colour-Magnitude Diagram
All 2MASS point sources that meet the criteria introduced in Sect. 2 are plotted on the Colour-Magnitude Diagrams (CMD) shown in Fig. 5. A clear separation between the foreground dwarves, which follow tightly the main-sequence presented by a solid line, and the reddened sources or candidate cluster members is apparent in the CMDs. The foreground main-sequence stars have a mean H–Ks colour of 0.2 mag, consistent with that determined from the colour-colour diagrams.
More than one third of the candidate cluster members in Region A and about one fourth of those in Region B are located at positions above the reddening vector drawn for an A0 dwarf. They are estimated to have masses of below or around 20 M⊙ and are therefore good candidates for medium mass pre-main sequence stars still immersed in their natal molecular clumps. This study based on the archived 2MASS data shows evidence of the formation of medium mass clusters in the fragmented interaction layer of the Rosette Nebula. However, from the CMDs it can be deduced that many low-mass components of the embedded clusters were missed. New explorations with higher spatial resolution and sensitivity are needed to obtain a more complete census of the embedded population in these regions.


4.4 Missed candidates of young stellar objects
The sample selection criteria employed in this study, along with the flux and resolution limited 2MASS survey, results in the exclusion of a number of stars with uncertain J band detection since it is more sensitive to extinction (2004A&A...421..623K), but high enough H and Ks signal-to-noise ratios. Many of them were likely shrouded by bright sources either through projection or physical association, or rather severely affected by extensive emission in association or in the background. These objects are mentioned here because they are predominantly sources with a highly reddened color and likely excessive emission.
This problem can be serious in the study of embedded clusters with high density or suffering from heavy differential extinction. This is found to be the case from a detailed investigation of the compact subclusters in Region C of the RMC (2004LSc), where a significant fraction of the protostellar candidates, including the most massive protostar AFGL 961E, have been omitted from the data extracted from 2MASS. However, only a few disk star candidates are found to have been missed in Regions A & B where both the stellar density and differential extinction are comparatively low (Fig. 2). These objects are tentatively put on the CMD as an indication of the population of mostly candidate members that did not meet the selection criteria (Fig. 5).
4.5 Ks Luminosity Function
The luminosity function of an embedded cluster can be taken as a direct measure of the initial luminosity function of the cluster. It is usually a statistically reliable tool for addressing questions concerning the initial mass function, star formation history and pre-main sequence tracks. The Ks band luminosity functions for Regions A & B are presented in Fig. 6, with that of the Region A cluster indicated by a solid line and of the Region B cluster by a dotted line. We found that the Ks luminosity functions of the two clusters are identical, and follow a power law distribution. A linear least-square fit to the distribution in the range 11.0 Ks 14.5 indicates a very similar slope for both clusters of 0.3. This implies an age of 1 Myr for both the Regions A & B clusters from a comparison with other embedded clusters with known ages (1995AJ....109.1682L). On the other hand, the Ks luminosity function does not turn over at the 2MASS completeness limit, which in this study corresponds to Ks = 14.5 mag and 0.8 M⊙ at a distance of 1.4 kpc. They are, therefore, still in a very early stage of evolution, within a few arcminutes of their birth sites.

Note that stars formed in such compressed shells seem to show a moderate upper mass limit, which could be a consequence of the existence of a universal IMF.
5 Summary & Discussions
Two medium-mass infrared clusters, associated with the expanding shell driven by the Rosette Nebula, are examined in this paper. One is associated with Region B of the fragmented shell and the other with Region A. These shell clusters are found to have an age of around 1 Myr, much younger than the young open cluster NGC 2244 that excites the HII region as well as the dynamical age of the associated HI shell.
Only marginal evidence is found for cores in the embedded clusters. The
majority of the candidate cluster members are widely distributed along the
well-defined shell structures. They present a largely uniform distribution
which could imply a gravitationally unbound future of the clusters when the
associated gas is ultimately dissipated or exhausted.
This case study may also provide insight into how large numbers
of embedded clusters fall apart upon emergence (Lada & Lada 2003).
The interaction layers between blister HII regions and their dense molecular surroundings, such as Regions A & B of the RMC, turn out to be unique sites of star or cluster formation. These working surface layers may play an important role in star formation in that they shield the ambient molecular cloud from being disturbed by the expanding HII region and the immersed young open cluster such as NGC 2244. Indeed, UV dissipation and ionization is found to scale logarithmically with the decreasing UV flux deep in the molecular clouds along the radial direction of NGC 2244 (1998A&A...335.1049S). This may contribute to, or in the vicinity of the interaction layer play a major role in the collapse of the clumps and consequently in the formation of new stars or clusters. This issue was further elaborated in 2004LSa.