11email: T.L.Parker@open.ac.uk, A.J.Norton@open.ac.uk, 22institutetext: NASA Goddard Space Flight Center, Laboratory for High Energy Astrophysics, Code 662, Greenbelt, MD 20771, USA and Universities Space Research Association
22email: mukai@milkyway.gsfc.nasa.gov
X-ray Orbital Modulations in Intermediate Polars
We present an analysis of 30 archival ASCA and RXTE X-ray observations of 16 intermediate polars to investigate the nature of their orbital modulation. We show that X-ray orbital modulation is widespread amongst these systems, but not ubiquitous as indicated by previous studies that included fewer objects. Only seven of the sixteen systems show a clearly statistically significant modulation depth whose amplitude decreases with increasing X-ray energy. Interpreting this as due to photoelectric absorption in material at the edge of an accretion disc would imply that such modulations are visible for all system inclination angles in excess of 60 degrees. However, it is also apparent that the presence of an X-ray orbital modulation can appear and disappear on a timescale of years or months in an individual system. This may be evidence for the presence of a precessing, tilted accretion disc, as inferred in some low mass X-ray binaries.
Key Words.:
stars: cataclysmic variables – X-rays: stars – stars: magnetic fields – stars: binaries – stars: individual: V1025 Cen, BG CMi, V1223 Sgr, V2400 Oph, AO Psc, YY Dra, LS Peg, V405 Aur, V2306 Cyg, FO Aqr, PQ Gem, V709 Cas, TV Col, TX Col, AE Aqr, V1062 Tau1 Introduction
Intermediate Polars (IPs) are semi-detached interacting asynchronous binaries in which a magnetic white dwarf (WD) accretes material from a Roche lobe-filling, usually main sequence dwarf, companion. The accretion flow from the secondary proceeds towards the WD either through an accretion disc, an accretion stream, or some combination of both (known as disc overflow accretion), until it reaches the magnetospheric radius. Here the material attaches to the magnetic field lines and follows them towards the WD magnetic poles where the infalling material takes the form of arc-shaped accretion curtains, standing above the WD surface. At some distance from this surface, the accretion flow undergoes a strong shock, below which material settles onto the WD, releasing X-ray to optical emission. Since the magnetic axis is offset from the spin axis of the WD, this gives rise to the defining characteristic of the class, namely X-ray (and usually optical) emission pulsed at the WD spin period. X-ray pulsation at the lower orbital sideband frequency is sometimes seen and believed to be an intrinsic modulation arising from pole-switching in the case of stream-fed accretion. Over twenty confirmed IPs are now recognised, with a similar number of candidate systems having been proposed. Comprehensive reviews of various aspects of their behaviour are given by Patterson (1994), Warner (1995), and Norton et al. (2004).
Orbitally modulated X-ray flux has been reported in several IPs and three possible origins for such X-ray orbital modulations have been suggested. In the absence of an accretion disc, the accretion onto the WD poles may depend on binary phase, and so give rise to an orbitally modulated X-ray flux. A second possibility is that the interaction of stream and disc could give rise to an additional emission component, whose visibility varies with orbital phase. Finally, if a disc is present with a non-axisymmetric structure at its outer edge, local absorption of the X-ray flux could occur as the structure crosses the line of sight to the WD. This would reduce the X-ray flux periodically, with an energy dependence characteristic of photoelectric absorption. Absorption at the edge of a disc, is the accepted explanation for X-ray orbital modulations seen in Low Mass X-ray Binaries (LMXBs) and is a likely candidate to operate in IPs too.
Hellier et al. (1993) carried out the only previous systematic study of X-ray orbital modulations in IPs. They looked at the X-ray lightcurves of seven IPs observed by EXOSAT, and found orbital modulations to be probably present in each of them (TV Col, TX Col, AO Psc, FO Aqr, BG CMi, V1223 Sgr and EX Hya), although the evidence in V1223 Sgr was marginal. Hellier et al. (1993) concluded that these orbital modulations are similar to those seen in dipping LMXBs and have a similar cause. The implication noted by Hellier et al. is that IPs are all seen at high inclinations and are all disc fed. For comparison, our observations of IPs using ROSAT and Ginga confirmed the presence of X-ray orbital modulations in FO Aqr (Norton et al. 1992b), BG CMi (Norton et al. 1992a), TX Col (Norton et al. 1997), and AO Psc (Taylor et al. 1997), and failed to find such modulation in V1223 Sgr (Taylor et al. 1997), YY Dra and V709 Cas (Norton et al. 1999). In addition XY Ari and EX Hya are the only IPs to show X-ray eclipses (Hellier 1997; Rosen et al. 1991) and so are known to be at high inclination angles.
In order to extend the earlier studies, and investigate the preponderance of X-ray orbital modulations in the large number of IPs now known, we have re-analysed 30 X-ray observations of 16 IPs obtained with RXTE and ASCA that are available in the archives. We have excluded observations of IPs that span less than two orbital periods of the system in question and we have not included observations of EX Hya and XY Ari in our analysis. The X-ray orbital modulation of EX Hya is well studied but difficult to disentangle from the spin modulation with which it is in a 3:2 resonance. The archival RXTE observations of XY Ari are all short and cover only a tiny phase range around the eclipse egress in each case, so the overall broad X-ray modulation (antiphased with the X-ray eclipse) is not sampled.
2 Observations
The data presented here were obtained with the Advanced Satellite for Cosmology and Astrophysics (ASCA) and the Rossi X-ray Timing Explorer satellite (RXTE). Table 1 shows details of the ASCA observations and Table 2 lists the RXTE observations that we have used. References in each table indicate papers where these observations have been previously reported, although in most cases, the authors do not comment on any X-ray orbital modulation.
ASCA performed imaging and spectroscopic observations simultaneously over an energy range of 0.5 – 10 keV and carried four large-area X-ray telescopes. At the focus of two of the telescopes were Gas Imaging Spectrometers (GIS) with an energy resolution of 13 at 6 keV and 7 at 1.5 keV, and a circular field of view of 50 diameter. Solid-state Imaging Spectrometers (SIS) with an energy resolution of 50 at 6 keV and 20 at 1.5 keV, and a square field of view of 20 x 20, were at the focus of the other two. See Tanaka et al. (1994) for a more extensive guide to ASCA.
RXTE is a satellite designed for time domain studies of cosmic X-ray sources. The instrument used for the observations presented here was the Proportional Counter Array (PCA; see Zhang et al. (1993)), which consists of five Proportional Counter Units (PCUs) with a total net area of 6500 cm2. Each PCU is filled with xenon gas and split into three layers, plus a propane filled veto layer. The energy bandwidth of the instrument is 2–60 keV and it has a collimated field of view of 1∘ (FWHM). The energy resolution of the PCA is 18% at 6 keV (see Bradt et al. 1993, for more details). During the observations reported here, the PCA was mostly operated with all five PCUs functioning, however for some observations fewer were in use, but this is accounted for within the data reduction and the lightcurves are shown as counts per PCU against time.
3 Data reduction
All the data used were extracted from the HEASARC archive and reduced using the standard routines of the ftools package v5.2.
For the RXTE data reduction, we took the standard data products from the PCA and extracted the source lightcurves for each dataset using the tool saextract for the appropriate good time intervals. The background data files were generated with the tool runpcabackest using background models appropriate for the source. We filtered out inappropriate or contaminated data by applying the criterion that the target elevation 5, pointing offset 0.02, time since passage through South Atlantic Anomaly 25 min, and used a standard threshold for electron contamination. Background subtracted lightcurves were then constructed in 16 s time bins in the energy bands 2–4, 4–6, 6–10 and 10–20 keV.
ASCA data reduction was carried out in a similar way, with data from all four co-aligned instruments. The reduction was carried out using standard screening criteria (using ascascreen), filtering data for Earth elevation angle, stable pointing, the South Atlantic Anomaly passages, and cutoff rigidity. Hot and flickering pixels were removed from the SIS events and SIS data were additionally screened for proximity to the bright Earth. Only well-calibrated events, with grades 0, 2, 3 or 4 were kept. GIS data were additionally screened to remove the background ring, and calibration source. Light curves were extracted in 16 s bins from each instrument in low (0.7–2 keV) and high (2–10 keV) energy bands, both from the source and from nearby source-free background region using xselect. Background subtraction was carried out and data from all four instruments were then combined accounting for different good times.
Lightcurves from both RXTE and ASCA data were then folded into 16 orbital phase bins according to the best available orbital ephemerides for each system (see Table 3). In each case the epoch of zero phase was adjusted to coincide with the presumed inferior conjunction of the secondary star. The published ephemerides of these systems are defined in various ways. If the ephemeris is based on optical photometric data, we assume that minimum light corresponds to the secondary star at inferior conjunction, or that maximum light indicates the WD at inferior conjunction. Similarly, if the ephemeris is based on spectroscopic data, we assume that red-to-blue crossing of the emission lines corresponds to the WD at superior conjunction, or that blue-to-red crossing of the absorption lines indicates the secondary star at inferior conjunction. Where no ephemeris is available, the phasing is arbitrary and zero phase is simply set to the start of the observation in each case.
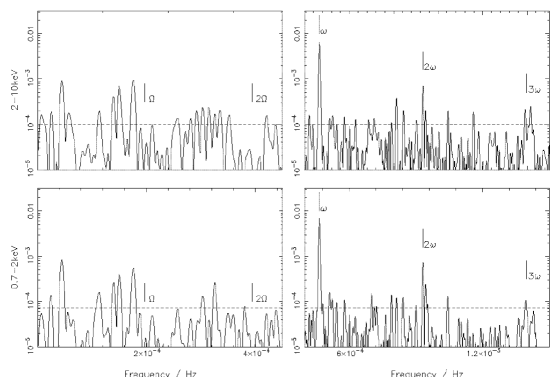
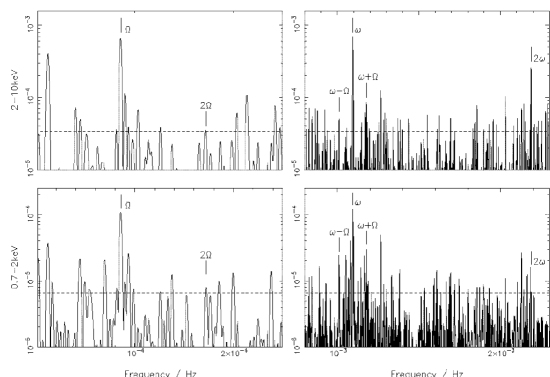
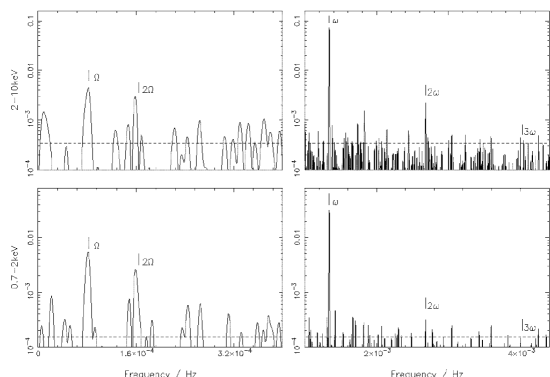
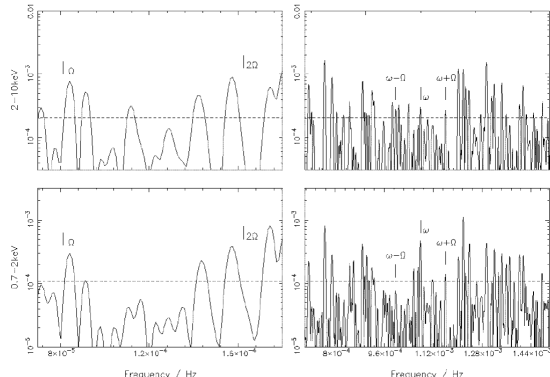
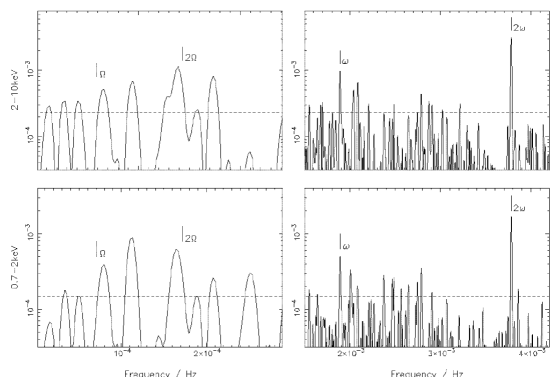
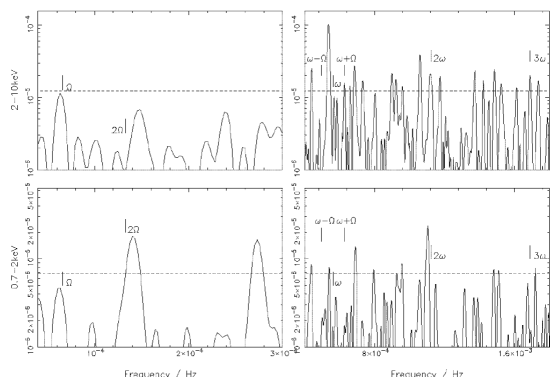
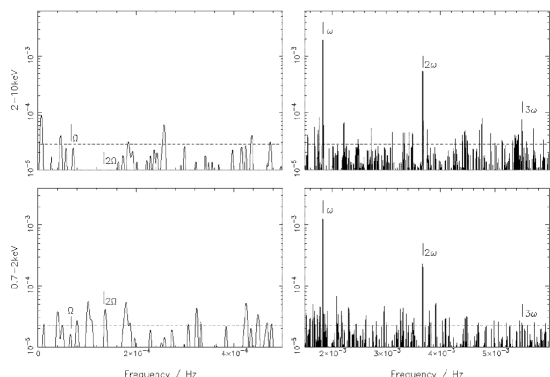
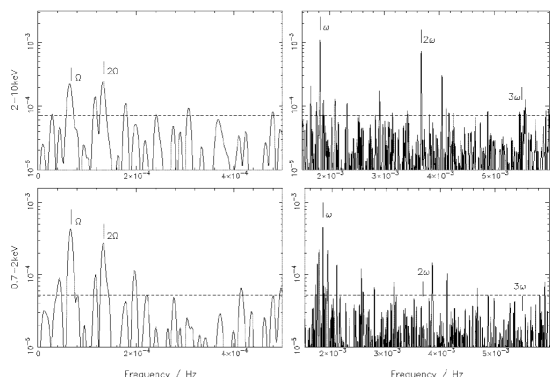
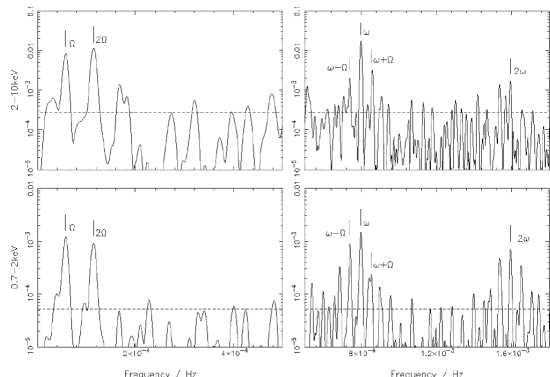
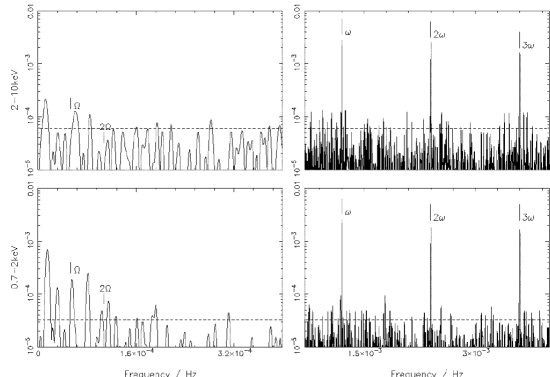
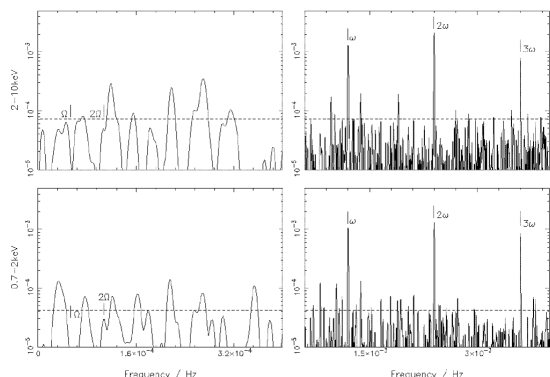
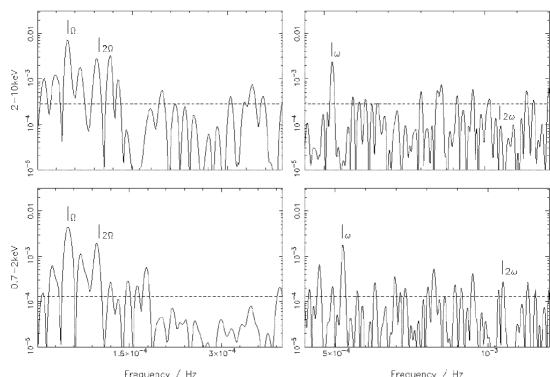
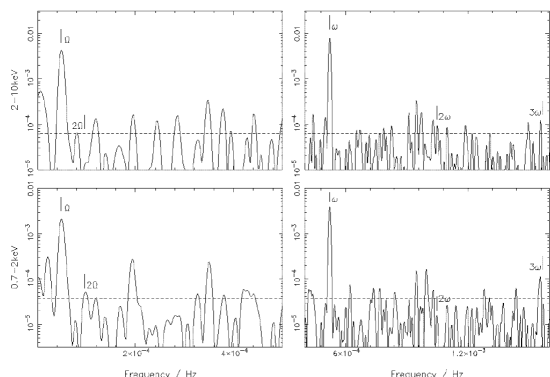
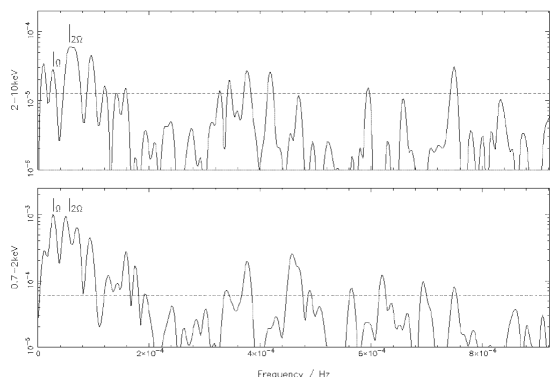
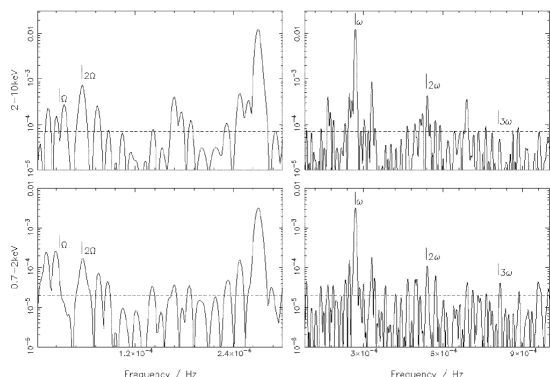
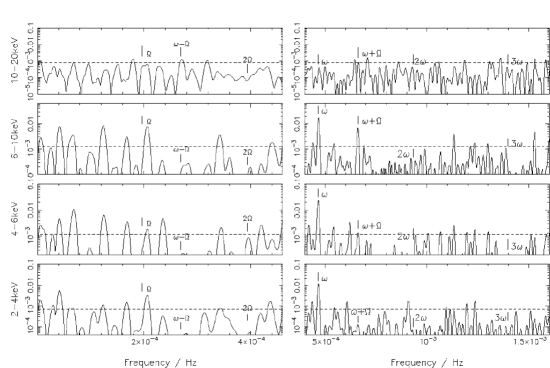
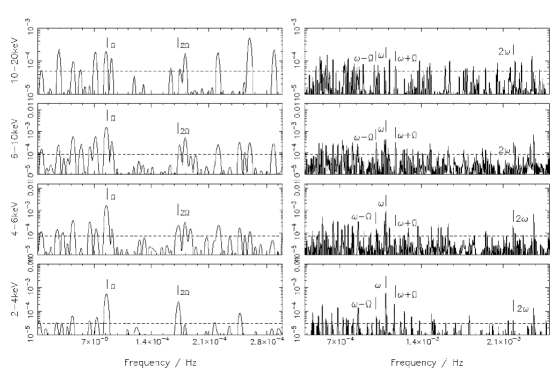
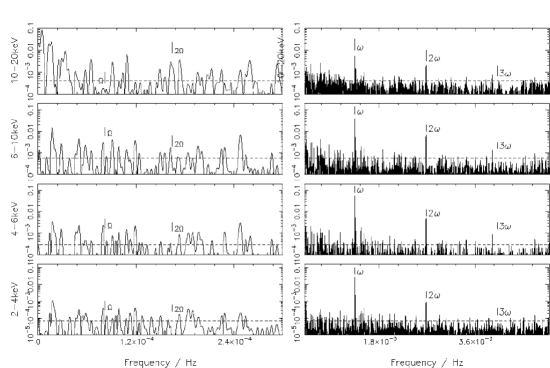
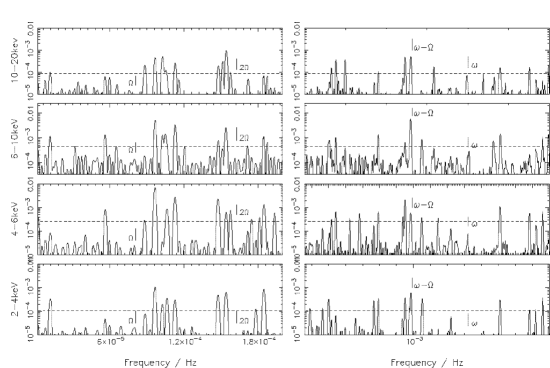
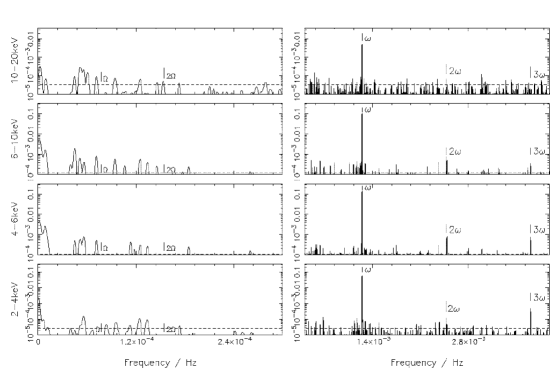
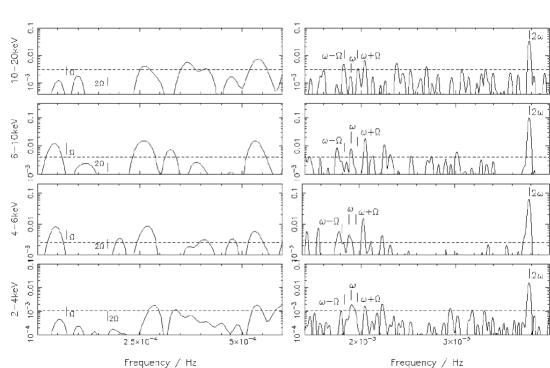
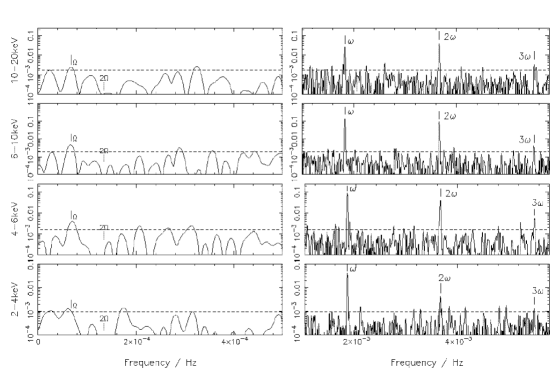
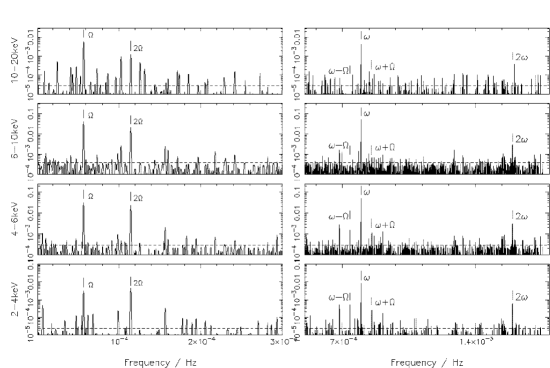
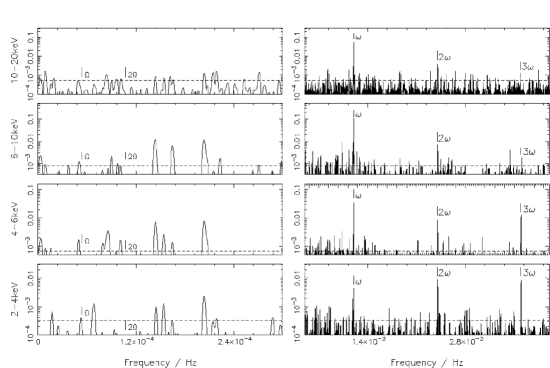
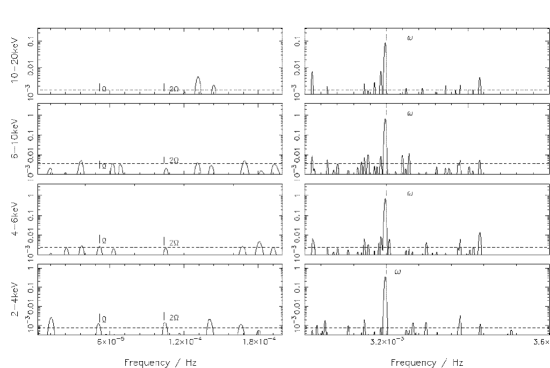
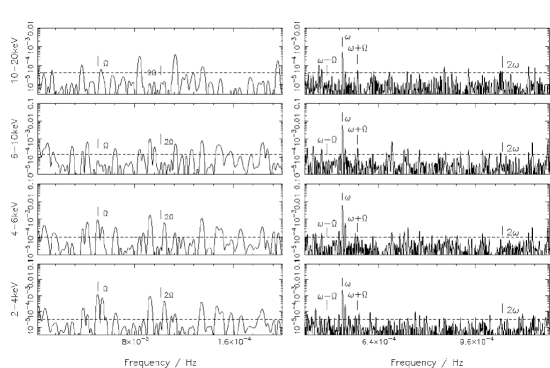
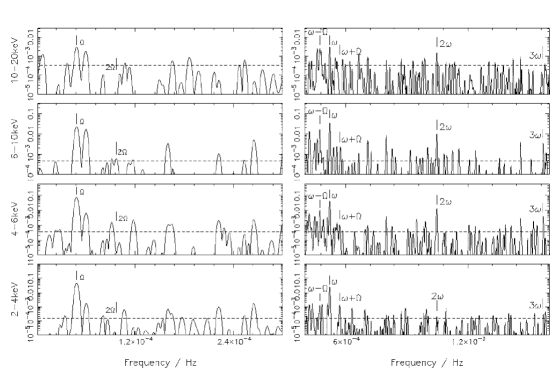
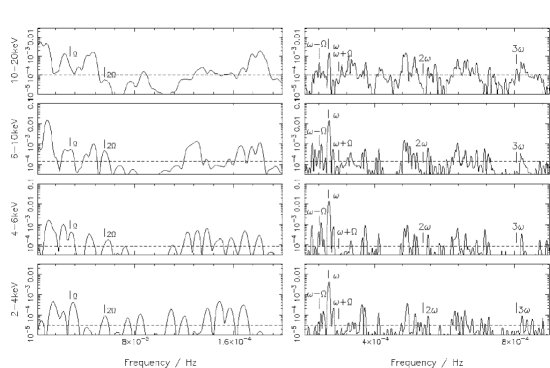
Power spectra of each lightcurve were constructed using the 1-dimensional clean algorithm of H.J. Lehto, which utilizes a variable gain. This is particularly suited to revealing the signals in unevenly sampled, multiply-periodic data and is quite effective at removing signals at the frequency Hz due to the sampling pattern imposed by the orbital period of both the ASCA and RXTE satellites (about 95 minutes in each case). Noise levels in cleaned power spectra are notoriously difficult to calculate (Norton et al. 1996). However, here we are in the fortunate position of knowing the expected system frequencies in advance, namely the various harmonics and sidebands of the spin and orbital frequencies of each system. Any power at a frequency other than those ‘expected’ can be considered spurious, and due to noise in the lightcurve. In order to estimate the noise level in a given power spectrum we therefore follow the prescription of Norton et al. (1996). This involves determining the power level above which there are discrete noise peaks in the power spectrum, where we define in this case as 1% of the total number of independent frequency samples in the spectrum (typically several thousand, depending on the length and sampling of that data set). This power level therefore represents that at which there is a 1% chance that any individual frequency bin will contain a noise peak. Hence, if the power at any of the expected system frequencies is greater than this noise level, there is a 99% chance that the signal at that frequency is not due to noise. Such peaks are therefore considered as ‘real’. Conversely, any peak that corresponds to one of the system frequencies, but which has a power below the noise level, is considered as spurious. This simple procedure allows us to make a direct comparison between one data set and another. Power spectra for a sample set of objects are shown in Figures 1 and 2 (the full set are available in the on-line version), with the noise level indicated by a dashed horizontal line in each case.
Finally, in order to quantify the degree of X-ray orbital modulation in each system, we found the best-fit sinusoid to each folded lightcurve, allowing the mean level, amplitude and phase as free parameters. We recognise that many of the orbital modulations present may not be well fit by a sinusoid, but this is the simplest way of characterising the depth in each system in a systematic manner. The folded lightcurves for a sample set of objects are shown in Figures 1 and 2 (the full set are available in the on-line version) with the best-fit sinusoids over-plotted in each case. Modulation depths were calculated as the peak-to-peak amplitude of the sinusoid divided by the maximum level, and are shown in Tables 4 and 5, along with the fitted phase of minimum flux and the reduced chi-squared values for the sinusoid fit in each case. 1 uncertainties on each parameter in the fit were calculated by rescaling the error bars on individual flux measurements so as to give a reduced chi-squared of unity for the best fit, and then finding the parameter range corresponding to an increase in reduced chi-squared of one. Figures 3a and 3b illustrate the data from Tables 4 and 5 respectively. An X-ray orbital modulation is considered to be confirmed only if the depth is non-zero above the level in all energy bands of a given observation, and if the value for the phase of minimum flux is consistent between the various energy bands.
4 Results
Below we discuss the detailed results for each of the systems, listed in order of increasing orbital period.
4.1 V1025 Cen
V1025 Cen was discovered by Buckley et al. (1998) and found to have a spin period of 2147s and a suggested orbital period of 1.41hr (Hellier et al. 1998). This object is little studied, with no published ephemeris and no determination of the binary inclination. From the ASCA data (Fig. 1a) no significant orbital modulation is seen in the phase folded lightcurves though there is some variability. The power spectra show signals only at the WD spin frequency and its harmonics. From the sinusoid fits to the orbital folded data we see that the modulation depths are consistent with zero (Table 4) in both energy bands. The RXTE data (Fig. 2a), like the ASCA data, show a variability in the folded lightcurves but the power spectra show nothing to indicate a clear orbital modulation. The sinusoid fits however, show evidence for a modulation depth that is just significant at the level at all energies (Table 5) and this is reinforced by the fitted phase of minimum flux being consistent with the same phase across the four energy bands.
4.2 BG CMi
BG CMi is a well-known IP with an orbital period of 3.25hr and a spin period of 913s. The published orbital ephemeris of Hellier (1997) is referenced to a spectroscopic eclipse believed to coincide with inferior conjunction of the secondary. BG CMi has a moderate inclination angle, inferred by de Martino et al. (1995) from the orbital modulation. The ASCA observation of BG CMi comprised two separate visits, separated by only a few days, in order to fully sample the orbital phase of the system whose period is close to twice the orbital period of the ASCA satellite. The resulting phase folded lightcurve (Fig. 1b) shows a strong dip at phase 0.7 in both energy bands and the corresponding power spectra reveal the expected strong signals at the orbital frequency. Sinusoid fits to the modulation yield large modulation depths which decrease with increasing energy. The RXTE phase folded lightcurves (Fig. 2b) also show a modulation dip at phase 0.7 in all energy bands, with corresponding power spectra peaks at both the orbital and twice the orbital frequency. From the sinusoid fitting, the modulation depths show a roughly constant amplitude at all energies.
4.3 V1223 Sgr
V1223 Sgr is amongst the brightest IPs in the 1–20 keV band, with an orbital period of 3.36hr (Jablonski & Steiner 1987), and a spin period of 745.63s (Osborne et al. 1985). The published orbital ephemeris of Jablonski & Steiner (1987) is referenced to photometric maximum. Watts et al. (1985), suggest that the inclination of this system is between 16∘ and 40∘. For this system a clear modulation dip is seen in the phase folded lightcurve of the ASCA data (Fig. 1c) at phase 0.65 and clearly seen in the power spectra with peaks at the orbital frequency and also at twice the orbital frequency. The sinusoid fits confirm a decreasing modulation depth with increasing energy. The RXTE data give a similar outcome (Fig. 2c). Although only a slight variation is seen in the folded lightcurves, a shallow modulation dip is apparent at the same phase as seen by ASCA. A correspondingly small peak at the orbital frequency is seen in the power spectra, though a lot of noise is present. The sinusoid fits yield small modulation depths that are roughly constant in all energy bands, or possibly even increase slightly with energy, and are significant across all four energy bands.
4.4 V2400 Oph
The first discless IP (Buckley et al. 1995 1997), has a spin period of 927s and an orbital period of 3.42hr, although no ephemeris has been published for V2400 Oph. It is believed to be at a low inclination of 10∘ (Hellier & Beardmore 2002). Observed with ASCA it shows little in the way of an orbital modulation in the phase folded lightcurve (Fig. 1d). The power spectra and sinusoid fit reveal a similar result, with only a possible peak close to the orbital frequency and a modulation depth that is consistent with zero. A modulation is more apparent in the RXTE observation (Fig. 2d). There is a clear variability in the phase folded lightcurves, with a shallow dip at (arbitrary) phase 0.7. Although no clear peaks are seen in the power spectra at the orbital frequency, the modulation depths from sinusoid fitting are small but just significant at the level and roughly constant across the energy bands, or possibly even increasing with energy as seen in V1223 Sgr.
4.5 AO Psc
AO Psc has a spin period of 805s and an orbital period at 3.59hr (White & Marshall 1981; Patterson & Price 1981). The orbital ephemeris of Kaluzny & Semeniuk (1988) is referenced to photometric maximum. AO Psc has features very similar to that of V1223 Sgr from photometric observations and the star’s optical spectrum (Patterson & Price 1981). This similarity is also evident in the folded lightcurves and power spectra of the ASCA observation (Fig. 1e). A strong modulation is clearly seen with a minimum close to phase 0.1, and clear peaks in the power spectra are seen at the orbital frequency. The fitted modulation depths decrease with increasing energy. With the RXTE observation, the situation is quite different (Fig. 2e). There is no strong modulation in the phase folded lightcurve and hardly any variability, and no orbital peaks in the power spectra, which are essentially delta functions at the WD spin frequency. The fitted modulation depths are not significant above the level. This system shows clear evidence that the orbital modulation in IPs can come and go on a timescale of a few years.
4.6 YY Dra
YY Dra is one of a small number of IPs that show outburst behaviour. Patterson et al. (1992) found the spin period to be 529s, while Mateo et al. (1991) found the orbital period at 3.96hr and derived the inclination to be . The orbital ephemeris of Haswell et al. (1997) is referenced to the inferior conjunction of the mass donor. YY Dra’s phase folded lightcurve from the ASCA data does show some variability, and this is reflected in the power spectra with a peak at twice the orbital frequency (Fig. 1f). However, the sinusoid fits reveal no significant modulation. The RXTE data too indicate only slight variability (Fig. 2f). This is confirmed in the power spectra where no modulations are seen at either the orbital or twice the orbital frequency. The sinusoid fits are consistent with zero modulation depth in all bands.
4.7 LS Peg
LS Peg has an orbital period of 4.19hr (Martínez-Pais et al. 1999; Taylor et al. 1999), and a claimed spin period of 1776s (Rodríguez-Gil et al. 2001) deduced from polarimetry. Recent analysis of the ASCA data on this object by Baskill et al. (2005) has detected a modulation at 1854s which is probably a more accurate determination of the spin period, and confirms this object as a genuine IP. The orbital ephemeris of Taylor et al. (1999) is based on the blue-to-red crossing of the emission lines, which we interpret as inferior conjunction of the white dwarf. Only observed with ASCA, this system shows a strong variability in its orbital phase folded lightcurve (Fig. 1g). However, the modulation depths are not significant above the level. There are peaks close to the orbital frequency and twice the orbital frequency, particularly in the lower energy band power spectrum. Although both power spectra are noisy, signals related to the recently-identified spin period are clearly seen in both bands.
4.8 V405 Aur
Haberl et al. (1994) found the orbital period of this system to be 4.15hr, and Skillman (1996) discovered the white dwarf spin period of 545.46s. The published orbital ephemeris, cited in Harlaftis & Horne (1999), is defined at inferior conjunction of the emission-line source (blue-to-red crossing) and a correction of 0.1 cycles anticlockwise is claimed to give the inferior conjunction of the secondary. The first of the two observations taken with ASCA shows a relatively unvarying phase folded lightcurve (Fig. 1h) with no modulation significant above the level, although the apparent phase of minimum flux is consistent at 0.7 between the two energy bands. The power spectra show no evidence for an orbital signal either. However, the second ASCA observation (Fig. 1i) shows a prominent dip in the folded lightcurves and the power spectra indicate significant power at both the orbital frequency and twice the orbital frequency. The sinusoid fits to these folded lightcurves struggle to fit the sharp dip in the low energy lightcurve near to phase 0.4 and instead find the sinusoidal minimum close to phase 0.55, in both energy bands. However, only the modulation depth in the low energy band is significant above the level. The RXTE data show something a little different (Fig. 2g). The folded lightcurves have a very slight dip in each energy band around phase 0.7–0.8, with a significant modulation, whose depth is roughly constant with energy. The power spectra indicate a small peak close to the orbital frequency in each case.
4.9 V2306 Cyg
The orbital period of V2306 Cyg is 4.35hr (Zharikov et al. 2002) and its spin period is 1466.66s (Norton et al. 2002). The published orbital ephemeris is referenced to inferior conjunction of the secondary from both photometry and spectroscopy (Zharikov et al. 2002). Another system to be observed only by ASCA, V2306 Cyg is the recently adopted name of 1WGA J1958.2+3232. The phase folded lightcurve of this system is an interesting one with a rather variable flux and an apparent modulation dip seen at phase 0.5 (Fig. 1j). If we compare with the power spectra, in the low energy band a marginal peak at twice the orbital frequency is seen with also a small peak associated with the orbital frequency. If we move to the higher energy band, the orbital frequency peak becomes more visible. The sinusoid fits are consistent with a decreasing modulation depth with increasing energy but the modulation is not seen above significance in either band.
4.10 FO Aqr
Patterson et al. (1998) found the orbital and spin periods to be 4.85hr and 1254s respectively with the ephemeris referred to the optical photometric minimum. This system shows a very prominent dip in the phase folded lightcurve from the ASCA data (Fig. 1k) in both energy bands. The power spectra show that the orbital frequency and its harmonic are detected strongly and the sinusoid fits confirm the decreasing modulation depth with increasing energy. The phase folded RXTE lightcurves also show a clear and prominent modulation in all four energy bands and the power spectra confirm this. The modulation depths determined from sinusoid fits also confirm what is shown in the figures, with a steadily decreasing modulation depth with increasing energy. The fitted phases of minimum flux suffer from the modulation profile being distinctly non-sinusoidal: in both observations, there is a deep minimum followed by a shallower minimum. In the ASCA data these minima occur at phases 0.9 and 0.3 respectively, whereas in the RXTE observation they have apparently shifted to phase 0.75 and 0.25. This apparent shift may be due to the shape of the modulation profile changing with energy, or alternatively it may be evidence for a changing accretion structure on a four year timescale as the accumulated phase error from the ephemeris is less than 0.02 in phase.
4.11 PQ Gem
The ephemeris for PQ Gem (Hellier 1997) is defined relative to red-to-blue crossing of the emission-lines. The system has an orbital period of 5.19hr and a spin period of 833.41s (Hellier 1997). In the first observation of PQ Gem with ASCA (Fig. 1l), the power spectra show a peak associated with the orbital frequency in the low energy band, but nothing is seen in the second observation (Fig. 1m). The folded lightcurves of both observations are unconvincing and although the modulation depths from the first observation are just significant at the level, those from the second observation are not. Moving to the RXTE data (Fig. 2i), there is again little evidence of orbital modulation in either the folded lighturves or power spectra, and the fitted modulation depths are once again consistent with zero at the level.
4.12 V709 Cas
Both the ephemeris and the orbital period for this system were determined by Bonnet-Bidaud et al. (2001), the ephemeris being with respect to the blue-to-red crossing time of emission lines and the orbital period is 5.34hr. The spin period of the white dwarf is known to be 312.8s (Haberl & Motch 1995; Norton et al. 1999). V709 Cas has been observed by RXTE only (Fig. 2j). It shows no evidence of an orbital modulation in either its folded lightcurves or power spectra, and the fitted modulation depths are all consistent with zero.
4.13 TV Col
TV Col has an orbital period of 5.486hr (Hutchings et al. 1981) and a spin period of 1911s (Schrijver et al. 1985) as well as a second photometric (superhump) period and a longer disc precession period. The orbital ephemeris (Hellier 1993) is referenced to a shallow photometric eclipse. TV Col shows very interesting features in both observations. The ASCA folded lightcurves (Fig. 1n) give a very clear and strong modulation in both energy bands with a minimum close to phase 0.0. The RXTE data reveal a similar effect (Fig. 2k) and although the modulation from the RXTE data is not as pronounced as that seen from ASCA, it is clearly present at low energies with a minimum around phase 0.9. The fitted modulation depths in both observations show the classic trend of decreasing depth with increasing energy. The power spectra of the ASCA data show strong peaks associated with the orbital frequency as do the RXTE power spectra, particularly at lower energies. As with FO Aqr, the apparent discrepancy between the phases of minimum flux in the two observations may be due to the changing shape of the modulation profile with energy and the inadequacy of a sinusoidal fit.
4.14 TX Col
TX Col is a supposedly a low inclination system (Mouchet et al. 1991) with an orbital period of 5.72hr and a spin period of 1911s (Buckley & Tuohy 1989), but no ephemeris has been published for it. TX Col reveals a strong modulation in the phase folded lightcurves of both satellites’ observations and in both the depth decreases with increasing energy. In the ASCA data (Fig. 1o) the dip occurs at (arbitrary) phase 0.2 whilst in RXTE it occurs at (arbitrary) phase 0.9. The power spectra of the two observations confirm what is seen in the folded lightcurves, each showing a strong peak at the orbital frequency.
4.15 AE Aqr
The magnetic propellor system AE Aqr is a very unusual IP with a long orbital period of 9.88hr (Welsh et al. 1993) and a short spin period of 33s (de Jager et al. 1994). The spectroscopic orbital ephemeris is referenced to superior conjunction of the white dwarf. Only observed by ASCA, the X-ray lightcurve exhibited strong flares during the observation. However, even after removing these sections, the phase folded lightcurve shows a large variation. The sinusoid fits imply a relatively large modulation depth in both bands with a consistent phase of minimum flux, but both are significant at only just above the level. The power spectra are very noisy at low frequencies although there are indications of peaks coincident with both twice the orbital frequency and the orbital frequency itself in each case.
4.16 V1062 Tau
This little studied system has no published ephemeris and no inclination angle is known. The spin period and orbital period are 3726s (Hellier et al. 2002) and 9.95hr (Remillard et al. 1994) respectively. The ASCA and RXTE data both show strong variability (Fig. 1q and 2n) and although sinusoid fits reveal modulation depths that either decrease with increasing energy or remain constant, these modulations are not significant above the level in any of the energy bands. No clear orbital modulation frequency is seen in any of the power spectra.
5 Summary of results
Of the sixteen IPs studied, seven systems show evidence for an X-ray orbital modulation whose amplitude decreases with increasing X-ray energy, in at least one observation. These are: BG CMi, FO Aqr, TV Col and TX Col in their observations with both ASCA and RXTE, and V1223 Sgr, AO Psc and V405 Aur (second observation), each in only their ASCA observations but not their RXTE observations. Interestingly, six of these plus EX Hya comprise the seven objects studied by Hellier et al. (1993) in the original EXOSAT investigation of IP X-ray orbital modulation which found such modulation to be ubiquitous. This result also confirms the findings of the various ROSAT and Ginga studies of individual objects over the last decade.
A further six systems show X-ray orbital modulation that is just significant at the level or whose depth is apparently constant across the energy bands in one observation. These are the RXTE observations of V1025 Cen, V1223 Sgr, V2400 Oph and V405 Aur, and the ASCA observations of V2306 Cyg and AE Aqr. Given the noisy nature of some of these data and the large uncertainties on the measured modulation depths, many of these are also consistent with a slight decrease in modulation depth with increasing energy.
Finally, nine systems are consistent with zero X-ray orbital modulation, across the energy range, in at least one observation. These are: V1025 Cen, V2400 Oph, LS Peg and V405 Aur (first observation) in their ASCA observations; YY Dra, PQ Gem and V1062 Tau in both their ASCA and RXTE observations; and AO Psc and V709 Cas in their RXTE observations.
There is clearly a variety of orbital modulation depths seen in these systems. In the lowest energy range (0.7 – 2 keV, ASCA), the depths measured at greater than significance vary from 100% (FO Aqr) to 28% (V1223 Sgr). Similarly, in the highest energy range (10 – 20 keV, RXTE), the largest modulation depth significantly detected is 34% (BG CMi), whilst the smallest is 12% (V1223 Sgr). The uncertainty in the modulation depth is generally of order a few percent, although sometimes as small as 1%. Hence, the smallest modulation depth that can reliably be detected is typically around 10%, although in a few cases we would be sensitive to detecting modulation depths of less than 5%. However, in no instance here do we see a modulation depth as small as this detected with much more than significance.
6 Discussion
From these results we conclude that X-ray orbital modulation in IPs is indeed widespread, but not ubiquitous. The dominant behaviour is that of decreasing modulation depth with increasing X-ray energy, suggesting photoelectric absorption as the cause. The most likely site for this additional absorption is in material thrown up at the edge of the accretion disc, due to impact by the accretion stream. As noted earlier, this is similar to the situation evisaged to cause X-ray dips in low mass X-ray binaries. The effect has also been realised in three-dimensional SPH simulations of cataclysmic variables by Kunze et al. (2001), who show that dips will be caused around orbital phase 0.7 if the system inclination angle is at least .
We note that an additional column density of cm-2 would produce modulation depths of at 1keV, at 3keV, at 5keV and have negligable effect above 8keV. Increasing the additional column density at X-ray minimum to cm-2 would increase these modulation depths to , and respectively, with significant modulation out to above 10keV (Norton & Watson 1989). A simple partial covering absorber can reduce the modulation depth at low energies significantly, whilst still maintaining the same effect above keV. The values in Tables 4 and 5 for those systems exhibiting a decreasing modulation depth with increasing energy suggest that additional column densities of this order may be present in many of these IPs, at least some of the time, at X-ray orbital minimum. A roughly constant modulation depth across a wide energy range, as seen in some systems, would imply that some fraction of the X-ray emission is completely blocked for part of the orbit, akin to an occultation.
In total, 11 systems out of the 16 observed here exhibit a possible X-ray orbital modulation during at least one of the observations we have analysed. If we add in EX Hya and XY Ari which are known to have an X-ray eclipse, then the proportion of systems showing X-ray orbital modulation is 72%. Assuming the systems to be randomly distributed in inclination angle, and that X-ray modulation is preferentially seen at higher angles, implies that an X-ray orbital modulation is visible for all inclination angles greater than around . If instead we only recognise the X-ray orbital modulation seen above a level throughout the energy range observed, namely that in BG CMi, V1223 Sgr, AO Psc, V405 Aur, FO Aqr, TV Col and TX Col (plus the two eclipsing systems), then the proportion of systems falls to 50% and the limiting inclination angle at which an orbital modulation is seen is increased to , which is in good agreement with the predictions from the SPH simulations of Kunze et al. (2001).
The orbital phase at which minimum X-ray flux occurs in different systems is seen to be predominantly in range . As noted above, stream impact with the outer edge of the disc is expected to occur around orbital phase 0.7, and this is indeed seen in BG CMi and V1223 Sgr (both observations of each), and FO Aqr (RXTE observation). Of the IPs with a well established orbital modulation and a previously published ephemeris, AO Psc stands out in having a minimum after phase zero instead of before. However, the accumulated phase error by the time of the ASCA observation is 0.1 (see Table 3), so this may not be significant. In some of the systems we have studied, we see evidence that may be interpreted as a variation in the orbital phase at which minimum X-ray flux occurs from one observation to the next, notably in FO Aqr and TV Col. This may indicate that the absorbing material is not fixed in its location at the edge of the disc. Alternatively, both the lack of dips centred near phase 0.7 and the apparent variability in phase of X-ray minimum may simply reflect greater inaccuracies in the published orbital ephemerides than claimed, or uncertainties in assigning a particular system geometry to a given phase determined from a spectroscopic ephemeris.
We also note that the presence of X-ray orbital modulation in a given IP may come and go on a timescale of years or months. This is particularly apparent in two systems: for AO Psc a modulation was seen by EXOSAT (1983 and 1985), Ginga (1990), ROSAT (1994) and ASCA (1994), but not by RXTE (1997); whereas for V1223 Sgr, a modulation was possibly seen by EXOSAT (1983 and 1984), not seen by Ginga (1991) and ROSAT (1994), then seen by ASCA (1994) and RXTE (1998). We also note the significant differences displayed by the two ASCA observations of V405 Aur taken only two-and-a-half years apart. This indicates that the visibility or size of whatever structure is responsible for producing the photoelectric absorption also varies considerably on this timescale. A similar effect is seen in some LMXBs (Smale et al. 1988; Schmidtke 1988) and is ascribed to the presence of a precessing, tilted accretion disc. Such a disc has been suggested as the cause of negative superhumps in cataclysmic variables (Patterson 1999) although simulations vary in their success at reproducing the phenomenon (Larwood 1998; Murray & Armitage 1998; Wood et al. 2000; Murray et al. 2002). Nonetheless, if a tilted disc is present in an IP, a raised bulge at its outer edge caused by stream impact could move into and out of the line of sight to the X-ray source as its extent above the orbital plane varies with disc precession phase. In this way, a varying presence or depth of X-ray orbital modulation would naturally arise. The only IP with a confirmed tilted precessing disc is TV Col which has a 4 d disc precession period (Barrett et al. 1988), but it is conceivable that such a phenomenon may also be present in other systems. It would be interesting to monitor the X-ray orbital modulation from TV Col throughout its 4-day disc precession period in order to test this hypothesis.
Finally, we note that the apparently constant modulation depth as a function of energy seen in some IPs we have studied, at some epochs (i.e. RXTE observations of V1223 Sgr, V2400 Oph and V405 Aur), might indicate that an additional emission component is responsible for some or all of the variation in flux as a function of orbital phase. Alternatively, or additionally, it might imply that the absorbing region is highly structured or patchy and so the amount of absorption does not simply decrease with increasing energy. However, we see no constant or increasing modulation depth with increasing X-ray energy at a level much greater than significance so do not place too much weight on this interpretation.
Acknowledgements.
This research has made use of data obtained from the High Energy Astrophysics Science Archive Research Center (HEASARC), provided by NASA’s Goddard Space Flight Center. We thank the anonymous referee for several helpful suggestions which have improved the paper.References
- Barrett et al. (1988) Barrett, P., O’Donoghue, D., & Warner, B. 1988, MNRAS, 233, 759
- Baskill et al. (2005) Baskill, D., Wheatley, P., & Osborne, J. 2005, MNRAS, 000, 000
- Beardmore et al. (1998) Beardmore, A. P., Mukai, K., Norton, A. J., Osborne, J. P., & Hellier, C. 1998, MNRAS, 297, 337
- Beardmore et al. (2000) Beardmore, A. P., Osborne, J. P., & Hellier, C. 2000, MNRAS, 315, 307
- Bonnet-Bidaud et al. (2001) Bonnet-Bidaud, J. M., Mouchet, M., de Martino, D., Matt, G., & Motch, C. 2001, A&A, 374, 1003
- Bradt et al. (1993) Bradt, H. V., Rothschild, R. E., & Swank, J. H. 1993, A&AS, 97, 355
- Buckley et al. (1998) Buckley, D. A. H., Cropper, M., Ramsay, G., & Wickramasinghe, D. T. 1998, MNRAS, 299, 83
- Buckley et al. (1997) Buckley, D. A. H., Haberl, F., Motch, C., et al. 1997, MNRAS, 287, 117
- Buckley et al. (1995) Buckley, D. A. H., Sekiguchi, K., Motch, C., et al. 1995, MNRAS, 275, 1028
- Buckley & Tuohy (1989) Buckley, D. A. H. & Tuohy, I. R. 1989, ApJ, 344, 376
- Casares et al. (1996) Casares, J., Mouchet, M., Martinez-Pais, I. G., & Harlaftis, E. T. 1996, MNRAS, 282, 182
- Choi et al. (1999) Choi, C., Dotani, T., & Agrawal, P. C. 1999, ApJ, 525, 399
- de Jager et al. (1994) de Jager, O. C., Meintjes, P. J., O’Donoghue, D., & Robinson, E. L. 1994, MNRAS, 267, 577
- de Martino et al. (2002) de Martino, D., Matt, G., Mukai, K., et al. 2002, in Astronomical Society of the Pacific Conference Series, 143
- de Martino et al. (1995) de Martino, D., Mouchet, M., Bonnet-Bidaud, J. M., et al. 1995, A&A, 298, 849
- Eracleous (1999) Eracleous, M. 1999, in Astronomical Society of the Pacific Conference Series, 343
- Haberl & Motch (1995) Haberl, F. & Motch, C. 1995, A&A, 297, L37
- Haberl et al. (1994) Haberl, F., Throstensen, J. R., Motch, C., et al. 1994, A&A, 291, 171
- Harlaftis & Horne (1999) Harlaftis, E. T. & Horne, K. 1999, MNRAS, 305, 437
- Haswell et al. (1997) Haswell, C. A., Patterson, J., Thorstensen, J. R., Hellier, C., & Skillman, D. R. 1997, ApJ, 476, 847
- Hellier (1993) Hellier, C. 1993, MNRAS, 264, 132
- Hellier (1997) Hellier, C. 1997, MNRAS, 291, 71
- Hellier & Beardmore (2002) Hellier, C. & Beardmore, A. P. 2002, MNRAS, 331, 407
- Hellier et al. (1998) Hellier, C., Beardmore, A. P., & Buckley, D. A. H. 1998, MNRAS, 299, 851
- Hellier et al. (2002) Hellier, C., Beardmore, A. P., & Mukai, K. 2002, A&A, 389, 904
- Hellier et al. (1993) Hellier, C., Garlick, M. A., & Mason, K. O. 1993, MNRAS, 260, 299
- Hellier et al. (1996) Hellier, C., Mukai, K., Ishida, M., & Fujimoto, R. 1996, MNRAS, 280, 877
- Hutchings et al. (1981) Hutchings, J. B., Crampton, D., Cowley, A. P., Thorstensen, J. R., & Charles, P. A. 1981, ApJ, 249, 680
- Jablonski & Steiner (1987) Jablonski, F. & Steiner, J. E. 1987, ApJ, 323, 672
- James et al. (2002) James, C. H., Ramsay, G., Mark Cropper, M. C., & Branduardi-Raymont, G. 2002, MNRAS, 336, 550
- Kaluzny & Semeniuk (1988) Kaluzny, J. & Semeniuk, I. 1988, Informational Bulletin on Variable Stars, 3145, 1
- Kunze et al. (2001) Kunze, S., Speith, R., & Hessman, F. V. 2001, MNRAS, 322, 499
- Larwood (1998) Larwood, J. 1998, MNRAS, 299, L32
- Lipkin et al. (2004) Lipkin, Y. M., Leibowitz, E. M., & Orio, M. 2004, MNRAS, 349, 1323
- Martínez-Pais et al. (1999) Martínez-Pais, I. G., Rodríguez-Gil, P., & Casares, J. 1999, MNRAS, 305, 661
- Mason (1997) Mason, K. O. 1997, MNRAS, 285, 493
- Mateo et al. (1991) Mateo, M., Szkody, P., & Garnavich, P. 1991, ApJ, 370, 370
- Mouchet et al. (1991) Mouchet, M., Bonnet-Bidaud, J. M., Buckley, D. A. H., & Tuohy, I. R. 1991, A&A, 250, 99
- Mukai et al. (1994) Mukai, K., Ishida, M., & Osborne, J. P. 1994, PASJ, 46, L87
- Murray & Armitage (1998) Murray, J. R. & Armitage, P. J. 1998, MNRAS, 300, 561
- Murray et al. (2002) Murray, J. R., Chakrabarty, D., Wynn, G. A., & Kramer, L. 2002, MNRAS, 335, 247
- Norton et al. (1999) Norton, A. J., Beardmore, A. P., Allan, A., & Hellier, C. 1999, A&A, 347, 203
- Norton et al. (1996) Norton, A. J., Beardmore, A. P., & Taylor, P. 1996, MNRAS, 280, 937
- Norton et al. (1997) Norton, A. J., Hellier, C., Beardmore, A. P., et al. 1997, MNRAS, 289, 362
- Norton et al. (1992a) Norton, A. J., McHardy, I. M., Lehto, H. J., & Watson, M. G. 1992a, MNRAS, 258, 697
- Norton et al. (2002) Norton, A. J., Quaintrell, H., Katajainen, S., et al. 2002, A&A, 384, 195
- Norton & Watson (1989) Norton, A. J. & Watson, M. G. 1989, MNRAS, 237, 853
- Norton et al. (1992b) Norton, A. J., Watson, M. G., King, A. R., Lehto, H. J., & McHardy, I. M. 1992b, MNRAS, 254, 705
- Norton et al. (2004) Norton, A. J., Wynn, G. A., & Somerscales, R. V. 2004, ApJ, 614, 349
- Osborne et al. (1985) Osborne, J. P., Rosen, R., Mason, K. O., & Beuermann, K. 1985, Space Science Reviews, 40, 143
- Patterson (1994) Patterson, J. 1994, PASP, 106, 209
- Patterson (1999) Patterson, J. 1999, in Disk Instabilities in Close Binary Systems, 61
- Patterson et al. (1998) Patterson, J., Kemp, J., Richman, H. R., et al. 1998, PASP, 110, 415
- Patterson & Price (1981) Patterson, J. & Price, C. M. 1981, ApJ letter, 243, L83
- Patterson et al. (1992) Patterson, J., Schwartz, D. A., Pye, J. P., et al. 1992, ApJ, 392, 233
- Rana et al. (2004) Rana, V. R., Singh, K. P., Schlegel, E. M., & Barrett, P. 2004, AJ, 127, 489
- Remillard et al. (1994) Remillard, R. A., Bradt, H. V., Brissenden, R. J. V., et al. 1994, ApJ, 428, 785
- Revnivtsev et al. (2004) Revnivtsev, M., Lutovinov, A., Suleimanov, V., Sunyaev, R., & Zheleznyakov, V. 2004, A&A, 426, 253
- Rodríguez-Gil et al. (2001) Rodríguez-Gil, P., Casares, J., Martínez-Pais, I. G., Hakala, P., & Steeghs, D. 2001, ApJ letter, 548, L49
- Rosen et al. (1991) Rosen, S. R., Mason, K. O., Mukai, K., & Williams, O. R. 1991, MNRAS, 249, 417
- Schlegel (1999) Schlegel, E. M. 1999, in Astronomical Society of the Pacific Conference Series, 60
- Schmidtke (1988) Schmidtke, P. C. 1988, AJ, 95, 1528
- Schrijver et al. (1985) Schrijver, J., Brinkman, A. C., van der Woerd, H., Watson, M. G., & King, A. R. 1985, Space Science Reviews, 40, 121
- Skillman (1996) Skillman, D. R. 1996, PASP, 108, 130
- Smale et al. (1988) Smale, A. P., Mason, K. O., White, N. E., & Gottwald, M. 1988, MNRAS, 232, 647
- Szkody et al. (2002) Szkody, P., Nishikida, K., Erb, D., et al. 2002, AJ, 123, 413
- Szkody et al. (2001) Szkody, P., Nishikida, K., Long, K. S., & Fried, R. 2001, AJ, 121, 2761
- Tanaka et al. (1994) Tanaka, Y., Inoue, H., & Holt, S. S. 1994, PASJ, 46, L37
- Taylor et al. (1999) Taylor, C. J., Thorstensen, J. R., & Patterson, J. 1999, PASP, 111, 184
- Taylor et al. (1997) Taylor, P., Beardmore, A. P., Norton, A. J., Osborne, J. P., & Watson, M. G. 1997, MNRAS, 289, 349
- Warner (1995) Warner, B. 1995, Cataclysmic variable stars (Cambridge Astrophysics Series, Cambridge, New York: Cambridge University Press, —c1995)
- Watts et al. (1985) Watts, D. J., Giles, A. B., Greenhill, J. G., Hill, K., & Bailey, J. 1985, MNRAS, 215, 83
- Welsh et al. (1993) Welsh, W. F., Horne, K., & Gomer, R. 1993, ApJ, 410, L39
- White & Marshall (1981) White, N. E. & Marshall, F. E. 1981, ApJ letter, 249, L25
- Wood et al. (2000) Wood, M. A., Montgomery, M. M., & Simpson, J. C. 2000, ApJ, 535, L39
- Yazgan & Balman (2002) Yazgan, E. & Balman, Ş. 2002, in Astronomical Society of the Pacific Conference Series, 177
- Zhang et al. (1993) Zhang, W., Giles, A. B., Jahoda, K., et al. 1993, in Proc. SPIE Vol. 2006, p. 324-333, EUV, X-Ray, and Gamma-Ray Instrumentation for Astronomy IV, Oswald H. Siegmund; Ed., 324–333
- Zharikov et al. (2002) Zharikov, S. V., Tovmassian, G. H., & Echevarría, J. 2002, A&A, 390, L23
| Target name | Observation start time | Duration / s | GIS exposure / s | SIS exposure / s | Ref. |
|---|---|---|---|---|---|
| V1025 Cen | 1997-01-14 08:46:26 | 131048 | 60832 | 48320 | – |
| BG CMi | 1996-04-14 18:17:33 | 198956 | 85440 | 72352 | – |
| V1223 Sgr | 1994-04-24 04:15:47 | 153904 | 59168 | 55552 | [1] |
| V2400 Oph | 1996-03-18 20:26:45 | 206031 | 83840 | 76320 | – |
| AO Psc | 1994-06-22 06:52:43 | 196679 | 82336 | 75808 | [2] |
| YY Dra | 1997-05-06 09:16:20 | 80064 | 32896 | 24448 | [3] |
| LS Peg | 1998-11-23 11:21:58 | 79728 | 29936 | 28176 | [4] |
| V405 Aur (1) | 1996-10-05 13:36:29 | 165263 | 82368 | 71323 | – |
| V405 Aur (2) | 1999-03-21 09:24:39 | 91570 | 44064 | 38272 | – |
| V2036 Cyg | 1998-05-15 03:18:51 | 56816 | 28352 | 25248 | [5] |
| FO Aqr | 1993-05-20 22:12:34 | 96176 | 37952 | 35552 | [6],[7] |
| PQ Gem (1) | 1994-11-04 21:44:28 | 189439 | 79872 | 71200 | [8],[9] |
| PQ Gem (2) | 1999-10-19 16:23:56 | 98800 | 42912 | 39296 | – |
| TV Col | 1995-02-28 06:03:42 | 102998 | 39936 | 36448 | [10] |
| TX Col | 1994-10-03 07:04:37 | 96992 | 41888 | 35680 | [11] |
| AE Aqr | 1995-10-13 23:40:13 | 85842 | 43968 | 39264 | [12],[13] |
| V1062 Tau | 1998-02-16 21:33:55 | 137264 | 61248 | 55136 | [14] |
References: [1] Beardmore et al. (2000), [2] Hellier et al. (1996), [3] Yazgan & Balman (2002), [4] Szkody et al. (2001), [5] Norton et al. (2002), [6] Beardmore et al. (1998), [7] Mukai et al. (1994), [8] James et al. (2002), [9] Mason (1997), [10] Rana et al. (2004), [11] Norton et al. (1997), [12] Eracleous (1999), [13] Choi et al. (1999), [14] Hellier et al. (2002)
| Target name | Observation start time | Total exposure time / s | Ref. |
|---|---|---|---|
| V1025 Cen | 1997-01-14 17:03:58.2 | 89437 | – |
| BG CMi | 1997-01-07 11:40:56.9 | 98894 | – |
| V1223 Sgr | 1998-11-30 22:28:07.7 | 136152 | [1] |
| V2400 Oph | 1996-03-12 21:17:04.7 | 89649 | – |
| AO Psc | 1997-09-06 01:09:00.3 | 94351 | [2] |
| YY Dra | 1996-03-13 08:57:09.8 | 29243 | [3] |
| V405 Aur | 1996-04-26 00:50:55.1 | 57899 | – |
| FO Aqr | 1997-05-14 19:01:23.2 | 180380 | – |
| PQ Gem | 1997-01-27 03:54:38.0 | 137874 | [2],[4] |
| V709 Cas | 1997-03-28 00:10:54.0 | 59485 | [5] |
| TV Col | 1996-08-10 14:57:53.9 | 83731 | [6] |
| TX Col | 1997-03-25 06:09:29.4 | 68555 | – |
| V1062 Tau | 1998-02-16 06:29:55.4 | 146526 | [7] |
| Source | Orbital Ephemeris/HJD† | Ref. | Zero Phase/HJD | Accumulated phase error |
|---|---|---|---|---|
| (inf. conj. of ) | at epoch of X-ray observations | |||
| V1025 Cen∗ | 0.05876 | [1] | – | – |
| BG CMi | 2445020.396(2)+0.13474854(10)E | [2] | 2445020.396 | ASCA(1): 0.03 ; ASCA(2): 0.03 ; RXTE: 0.03 |
| V1223 Sgr | 2444749.986(3)+0.1402440(4)E | [3] | 2444750.056 | ASCA: 0.10 ; RXTE: 0.13 |
| V2400 Oph∗ | 0.1429167 | [4] | – | – |
| AO Psc | 2444864.1428(28)+0.1496252(5)E | [5] | 2444864.217 | ASCA: 0.10 ; RXTE: 0.13 |
| YY Dra | 2446863.4376(5)+0.16537398(17)E | [6] | 2446863.4376 | ASCA: 0.02 ; RXTE: 0.02 |
| LS Peg | 2450358.8964(9)+0.174774(3)E | [7] | 2450358.983 | ASCA: 0.08 |
| V405 Aur | 2449474.6446(15)+0.172624(1)E | [8] | 2449474.744 | ASCA(1): 0.3 ; ASCA(2): 0.6 ; RXTE: 0.2 |
| V2306 Cyg | 2451762.9527(1)+0.181195(339)E | [9] | 2451762.9527 | ASCA: undef. |
| FO Aqr | 2444782.869(2)+0.2020596(1)E | [10] | 2444782.869 | ASCA: 0.011 ; RXTE: 0.014 |
| PQ Gem | 2449333.984(4)+0.216359(3)E | [11] | 2449333.984 | ASCA(1): 0.02 ; ASCA(2): 0.13 ; RXTE: 0.07 |
| V709 Cas | 2451048.0575(2)+0.2225(2)E | [12] | 2451048.168 | RXTE: undef. |
| TV Col | 2448267.4893(5)+0.2285999(2)E | [13] | 2448267.4893 | ASCA: 0.005 ; RXTE: 0.007 |
| TX Col∗ | 0.23825 | [14] | – | – |
| AE Aqr | 2449281.42222(8)+0.41165553(5)E | [15] | 2449281.42222 | ASCA: 0.0002 |
| V1062 Tau∗ | 0.41467 | [16] | – | – |
∗ - No ephemeris available.
† numbers in brackets in the ephemerides indicate the uncertainty on the last digit.
References: [1] Buckley et al. (1998), [2] Hellier (1997), [3] Jablonski & Steiner (1988),
[4] Hellier & Beardmore (2002), [5] Kaluzny & Semeniuk (1988), [6] Haswell et al. (1997),
[7] Taylor et al. (1999) ,[8] Thorstensen (1997), private communication, cited in Harlaftis & Horne (1999),
[9] Zharikov et al. (2002), [10] Patterson et al. (1998b), [11] Hellier (1997),
[12] Bonnet-Bidaud et al. (2001), [13] Hellier (1993), [14] Mouchet et al. (1991),
[15] Casares et al. (1996), [16] Lipkin et al. (2004)
| Source | 0.7–2 keV | phase of | 2–10 keV | phase of | ||
|---|---|---|---|---|---|---|
| depth | min. flux | depth | min. flux | |||
| V1025 Cen | 3%3% | 0.730.17 | 5.8 | 2%2% | 0.760.16 | 4.7 |
| BG CMi | 82%9% | 0.730.02 | 11 | 43%4% | 0.700.01 | 9.8 |
| V1223 Sgr | 28%3% | 0.640.02 | 18 | 14%2% | 0.650.02 | 12 |
| V2400 Oph | 4%2% | 0.650.09 | 8.2 | 4%2% | 0.570.10 | 15 |
| AO Psc | 47%5% | 0.080.02 | 29 | 25%4% | 0.070.02 | 24 |
| YY Dra | 9%4% | 0.690.07 | 10 | 5%5% | 0.700.14 | 15 |
| LS Peg | 21%10% | 0.090.09 | 1.5 | 21%8% | 0.050.06 | 2.2 |
| V405 Aur(1) | 6%2% | 0.710.07 | 4.0 | 2%1% | 0.680.15 | 1.7 |
| V405 Aur(2) | 21%4% | 0.540.03 | 6.3 | 9%3% | 0.570.04 | 3.4 |
| V2306 Cyg | 25%8% | 0.560.06 | 3.3 | 18%6% | 0.560.04 | 3.2 |
| FO Aqr | 102%13% | 0.040.02 | 26 | 70%10% | 0.990.02 | 90 |
| PQ Gem(1) | 10%3% | 0.830.05 | 5.1 | 4%1% | 0.790.05 | 1.3 |
| PQ Gem(2) | 3%4% | 0.620.26 | 6.2 | 3%3% | 0.460.14 | 4.6 |
| TV Col | 47%6% | 0.980.02 | 32 | 28%4% | 0.980.02 | 22 |
| TX Col | 58%6% | 0.200.01 | 7.0 | 49%3% | 0.220.01 | 3.9 |
| AE Aqr | 34%9% | 0.920.03 | 14 | 30%7% | 0.890.04 | 3.1 |
| V1062 Tau | 35%12% | 0.160.06 | 32 | 17%8% | 0.160.08 | 40 |
| Source | 2–4 keV | phase of | 4–6 keV | phase of | ||
|---|---|---|---|---|---|---|
| depth | min. flux | depth | min. flux | |||
| V1025 Cen | 13%3% | 0.530.03 | 1.5 | 14%3% | 0.610.03 | 2.7 |
| BG CMi | 39%9% | 0.720.02 | 29 | 32%5% | 0.700.02 | 31 |
| V1223 Sgr | 7%2% | 0.660.04 | 26 | 8%2% | 0.650.04 | 88 |
| V2400 Oph | 9%2% | 0.720.02 | 8.2 | 10%2% | 0.710.02 | 23 |
| AO Psc | 7%2% | 0.100.05 | 9.4 | 3%1% | 0.050.07 | 10 |
| YY Dra | 5%3% | 0.880.09 | 1.4 | 1%2% | undefined | 2.8 |
| V405 Aur | 8%2% | 0.690.04 | 1.2 | 7%1% | 0.740.03 | 1.3 |
| FO Aqr | 57%14% | 0.810.03 | 300 | 44%8% | 0.780.03 | 770 |
| PQ Gem | 6%3% | 0.730.07 | 4.5 | 6%2% | 0.810.05 | 5.0 |
| V709 Cas | 3%2% | 0.140.10 | 5.8 | 3% 1% | 0.130.06 | 5.5 |
| TV Col | 25%4% | 0.880.03 | 61 | 12%3% | 0.890.04 | 68 |
| TX Col | 43%4% | 0.860.01 | 12 | 37%2% | 0.870.01 | 8.9 |
| V1062 Tau | 25%11% | 0.310.06 | 80 | 20%7% | 0.280.05 | 120 |
| Source | 6–10 keV | phase of | 10-20 keV | phase of | ||
|---|---|---|---|---|---|---|
| depth | min. flux | depth | min. flux | |||
| V1025 Cen | 12%3% | 0.520.04 | 2.1 | 31%6% | 0.580.03 | 1.5 |
| BG CMi | 31%4% | 0.700.01 | 22 | 34%4% | 0.680.01 | 5.6 |
| V1223 Sgr | 9%2% | 0.650.03 | 110 | 12%3% | 0.620.03 | 70 |
| V2400 Oph | 10%3% | 0.690.03 | 39 | 11%4% | 0.690.04 | 9.2 |
| AO Psc | 2%1% | 0.980.13 | 9.1 | 3%1% | 0.080.05 | 0.7 |
| YY Dra | 1%2% | undefined | 2.2 | 2%3% | undefined | 0.8 |
| V405 Aur | 7%1% | 0.770.03 | 1.1 | 10%2% | 0.850.04 | 0.7 |
| FO Aqr | 34%6% | 0.780.03 | 650 | 26%6% | 0.810.03 | 130 |
| PQ Gem | 6%2% | 0.830.05 | 6.1 | 4%2% | 0.750.10 | 1.7 |
| V709 Cas | 2%1% | 0.090.10 | 6.3 | 2%1% | 0.940.10 | 2.4 |
| TV Col | 6%2% | 0.940.06 | 57 | 7%3% | 0.130.07 | 7.7 |
| TX Col | 28%3% | 0.870.02 | 11 | 28%4% | 0.900.02 | 5.2 |
| V1062 Tau | 18%7% | 0.260.05 | 160 | 25%8% | 0.240.04 | 71 |
![[Uncaptioned image]](/html/astro-ph/0503658/assets/x1.png)
![[Uncaptioned image]](/html/astro-ph/0503658/assets/x3.png)
![[Uncaptioned image]](/html/astro-ph/0503658/assets/x5.png)
![[Uncaptioned image]](/html/astro-ph/0503658/assets/x7.png)
![[Uncaptioned image]](/html/astro-ph/0503658/assets/x9.png)

![[Uncaptioned image]](/html/astro-ph/0503658/assets/x11.png)
![[Uncaptioned image]](/html/astro-ph/0503658/assets/x13.png)
![[Uncaptioned image]](/html/astro-ph/0503658/assets/x15.png)
![[Uncaptioned image]](/html/astro-ph/0503658/assets/x17.png)
![[Uncaptioned image]](/html/astro-ph/0503658/assets/x19.png)

![[Uncaptioned image]](/html/astro-ph/0503658/assets/x21.png)
![[Uncaptioned image]](/html/astro-ph/0503658/assets/x23.png)
![[Uncaptioned image]](/html/astro-ph/0503658/assets/x25.png)
![[Uncaptioned image]](/html/astro-ph/0503658/assets/x27.png)
![[Uncaptioned image]](/html/astro-ph/0503658/assets/x29.png)
![[Uncaptioned image]](/html/astro-ph/0503658/assets/x31.png)
![[Uncaptioned image]](/html/astro-ph/0503658/assets/x33.png)
![[Uncaptioned image]](/html/astro-ph/0503658/assets/x35.png)
![[Uncaptioned image]](/html/astro-ph/0503658/assets/x37.png)
![[Uncaptioned image]](/html/astro-ph/0503658/assets/x39.png)
![[Uncaptioned image]](/html/astro-ph/0503658/assets/x41.png)
![[Uncaptioned image]](/html/astro-ph/0503658/assets/x43.png)
![[Uncaptioned image]](/html/astro-ph/0503658/assets/x45.png)
![[Uncaptioned image]](/html/astro-ph/0503658/assets/x47.png)
![[Uncaptioned image]](/html/astro-ph/0503658/assets/x49.png)
![[Uncaptioned image]](/html/astro-ph/0503658/assets/x51.png)
![[Uncaptioned image]](/html/astro-ph/0503658/assets/x53.png)
![[Uncaptioned image]](/html/astro-ph/0503658/assets/x55.png)
![[Uncaptioned image]](/html/astro-ph/0503658/assets/x57.png)
![[Uncaptioned image]](/html/astro-ph/0503658/assets/x59.png)
![[Uncaptioned image]](/html/astro-ph/0503658/assets/x61.png)
