X-ray line tomography of AGN-induced motion in clusters of galaxies
Abstract
The thermal broadening of emission lines of heavy ions is small enough such that Doppler shifts due to bulk motions may be detected with the next generation of X-ray observatories. This opens up the possibility to study gas velocities in the intra-cluster medium. Here we study the effect of bulk motions induced by a central active galactic nucleus (AGN) on the emission lines around the FeXXV complex. We have modelled the evolution of AGN-induced bubbles in a realistic cosmological framework and studied the resulting FeXXV line profiles. We found that in clusters with AGN feedback, motions induced by the inflation of bubbles and their buoyant rise lead to distinct features in the iron emission lines that are detectable with a spectral resolution of 10 eV. These observations will help to determine the mechanical energy that resides in the bubbles and thereby the kinetic luminosity of the AGN.
1 Introduction
Feedback by active galactic nuclei (AGN) is widely believed to be relevant for the baryonic part of structure formation. Moreover, it is likely to play a role in explaining the lower than expected mass deposition rates in cooling flows (e.g. Fabian 2003, Hoeft & Brüggen 2004 and references therein). Because the interaction between AGN and ambient medium is more easily observed in clusters of galaxies than in galaxies, clusters serve as laboratories for the role of AGN feedback in galaxy formation.
However, the operation of AGN feedback depends crucially on the nature of the interaction between the AGN and the intra-cluster medium (ICM). In recent years, high-resolution X-ray observations of cooling flow clusters with Chandra have revealed a number of clusters that show characteristic holes in the surface brightness. Many of these depressions of the brightness are coincident with patches of radio emission, e.g. in Abell 2052 (Blanton et al. 2001), Perseus (Boehringer et al. 1993, Churazov et al. 2000, Fabian et al. 2000), Cygnus A (Wilson et al. 2000 and Carilli et al. 1994), Abell 2597 (McNamara et al. 2001), MKW3s (Mazzotta et al. 2002), RBS797 (Schindler et al. 2001), HCG62 (Vrtilek et al. 2000) and Centaurus A (Saxton et al. 2001). In a recent compilation Birzan et al. (2004) lists 18 well documented clusters which show X-ray cavities with radio emission. The consensus on these observation is that the holes are caused by hot gas from an AGN that has displaced the ICM in these regions.
AGN have been observed to induce sonic motions in the intra-cluster medium which are believed to eventually dissipate to produce heat (Fabian et al. 2003, Ruszkowski et al. 2004a). Here, we simulate observations of emission lines of heavy ions that would reveal these motions directly. Such observations would enable us to gain a better understanding of how the kinetic energy is dissipated in the ICM. For heavy ions such as iron, the thermal velocity is a fraction of the speed of sound, i.e. where is the speed of sound, the mass of the proton and the mass of the iron nucleus. Consequently, the thermal broadening is small enough such that Doppler shifts of lines due to bulk motions may be detected. The ratio between the Doppler shift of a line due to large-scale motion with velocity and the thermal width
| (1) |
is given by
| (2) |
where is the frequency of the emission line and the local temperature of the ICM. All other symbols have their usual meaning. Doppler shifts of emission lines may be detected as long as the ICM is optically thin with respect to the line considered. Resonant scattering can increase the optical depth. However, Churazov et al. (2004) have performed XMM observations of the Fe K-lines near 6.7 keV in the Perseus cluster and concluded that resonant scattering may be suppressed by strong turbulence. Thus the velocities in the cluster center keep the medium optically thin, and consequently, the shapes and positions of the lines may reveal bulk motions in the ICM. The study of iron line profiles has previously been suggested as indicators for turbulence in the ICM by Inogamov & Sunyaev (2003) and Sunyaev et al. (2003).
Upcoming generations of X-ray observatories such as ASTRO-E2 will have an energy resolution of eV at full width at half-maximum in the photon range from 0.5 to 10 keV 111http://www.isas.ac.jp/e/enterp/missions/astro-e2/. This range includes the main lines from Fe XXV at energies around 6.7 keV which we are going to use as an example to study the effect of macroscopic motions. For the case of Perseus, ASTRO-E2 will be able to resolve the Fe-K line with a precision of better than 100 km/s. The XEUS mission222http://www.rssd.esa.int/index.php?project=XEUS&page=index is going to achieve an energy resolution of eV at spatial resolutions of a few arcseconds. This provides the opportunity to map the detailed velocity structure at least in the nearby clusters.
We have simulated the dynamics of buoyant bubbles in a realistic cluster using the AMR (adaptive mesh refinement) code FLASH. In this paper we study the exemplary spectra of helium-like iron lines along a variety of lines of sight through the cluster to search for signatures of motions induced by bubbles.
2 Simulation
Numerical simulations of hot, underdense bubbles in clusters of galaxies have been performed by a number of authors (e.g. Churazov et al. 2001, Quilis et al. 2001, Brüggen et al. 2002, Brüggen & Kaiser 2002, Reynolds et al. 2002, Ruszkowski et al. 2004a, Ruszkowski et al. 2004b, Dalla Vecchia et al. 2004). Common to these simulations is that they use a spherically symmetric, analytical profile for the ICM. However, for the purpose of studying the spectral features of AGN we were concerned that such a sterile environment without the typical motions expected in a cluster might result in unrealistically clean spectra. Therefore, we produced a three-dimensional hydrodynamical simulation of bubbles in a cluster that has been extracted from a cosmological simulation (similar to the one reported in Brüggen et al. (2005)). This simulation was computed with the Smooth-Particle Hydrodynamics (SPH) code GADGET in standard CDM cosmology (, , ) and is a re-run of the S2 cluster in Springel et al. (2001). At redshift this cluster has a mass of , a central density of cm-3 and a central temperature of 6 keV. This cluster was chosen because its total mass and central temperature were closest to the Perseus cluster ( keV and mass ). The SPH simulation of the cluster includes radiative cooling and star formation. The output of the SPH simulation serves as initial model for our AMR simulation.
FLASH is a modular block-structured AMR code, parallelised using the Message Passing Interface (MPI) library. It solves the Riemann problem on a Cartesian grid using the Piecewise-Parabolic Method (PPM) and, in addition, includes particles that represent the collisionless dark matter and stars. In our simulation 714346 particles were used. The particles are advanced using a cosmological variable-timestep leapfrog-method. Gravity is computed by solving Poisson’s equation with a multigrid method using isolated boundary conditions. For the relatively short physical time of the bubble simulation, radiative cooling and star formation are neglected, even though they were included in the cosmological SPH simulation with which the cluster was produced. The computational domain of our AMR simulation is a cubic box of side Mpc. For our grid, we chose a block size of zones and used outflow boundary conditions. The minimal level of refinement was set to 3 which means that the minimal grid contains zones. The maximum level of refinement was 7, which corresponds to an effective grid size of zones or an effective resolution of kpc. The code was run on 64 processors of the IBM p690 at the John-von-Neumann Institute for Computing in Jülich, Germany. A single run took approximately 5000 CPU hours.
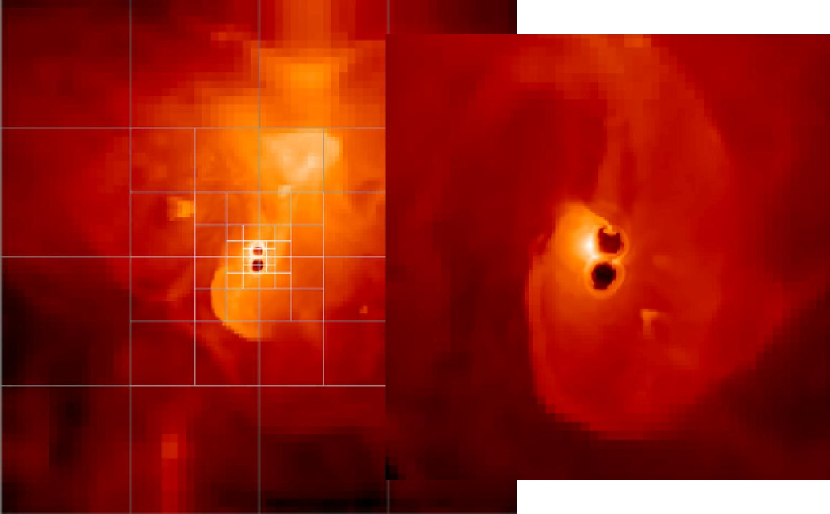
Fig. 1 shows the block boundaries in a slice displaying the gas density at a time of 70 Myr after the start of AGN activity. At this stage the bubble has not yet achieved pressure equilibrium with its surroundings and is still expanding nearly spherically into the ambient medium. The bubbles are nearly spherical and do not look dissimilar from the bubbles observed in the Perseus cluster and other clusters. As a result of its rapid inflation, it has produced a weak shock wave that has started to travel outwards from the bubbles. This shock wave is clearly visible in the density plot (Fig. 1). The same figure also shows that the cluster is quite dynamic and shows significant substructure such as clumps and shock fronts.
The AGN is assumed to sit in the center of the cluster. Energy is injected into two spherical regions that lie at a radial distance of 30 kpc on either side of the center of the cluster. The energy is injected by increasing the specific internal energy within the injection regions at a constant rate. For a period of years a total energy of erg per bubble is injected into two spherical regions of radius 13 kpc. These parameters were chosen because they produced bubbles that are very similar to those observed in the Perseus cluster.
3 Results and Discussion
Here we investigate the spectral signatures of AGN-induced motions at the example of the complex near the FeXXV Kα line. The spectra are computed using the ATOMDB database (http://cxc.harvard.edu/atomdb/). For each temperature ATOMDB determines the ionization fractions and the emissivity. The emissivity from each computational cell is obtained (i) by convolving the line spectrum with a Gaussian of width to model the thermal broadening and (ii) by Doppler-shifting the line by the corresponding velocity component .
The spectral surface brightness is determined by integrating along the line of sight
| (3) |
where is the electron number density, the number density of iron atoms and the emissivity. Here, we neglect the effect of the cosmological redshift since the redshift difference of light emitted from the front and the back of the cluster is small compared to bulk motion redshift. The bulk motions caused by cluster mergers or – as considered here – a central AGN may cascade down to sub-grid turbulent motions. This small-scale turbulence produces additional line broadening as described in Inogamov & Sunyaev (2003) and Sunyaev et al. (2003). Here we ignore Doppler broadening below the grid scale since it is small compared to the Doppler shifts produced by the macroscopic motions (see Inogamov & Sunyaev (2003)). Thus, the line width of gas within a single cell is given solely by the thermal width: , see Eq. (1).
Finoguenov et al. (2000) investigated the heavy element distribution in clusters and found that iron is generally more abundant in the central regions. Since our single-fluid simulation does not trace any chemical enrichment history, we need to model the iron abundance. Several clusters that resemble our model cluster, show a decrease in their iron abundance beyond . Only clusters that have suffered a recent merger have a more uniform iron abundance. Cluster A3112 has a temperature of , hosts a powerful radio source in its center and is believed to have a strong cooling flow. Hence, we chose it as a model for our iron abundance profile which we approximate by
| (4) |
with , which is the radius at which the iron abundance in A3112 drops to one half. This is a conservative model because in the Perseus cluster the metals are even more centrally concentrated (Schmidt et al., 2002) which would lead to an increased sensitivity of Fe-line Doppler shifts to motions in the cluster center.
For reference Fig. 2 shows a spectrum in the vicinity of the FeXXV Kα transition. This spectrum is merely thermally broadened and ignores all hydrodynamic Doppler shifts. It is computed along a line of sight through the center of the cluster before the onset of AGN activity.
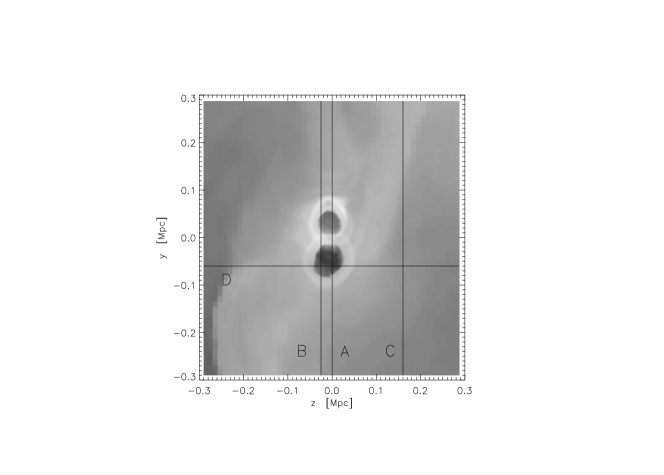
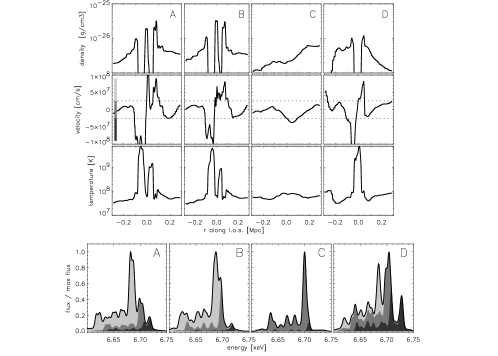
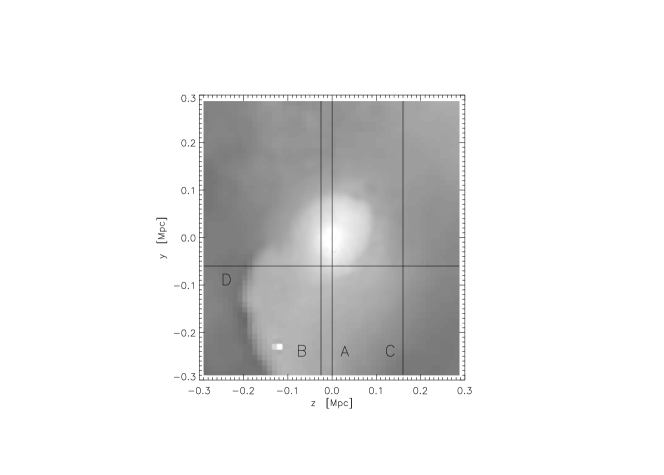
Now we wish to compare this spectrum to one that includes hydrodynamic motions. Fig. 3 shows a density contour plot with some exemplary lines of sight (labelled A-D) which intersect the cluster at various impact parameters and from various directions. Below are the corresponding profiles (density, l.o.s. velocity and temperature) and spectra. For those l.o.s. that cross a bubble the density profiles clearly shows the underdense regions. L.o.s. A and B intersect both bubbles, while line D intersects only one bubble in a direction perpendicular to the jet axis; finally line C is significantly off-set from the center and removed from all AGN activity. The underdense bubbles are surrounded by shells of compressed material with temperatures of about , which gives rise to significant FeXXV emission. At the same time, these shells show the highest velocities which are in excess of . As a result the most prominent emission line shows a clear triplet structure, as for example in line A: On top of the unshifted emission coming from regions removed from the bubble regions, there are both a red-shifted and a blue-shifted line. The resulting separation of the two shifted lines is approximately . In order to identify which parts of the spectrum are produced by which regions, we have split up the spectrum according to which velocity the emitting gas has. In Fig. 3 the light gray area shows the contribution to the total spectrum coming from gas whose velocity lies above the upper dashed line in the velocity profile, the dark gray area corresponds to gas below the lower dashed line in the velocity profile and the medium gray corresponds to gas in the middle part. Finally, the bold line shows the total spectrum. Thus, we can see that the blue-shifted line comes from the lower rim of the gas which has large negative velocities (indicating motion towards the observer) and the red-shifted peak comes from the rim which has large positive velocities. The resulting effective broadening of the line is greater than 35 eV and will thus be detectable with the next generation of X-ray telescopes.
The l.o.s. labelled B with an impact parameter of kpc also crosses both bubble rims. Again it yields a multi-line structure in the spectrum leading to a broadening of about . Clearly, the velocity shifts are discernible over the entire scale of the bubbles. For comparison, l.o.s. C which is off-set from the center and unaffected by the AGN shows very little broadening and no splitting. The spectrum differs very conspicuously from those of lines A and B.
The same feature is observed when the line of sight is perpendicular to the axis of the AGN as in line D. Whenever the l.o.s. crosses the hot, fast-moving material in the bubble rim, the main line becomes strongly broadened or split. The broadening of the most prominent line is even greater than for lines A and B, amounting to to . Furthermore, the amount of compressed material in the rim is smaller, hence the shifted features have less emission. Since the bubble is at a fairly early phase in its evolution, the bubble rims are expanding which leads to Doppler shifts and a marked feature in the resulting spectrum.
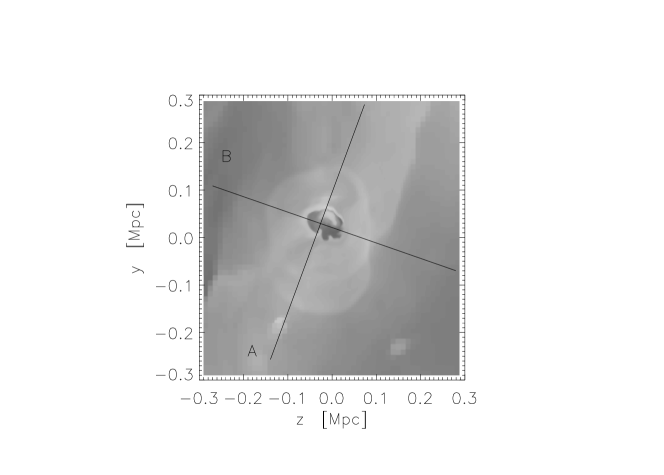
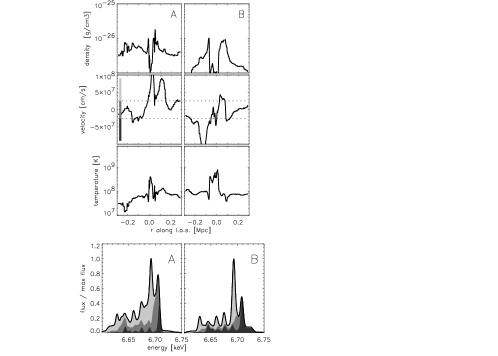
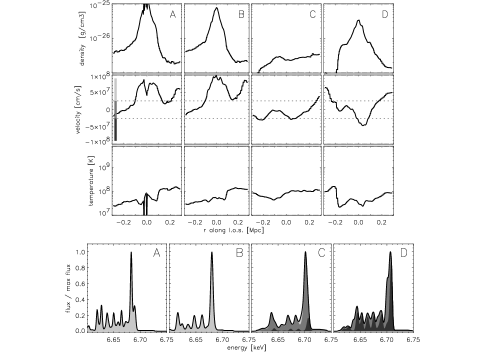
In Fig. 4 we show the bubble at a later stage ( Myrs). In the cut through the center of the cluster only one bubble is visible now as the second one has already been advected out of the plane, i.e. ambient motions have moved it in a direction perpendicular to the cut through the computational domain shown in Fig. 4. We show two characteristic l.o.s., A and B. Again, both spectra show a splitting of the most prominent line. As in the previous snapshot, these features are produced by the fast material that is pushed out as the bubble rises and expands. Fig. 4 shows that virtually all l.o.s. through the bubble show strong traces of the bubble in their spectra and that these signatures do not solely occur in the early phase of their evolution. For comparison we have computed spectra along identical lines-of-sight in the same cluster but without bubbles (see Fig. 5). It is apparent from comparison with Fig. 3 that, in the absence of bubbles, the lines are very much less affected and, consequently, that the bubble-induced motion leave a clear imprint on the spectra.
To summarise one can cite two conditions for observing the bubble-induced velocities via X-ray lines from heavy ions: First, the gas needs to show sufficiently large velocities relative to the ambient ICM. In the study presented here the inflation of the bubbles leads to velocities of about 500 to which is a significant fraction of the local sound speed. Second, the accelerated material needs to emit a sufficient amount of photons in the chosen lines. Thus, the early phase of bubble motion is advantageous (for FeXXV), since the adiabatically compressed material ahead of the bubble has not had enough time to cool. As a consequence of the compression the gas is dense and hot which, in turn, leads to a high emissivity and a strong emission signal. However, the effects on the spectrum are not confined to the very early phases. They should persist for at least 100 Myrs after the onset of AGN activity. Once the material around the rims has cooled down significantly, we expect the effects on the spectrum to wane.
In Fig. 6 we have plotted the velocity distribution, weighted with the emissivity in the FeXXV Kα line, in a volume of size 60 kpc x 60 kpc x 600 kpc, parallel to the line-of-sight and centred on a bubble. The bold line refers to the cluster with bubbles and the thin line to the run without bubbles. This histogram reveals that the presence of the AGN leads to a broadening of the velocity distribution. This difference in the emission-weighted velocity distribution leads to discernible differences in the spectrum, even if averaged over a large field of view.
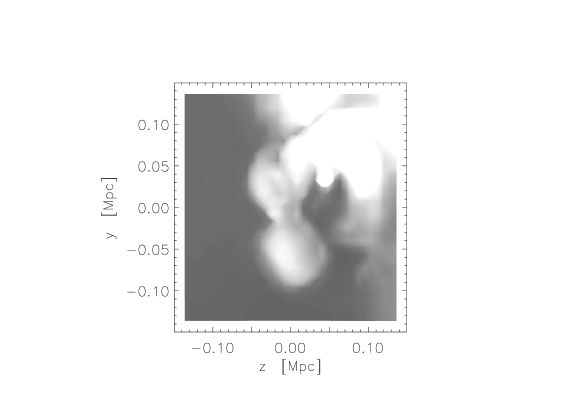
Besides inspecting spectra along individual lines of sight one can attempt to quantify the effects caused by bubble motions by reducing the line shifts to a single parameter. To demonstrate this we have produced a map of the number of photons in the band [6.71-6.73] keV normalised by the number of photons in a reference band between [6.68-6.71] keV. The band between 6.71-6.73 keV was chosen because in the absence of motions one would expect very little emission in this band because it lies blueward of the FeXXV complex and is not contaminated by any other lines. Thus, emission in this band is a clear indication of blue-shifted lines from the Fe complex.
Fig. 7 shows such a map which reveals a dumbbell-shaped imprint from the blue-shift produced by the gas pushed out radially by the bubbles. On the upper right-hand corner one can see additional bright features that are related to substructure near the center of the cluster. Clearly this simple procedure is susceptible to any effect that alters the emission ratio between the two bands. For instance the large-scale streaming motion of the gas can be clearly seen from the overall gradient in Fig. 7. Therefore, it is particularly encouraging that the bubbles leave such a distinct imprint on the map.
The bubbles depicted in Fig. 7 resemble those observed in the Perseus cluster (Fabian et al. 2003). The bubbles in our simulation start with a larger separation and they are already larger in size compared to those in Perseus. However, when our line of sight is perpendicular to the jet axis, as it is in the case of Perseus, the early stages of the bubble evolution should be detectable in a map such as Fig. 7 since the bubbles are still expanding. Therefore, we would expect a strong blue excess for the innermost region within about kpc from the center. The temperature map of Perseus (Fabian et al. 2003) shows that the material around the bubbles is to some extent colder than the ICM in average. Fig. 4 l.o.s. B resembles such a situation, the bubbles are surrounded by cold material, still a significantly shifted line is discernible.
Since the bubble configuration presented here is similar to that in Perseus, it may shed some light on the gas velocities typically present in clusters with active bubble formation. Churazov et al. (2004) argued from the absence of resonant scattering that motions with velocities half of the speed of sound are present in the cluster core. The l.o.s. A in Fig. 3 indicates that the gas between the bubbles is also highly accelerated. The same is true for gas close to a bubble as can be seen from l.o.s B. The study of the velocity structure around X-ray cavities would help to determine the mechanical energy that resides in the bubbles and thereby the kinetic luminosity of the AGN. This, again, is important for establishing how much energy is available for dissipation that can offset cooling in the core of the cluster.
Summary:
-
•
AGN-induced motions of the ICM can significantly alter the line shapes of X-ray lines of heavy ions. For a typical bubble in a cluster such as Perseus these line shifts are greater than 20 eV for all lines of sight that intersect the bubble and should therefore be observable with the next generation of X-ray spectrographs.
-
•
Here we studied the line shift at the example of the FeXXV lines around 6.7 keV. The line shifts are caused primarily by the hot compressed rims of the expanding bubble. Other regions of the cluster contribute relatively little to the distortions of the line. The line shifts are therefore relatively insensitive to other motions along the line of sight in the outer regions of the cluster. Observations of such line shifts should allow a better determination of the energy that resides in the bubbles and the motions they induce in the ICM.
acknowledgement
We thank Volker Springel for providing us with some of his simulations and Hans Boehringer for helpful comments on the paper. MB gratefully acknowledges support by DFG grant BR 2026/2 and the supercomputing grant NIC 1658. MR acknowledges the support from NSF grant AST-0307502 and NASA through Chandra Fellowship award number PF3-40029 issued by the Chandra X-ray Observatory Center, which is operated by the Smithsonian Astrophysical Observatory for and on behalf of NASA under contract NAS8-39073. The software used in this work was in part developed by the DOE-supported ASCI/Alliance Center for Astrophysical Thermonuclear Flashes at the University of Chicago. Finally, the referee is thanked for many helpful comments.
References
- Blanton et al. (2001) Blanton, E. L., Sarazin, C. L., McNamara, B. R., & Wise, M. W. 2001, ApJ, 558, L15
- Boehringer et al. (1993) Boehringer, H., Voges, W., Fabian, A. C., Edge, A. C., & Neumann, D. M. 1993, MNRAS, 264, L25
- Brüggen & Kaiser (2002) Brüggen, M. & Kaiser, C. R. 2002, Nature, 418, 301
- Brüggen et al. (2002) Brüggen, M., Kaiser, C. R., Churazov, E., & Enßlin, T. A. 2002, MNRAS, 331, 545
- Brüggen et al. (2005) Brüggen, M., Ruszkowski, M., & Hallman, E. 2005, astro-ph/0501175
- Carilli et al. (1994) Carilli, C. L., Perley, R. A., & Harris, D. E. 1994, MNRAS, 270, 173
- Churazov et al. (2001) Churazov, E., Brüggen, M., Kaiser, C. R., Böhringer, H., & Forman, W. 2001, ApJ, 554, 261
- Churazov et al. (2000) Churazov, E., Forman, W., Jones, C., & Böhringer, H. 2000, A&A, 356, 788
- Churazov et al. (2004) Churazov, E., Forman, W., Jones, C., Sunyaev, R., & Böhringer, H. 2004, MNRAS, 347, 29
- Dalla Vecchia et al. (2004) Dalla Vecchia, C., Bower, R. G., Theuns, T., Balogh, M. L., Mazzotta, P., & Frenk, C. S. 2004, MNRAS, 507
- Fabian (2003) Fabian, A. C. 2003, in Revista Mexicana de Astronomia y Astrofisica Conference Series, 303–313
- Fabian et al. (2003) Fabian, A. C., Sanders, J. S., Allen, S. W., Crawford, C. S., Iwasawa, K., Johnstone, R. M., Schmidt, R. W., & Taylor, G. B. 2003, MNRAS, 344, L43
- Fabian et al. (2000) Fabian, A. C., Sanders, J. S., Ettori, S., Taylor, G. B., Allen, S. W., Crawford, C. S., Iwasawa, K., Johnstone, R. M., & Ogle, P. M. 2000, MNRAS, 318, L65
- Finoguenov et al. (2000) Finoguenov, A., David, L. P., & Ponman, T. J. 2000, ApJ, 544, 188
- Hoeft & Brüggen (2004) Hoeft, M. & Brüggen, M. 2004, ApJ, 617, 896
- Inogamov & Sunyaev (2003) Inogamov, N. A. & Sunyaev, R. A. 2003, Astronomy Letters, 29, 791
- Mazzotta et al. (2002) Mazzotta, P., Kaastra, J. S., Paerels, F. B., Ferrigno, C., Colafrancesco, S., Mewe, R., & Forman, W. R. 2002, ApJ, 567, L37
- McNamara et al. (2001) McNamara, B. R., Wise, M. W., Nulsen, P. E. J., David, L. P., Carilli, C. L., Sarazin, C. L., O’Dea, C. P., Houck, J., Donahue, M., Baum, S., Voit, M., O’Connell, R. W., & Koekemoer, A. 2001, ApJ, 562, L149
- Quilis et al. (2001) Quilis, V., Bower, R. G., & Balogh, M. L. 2001, MNRAS, 328, 1091
- Reynolds et al. (2002) Reynolds, C. S., Heinz, S., & Begelman, M. C. 2002, MNRAS, 332, 271
- Ruszkowski et al. (2004a) Ruszkowski, M., Brüggen, M., & Begelman, M. C. 2004a, ApJ, 611, 158
- Ruszkowski et al. (2004b) —. 2004b, ApJ, 615, 675
- Saxton et al. (2001) Saxton, C. J., Sutherland, R. S., & Bicknell, G. V. 2001, ApJ, 563, 103
- Schindler et al. (2001) Schindler, S., Castillo-Morales, A., De Filippis, E., Schwope, A., & Wambsganss, J. 2001, A&A, 376, L27
- Schmidt et al. (2002) Schmidt, R. W., Fabian, A. C., & Sanders, J. S. 2002, MNRAS, 337, 71
- Springel et al. (2001) Springel, V., White, S. D. M., Tormen, G., & Kauffmann, G. 2001, MNRAS, 328, 726
- Sunyaev et al. (2003) Sunyaev, R. A., Norman, M. L., & Bryan, G. L. 2003, Astronomy Letters, 29, 783
- Vrtilek et al. (2000) Vrtilek, J. M., David, L. P., Grego, L., Jerius, D., Jones, C., Forman, W., Donnelly, R. H., & Ponman, T. J. 2000, in Constructing the Universe with Clusters of Galaxies
- Wilson et al. (2000) Wilson, A. S., Young, A. J., & Shopbell, P. L. 2000, ApJ, 544, L27